

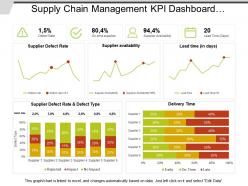
Supply chain management kpi dashboard showing defect rate and delivery time





Try Before you Buy Download Free Sample Product
 Impress Your
Audience
 100%
Editable
 Save Hours
of Time


Get in the glare with our Supply Chain Management Kpi Dashboard Showing Defect Rate And Delivery Time. Be the focus of their attention.
People who downloaded this PowerPoint presentation also viewed the following :
Supply chain management kpi dashboard showing defect rate and delivery time with all 6 slides:
Give a detailed account of each influential factor with our Supply Chain Management Kpi Dashboard Showing Defect Rate And Delivery Time. Eliminate any chance of doubts forming.


FAQs for Supply chain management kpi dashboard showing defect rate
Essential KPIs for supply chain management dashboards include inventory turnover, order fulfillment rates, supplier performance metrics, cost per shipment, and demand forecast accuracy. These indicators enable organizations to streamline operations, minimize disruptions, and enhance customer satisfaction, with many manufacturing and retail companies finding that comprehensive dashboard visibility delivers significant cost reductions and competitive advantage.
Visualizations enhance supply chain data understanding by transforming complex metrics into intuitive charts, graphs, heat maps, and real-time tracking displays that reveal patterns and bottlenecks instantly. These visual elements enable supply chain managers to quickly identify delivery delays, inventory shortages, and performance trends across multiple vendors and locations, ultimately streamlining decision-making and operational efficiency.
Real-time data enables supply chain optimization by providing instant visibility into inventory levels, demand fluctuations, supplier performance, and logistics bottlenecks across the entire network. This immediate insight allows organizations to make proactive adjustments, reduce waste, and respond swiftly to disruptions, with many manufacturers and retailers finding that real-time monitoring ultimately delivers enhanced operational efficiency and improved customer satisfaction.
Predictive analytics integrates into supply chain dashboards through machine learning algorithms, demand forecasting models, risk assessment tools, and real-time data processing capabilities that analyze historical patterns and market trends. These technologies enable organizations to anticipate disruptions, optimize inventory levels, and streamline procurement decisions, with manufacturing and retail companies finding that predictive insights deliver significantly faster response times and enhanced operational efficiency.
Best practices for designing user-friendly supply chain dashboards include prioritizing real-time visibility, implementing intuitive navigation, using clear data visualization, ensuring mobile responsiveness, and customizing views for different user roles. These design principles streamline decision-making by reducing information overload, enhancing operational transparency, and enabling quick identification of bottlenecks, with many logistics managers finding that well-designed dashboards ultimately deliver faster response times and improved supply chain efficiency.
Supply chain dashboards help identify bottlenecks by providing real-time visibility into inventory levels, transportation delays, supplier performance metrics, and production schedules across all operations. Through automated alerts and predictive analytics, organizations can quickly pinpoint disruptions in manufacturing, warehousing, or distribution processes, ultimately enabling faster responses and minimizing costly delays throughout their networks.
Essential supplier performance metrics include on-time delivery rates, quality scores, cost variance, lead times, and compliance ratings. These metrics enable procurement teams to identify bottlenecks, negotiate better contracts, and maintain supplier relationships, with many organizations finding that real-time visibility ultimately delivers reduced costs and enhanced operational efficiency.
Dashboards enable effective inventory monitoring by providing real-time stock levels, automated reorder alerts, turnover analytics, and demand forecasting capabilities across multiple locations. Through integrated tracking systems, organizations streamline inventory management by reducing stockouts, minimizing carrying costs, and optimizing reorder timing, with many retailers and manufacturers finding that centralized visibility ultimately delivers improved cash flow and customer satisfaction.
Stakeholder collaboration ensures supply chain dashboards capture diverse operational perspectives, from procurement and logistics to finance and customer service, creating comprehensive visibility across all touchpoints. This collaborative approach delivers more accurate data integration, better user adoption, and strategic alignment, with organizations finding that cross-functional input ultimately enhances decision-making speed and supply chain responsiveness.
Dashboards support supply chain disruption decisions by providing real-time visibility into inventory levels, supplier performance, logistics bottlenecks, and demand fluctuations across all network nodes. These centralized platforms enable managers to quickly identify alternative suppliers, reroute shipments, and reallocate resources, with many organizations finding that automated alerts and predictive analytics ultimately minimize disruption impact and accelerate recovery times.
Popular supply chain dashboard tools include Tableau, Power BI, SAP Analytics Cloud, Oracle Supply Chain Management Cloud, and QlikView. These platforms streamline operations by providing real-time visibility, automated reporting, and predictive analytics capabilities, with many logistics companies and manufacturers finding that integrated dashboards significantly enhance decision-making speed and operational efficiency.
Supply chain sustainability dashboards enable organizations to monitor carbon footprints, waste reduction, energy consumption, supplier compliance scores, and resource efficiency metrics in real-time. Through integrated tracking systems, companies streamline environmental reporting, identify improvement opportunities, and ensure regulatory compliance, while many manufacturing and retail organizations finding that comprehensive sustainability visibility ultimately delivers cost savings and enhanced brand reputation.
When customizing supply chain dashboards for different user roles, factors include user responsibilities, decision-making authority, data access levels, operational focus areas, and strategic versus tactical needs. Executives require high-level KPIs and trend analysis, while warehouse managers need real-time inventory tracking and logistics coordinators focus on shipment statuses, ultimately ensuring each role receives relevant, actionable insights for optimal performance.
Mobile accessibility enhances supply chain management dashboards by enabling real-time monitoring, instant decision-making, and immediate response to disruptions from any location. Through mobile-optimized interfaces, supply chain managers can track shipments, monitor inventory levels, and coordinate with suppliers while traveling or working remotely, ultimately delivering faster problem resolution and maintaining operational continuity across global networks.
Data integration challenges include disparate system formats, real-time synchronization issues, data quality inconsistencies, legacy system compatibility, and vendor API limitations across multiple touchpoints. These technical hurdles can be streamlined through standardized protocols, middleware solutions, and automated validation processes, with many organizations finding that investing in robust integration architecture ultimately delivers enhanced visibility, faster decision-making, and competitive operational advantage.
-
Innovative and Colorful designs.
-
Awesome presentation, really professional and easy to edit.