


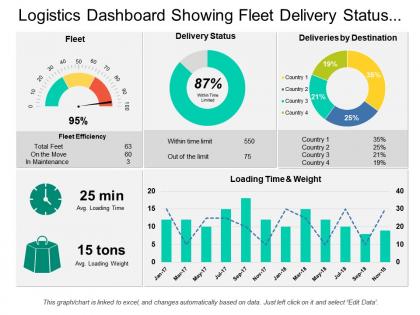
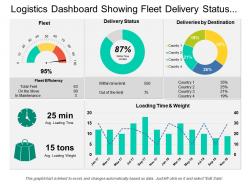
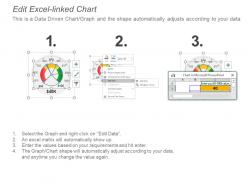
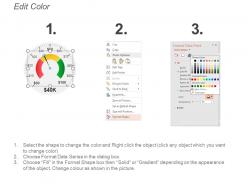
Logistics dashboard showing fleet delivery status and delivery by destination




Try Before you Buy Download Free Sample Product
 Impress Your
 Audience
 100%
100% Editable
 Save Hours
 of Time


Establish a footprint across continents with our Logistics Dashboard Showing Fleet Delivery Status And Delivery By Destination. You will emerge as a global figure.
People who downloaded this PowerPoint presentation also viewed the following :
Logistics dashboard showing fleet delivery status and delivery by destination with all 6 slides:
Create a driving force with our Logistics Dashboard Showing Fleet Delivery Status And Delivery By Destination. Bring about a fusion of energies.
FAQs for Logistics dashboard showing fleet delivery status and
Focus on what actually matters - delivery times, on-time rates, and cost per shipment. Transit times and carrier scores too. I'd throw in warehouse productivity (picks per hour) and inventory turnover. Customer satisfaction is gold if you can track it, though that's sometimes tricky to get real data on. Honestly, most dashboards are complete garbage because they try tracking like 20 things. Stick to 6-8 max so you can actually see patterns. Pick whatever matches your current headaches - no point tracking fuel costs if that's not bleeding you dry right now.
Honestly, real-time dashboards are a total game-changer. Instead of waiting around for those end-of-day reports (which are basically useless), you'll catch problems right when they happen. Traffic jam screwing up your delivery route? You'll see it instantly and can reroute. Same with inventory issues or bottlenecks between warehouses. The visual format makes patterns super obvious - way better than staring at spreadsheets all day. Your whole team stays on the same page too since everyone's looking at live data. My advice? Figure out what drives you crazy every single day and put those metrics right at the top of your dashboard.
So predictive analytics is like turning your logistics setup into a fortune teller. You're not just staring at what already went wrong - now you can actually see demand spikes coming, catch delays before they screw you over, and know when equipment's about to die. Pretty slick, right? The trick is setting up alerts for stuff you can actually do something about, otherwise you'll just drown in useless forecasts. I love how you can spot problems weeks out and reroute everything ahead of time instead of playing firefighter all day.
Honestly, getting a logistics dashboard was one of the best decisions we made last year. No more waiting around for weekly reports or playing phone tag with suppliers. Real-time tracking shows you exactly where shipments are, inventory levels, delays - the whole picture. Everyone's looking at the same data instead of operating blind and blaming each other when stuff hits the fan. Set up alerts so key people get pinged automatically when shipments are running late or stock gets low. Your customers and suppliers will actually trust you more because they can see what's happening too. Game changer, seriously.
WMS, TMS, and ERP systems are your big three - they handle most of the heavy lifting. Then you've got carrier APIs for tracking stuff in real-time, plus IoT sensors if you need temperature or location data. EDI feeds and customer portals come up a lot too. The annoying part? Getting everything to actually sync up properly. It's like trying to get five different apps to share a playlist. Most places also connect their inventory systems and sometimes 3PL platforms. I'd map out what you already have first - see what data lives where. That way you can tackle the integrations that'll actually move the needle instead of just creating more headaches.
Dude, dashboard customization is honestly a game-changer. People actually USE it when they can pick their own widgets and alerts instead of scrolling through random stuff that doesn't apply to them. Your team will spot problems way faster too - no more waiting around for reports to get generated. I'd start simple though. Just have everyone pick their top 5 metrics first. You can always add more later, but don't overwhelm them right off the bat. When people can see exactly what matters to their job, they'll check it constantly and make decisions quicker. It's like the difference between a messy desk and an organized one, you know?
Put your most important stuff right at the top - delivery times, inventory, costs. That's where people look first anyway. Group similar metrics together so you're not jumping all over the place to find what connects. Don't go crazy cramming every single number onto one screen though, it just looks messy. Honestly, I've seen dashboards that are basically unreadable because of this. Stick with the same colors and fonts throughout. Make your alerts pop - if everything's flashing red, nothing stands out. Oh, and definitely test it with real users first. They'll catch things you missed.
Dude, logistics dashboards are seriously clutch for inventory stuff. You get real-time data on what's running low or piling up too high. All your demand patterns and reorder points live in one spot - honestly feels like cheating sometimes. The automated alerts alone make it worth it, hitting you up when stock gets dicey. You can also track how your suppliers are doing with delivery times, which helps you time orders better. Oh, and definitely start with alerts on your bestsellers first. Way easier than trying to set up everything at once.
Honestly, the worst part is usually getting all your scattered data to talk to each other - it's such a mess when you've got info sitting in like 5 different systems. People pushback is huge too. Half your team will resist anything new or just won't trust the numbers you're showing them. Data quality becomes this whole thing because if your info is garbage, your decisions will be too. Oh, and picking the right metrics to track is trickier than it sounds. My advice? Don't go crazy trying to dashboard everything right away. Pick one process, nail that first, then build out from there.
Dude, mobile dashboards are seriously clutch for logistics stuff. You can check shipment status and inventory levels right from your phone while you're running between warehouses or stuck in meetings. Everything resizes automatically so you can actually read the charts without squinting. When something goes wrong - like a delayed shipment - you'll spot it fast and can reroute on the spot instead of waiting until you're back at your desk. Oh, and definitely turn on push notifications for the urgent stuff. Trust me, it beats constantly refreshing your email hoping nothing's on fire.
Honestly, most places I've seen use Tableau, Power BI, or Qlik for the serious analytics work. Power BI's usually the sweet spot for mid-size companies - good bang for your buck. Excel dashboards are everywhere too (yeah, I know it's basic but whatever works, right?). If you're already running SAP or Oracle systems, their analytics tools plug right in which is nice. Some of the more tech-savvy teams are doing custom Python builds or using Grafana. Really just comes down to what data you're working with and how much you want to spend.
Honestly, just bake it right into how you work. Monthly sit-downs with real users are gold - they'll literally show you what's broken while using it. I'd also throw some feedback buttons directly in the dashboard so people don't have to jump through hoops to complain (or praise, I guess). Surveys are fine but kinda meh compared to watching someone actually struggle with your interface. The trick is making it regular, not some one-off thing you do when the boss asks. Oh, and schedule that first session like... this week before you forget.
Honestly, start with the basics - on-time delivery rates and transit times are your bread and butter. Cost per shipment too, obviously. Fuel's killing everyone right now so definitely watch that closely. Route efficiency matters more than people think. I'd throw in carrier performance scores and track any delivery hiccups. Customer satisfaction is pretty crucial since shipping screwups directly tick people off. Oh, and capacity utilization so you're not burning money on half-empty trucks. These'll give you a solid foundation, then just add whatever else makes sense for your specific setup.
Honestly, logistics dashboards are pretty clutch for this stuff. You can see your carbon emissions and fuel usage in real-time, which is way better than getting reports weeks later. Track things like which routes are wasting gas or how well you're hitting your green goals. The cool part? You'll start noticing patterns - like certain carriers who consistently suck at emissions. Use that data to consolidate shipments better or switch to greener transport options. My advice though - don't go crazy tracking everything day one. Pick maybe 2-3 sustainability metrics first, then expand from there.
First thing - audit what you're already sharing because I bet it's more than you think. Set up role-based access so partners only get their slice, not your whole operation. Ditch the email spreadsheets (seriously, that's just asking for trouble) and use encrypted portals instead. Anonymize customer data and watermark reports so you can trace leaks if they happen. Oh, and put expiration dates on dashboards since partnerships don't last forever. Tighten up those permissions before your next partner meeting rolls around.
-
Informative design.
-
Unique and attractive product design.