


Logistics Service Delivery Status Dashboard




Try Before you Buy Download Free Sample Product
 Impress Your
 Audience
 100%
100% Editable
 Save Hours
 of Time


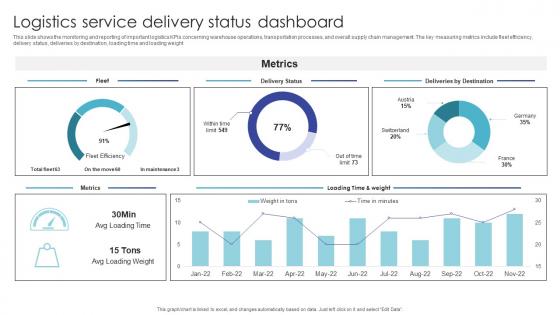
This slide shows the monitoring and reporting of important logistics KPIs concerning warehouse operations, transportation processes, and overall supply chain management. The key measuring metrics include fleet efficiency, delivery status, deliveries by destination, loading time and loading weight.
People who downloaded this PowerPoint presentation also viewed the following :
Logistics Service Delivery Status Dashboard with all 7 slides:
Use our Logistics Service Delivery Status Dashboard to effectively help you save your valuable time. They are readymade to fit into any presentation structure.





FAQs for Logistics Service
Honestly, just pick the stuff that actually matters to your business. On-time delivery and order accuracy are obvious ones. Shipping costs as percentage of revenue too. Inventory turnover is clutch - shows if you're sitting on too much dead stock. I'd throw in pick/pack times and maybe carrier scorecards. Customer satisfaction scores are gold if you track them. Transportation costs are killing everyone right now so definitely watch those. But seriously, don't go crazy with like 15 different metrics. Stick to 6-8 max or you'll lose focus. Pick what hits your wallet and keeps customers happy.
So real-time data integration basically makes your logistics dashboard actually useful instead of just showing you old info. You'll see shipment locations, inventory, delivery status - all updating as it happens. Way better than refreshing a bunch of different systems constantly (which honestly drives me crazy). When delays pop up, you can reroute stuff immediately and keep customers in the loop. It's like watching live updates vs reading yesterday's newspaper. Push for APIs that stream data directly into your dashboard rather than those clunky batch uploads that run overnight.
Honestly, data viz is a game changer for logistics mess. You know how you're drowning in spreadsheets? Visual dashboards show you exactly where deliveries are backing up, which routes suck, and what's causing inventory headaches. Heat maps make bottlenecks super obvious - way better than scanning endless rows of numbers. You'll catch problems before they blow up your budget. I'd start with tracking whatever's giving you the biggest headaches right now, then build out from there. It's like finally being able to see what's actually happening in your supply chain instead of guessing.
So basically a logistics dashboard shows you what's happening with your inventory right now - like which stuff you're running low on or have way too much of. Pretty handy actually. You can see stock levels, how fast things are selling, demand trends, all that good stuff in one spot. It'll ping you when you need to reorder something too. Oh and you can tell which products are flying off the shelves versus just sitting there forever. I'd start with alerts for your best-selling items first since that's where the money is anyway.
Honestly, the data integration stuff is gonna be your biggest pain. Getting WMS, TMS, and ERP systems to play nice together? Good luck with that mess. Plus your data quality will probably suck at first - logistics info is all over the place. But here's what really gets me: people will fight you tooth and nail to keep using their crusty Excel sheets instead of your shiny new dashboard. Change management is brutal. Oh, and real-time tracking can bog things down performance-wise. My advice? Start with just one data source and maybe 2-3 users who actually want this thing to work.
So basically you hook up your old logistics data to ML models that predict demand spikes, delays, all that stuff. Your dashboard shows these as trend lines or alerts next to the live data. Start with demand forecasting - honestly it's the lowest hanging fruit and helps you prep for busy periods. Just make sure your data isn't trash first, because garbage in equals garbage out (learned that the hard way). The predictions show up as probability scores or notifications. Pretty much gives you a heads up before things go sideways, which is clutch for staffing decisions.
Honestly, start with real-time tracking and inventory levels - that stuff will save your sanity. Delivery updates are huge too since you won't be calling carriers every five minutes. Set up alerts for delays because surprises suck in logistics. KPI dashboards showing delivery rates and costs are pretty essential, plus you need decent search functionality. Nobody wants to dig through massive shipment lists. Oh, and make it mobile-friendly since your team's probably running around warehouses half the time. Clean interface matters more than you'd think. Get those basics down first, then worry about the bells and whistles once people actually use it.
Honestly, mobile access is a lifesaver for logistics stuff. You can check shipment statuses and catch delays before they become disasters - even when you're stuck in traffic or whatever. The best part? You don't have to wait until you're back at your desk to fix things. I'd definitely set up push notifications for the urgent alerts first. That way you can update people, reroute shipments, or call drivers right away. Super helpful when you're traveling a lot. Just maybe don't check it obsessively during actual conversations - learned that one the hard way.
Track your key metrics in real-time and set up alerts when things drop below your benchmarks. When delivery times spike, drill down to see which routes or carriers are the problem. Some dashboards let you add notes right on incidents - honestly pretty handy. Schedule weekly team reviews to spot trends and figure out fixes. Oh, and this is crucial: actually measure if your changes worked. Most people skip that step and wonder why problems keep coming back. The whole point is creating that feedback loop where data drives decisions.
So basically operational dashboards are for the day-to-day stuff - delivery times, warehouse capacity, current shipments. Your ops team lives in these to keep everything moving. Strategic ones are totally different though. They're more big picture, showing monthly trends and KPIs that executives actually care about for planning ahead. Honestly, it's like the difference between checking your GPS mid-drive versus mapping out your whole vacation route beforehand. Most people end up needing both, but I'd start with whatever matches what you're doing daily. No point stressing over quarterly metrics if you're just trying to track today's shipments, you know?
So regulations basically tell you what data to track and where to put it on your dashboard. Pharma needs temperature monitoring right up front for cold chain stuff. Food industry? Expiration dates and traceability take over your whole screen. Aviation's documentation requirements are absolutely insane - those dashboards look like spaceship control panels, I swear. Financial services want audit trails visible 24/7. Here's the thing though: figure out your industry's must-have compliance points first, then build everything else around those instead of just throwing general logistics stuff everywhere.
Tableau and Power BI are your best bets - there's a reason everyone uses them for supply chain stuff. Google Data Studio is solid if you're watching costs, just has fewer bells and whistles. Excel dashboards can actually work pretty well too (don't judge me lol). Real-time tracking is where things get interesting though - FourKites and project44 are solid picks that play nice with the bigger platforms. My advice? Start by figuring out what data you're working with first. Then just grab whatever connects easiest to your existing systems. Makes life way simpler.
So ML is way better than those old static formulas because it actually learns from your shipping history, seasonal stuff, and outside factors. Really cool how it spots patterns you'd never see - like weather messing with delivery routes or certain products always selling together. The predictions get smarter over time too, which is honestly the best part. You'll need clean data from your warehouse and transport systems though. Oh, and don't try to do everything at once - figure out which forecasts actually matter to your ops first, then get your tech people to build models for just those areas.
Start with role-based access - only let people see what they actually need for their jobs. Multi-factor authentication is non-negotiable these days. Encrypt everything in transit and at rest, plus set up audit logs so you know who's poking around your data. API security matters big time since you're probably pulling from tons of different sources. Oh, and definitely do regular security assessments - logistics data is like catnip for competitors and hackers. Honestly, if you nail user permissions and encryption first, that's where you'll get the most protection for your effort.
Honestly, it's like having everyone look at the same screen instead of playing that annoying game of telephone with old info. Your suppliers, carriers, and internal teams all see live shipment updates and delivery metrics at once. No more "let me check and get back to you" nonsense – seriously, those delays kill momentum. When everyone's looking at the same data, trust builds naturally. You can catch problems together before they blow up. Just set different access levels so people only see what matters to them. Oh, and suddenly collaboration isn't just corporate speak anymore, it actually works.
-
Stunning collection! With a wide variety of options available, I was able to find a perfect slide for my presentation. Thank you, SlideTeam!
-
You know what? I'm so glad I opted for this PPT design. It has been a total game-changer for me and my presentations. Thank you!