


Merchant Dashboard With Monthly Onboarding And Business Mode




Try Before you Buy Download Free Sample Product
 Impress Your
 Audience
 100%
100% Editable
 Save Hours
 of Time


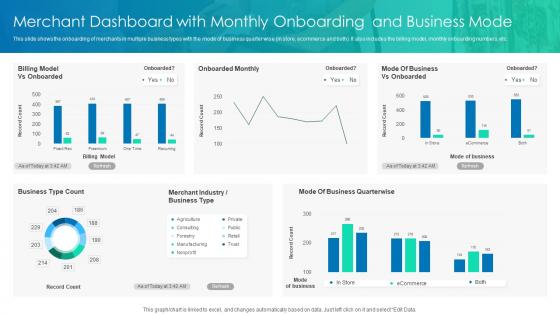
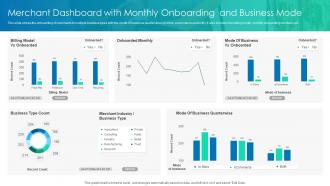
This slide shows the onboarding of merchants in multiple business types with the mode of business quarter wise in store, ecommerce and both. It also includes the billing model, monthly onboarding numbers, etc.
People who downloaded this PowerPoint presentation also viewed the following :
Merchant Dashboard With Monthly Onboarding And Business Mode with all 7 slides:
Use our Merchant Dashboard With Monthly Onboarding And Business Mode to effectively help you save your valuable time. They are readymade to fit into any presentation structure.





FAQs for Merchant Dashboard With Monthly Onboarding
Start with the obvious stuff - total sales, average order value, conversion rates. Those are gonna tell you the most. Then look at your traffic numbers like unique visitors and bounce rates to see where people are dropping off. Inventory turnover is huge too because you don't want products just sitting there collecting dust (learned that one the hard way). Customer lifetime value and repeat buyers show if you're actually building something people want. Oh, and keep an eye on processing fees and refunds - they add up fast. Honestly, these basics will cover like 90% of what you need to know starting out.
Dude, real-time updates are literally everything for merchant dashboards. You can catch stuff as it happens instead of finding out about problems the next day. Like, you'll see payment failures right away, spot inventory getting low before you're completely out, notice which products are hot while people are still shopping for them. Once you start using it, going back feels impossible - kind of like trying to run a store with your eyes closed? I'd definitely set up alerts for your biggest concerns so you're not obsessively checking every five minutes (trust me on that one).
Having payment insights right in your merchant dashboard is honestly such a lifesaver. No more hopping between different platforms just to see what's happening with your transactions. You'll catch conversion drops or payment failures right away instead of finding out weeks later (learned that the hard way). All your important stuff like transaction averages, busy hours, and where customers are buying from shows up in one spot. The best part? You can actually make quick decisions instead of waiting around for those useless monthly reports. Oh, and definitely set up alerts for weird patterns - saves so much headache.
Honestly, UX is make-or-break for merchant dashboards. Merchants will literally abandon your platform if they can't find basic stuff like payment processing or inventory within seconds. I've watched solid products tank because users got lost trying to do simple tasks. Put your most-used features upfront - sales data, order management, that kind of thing. Keep it under two clicks to reach core functions. Also, this might sound obvious but clear visual hierarchy actually matters way more than you'd think. Confusing navigation kills even the best backend functionality every single time.
Dude, data visualization seriously saved my sanity with merchant analytics. Those endless spreadsheets? Total nightmare. But throw that data into some decent charts and suddenly you can actually see what's happening. Spot trends, catch seasonal stuff, find where you're bleeding money - all way faster than scrolling through rows of numbers. I was skeptical at first but now I'm obsessed with our dashboards lol. You'll quickly see your best products, peak hours, conversion issues before they tank your revenue. Focus on whatever directly hits your bottom line first, then branch out from there.
Look for the gear icon up in the corner - that's your settings panel. Most people move their important KPIs to the top first, which makes sense. The drag-and-drop thing is actually pretty smooth, kinda like rearranging your phone apps. You can hide stuff you don't care about and add whatever data panels you need. Oh, and definitely set up alerts for low inventory or weird transaction stuff - saved me a few headaches. I'd just tackle one section at a time though, otherwise it gets messy fast.
Start with multi-factor authentication - seriously, it blocks like 99% of basic attacks. Role-based access is huge too so people only see what they need for their specific job. Obviously you need SSL encryption, and tokenize payment data instead of storing actual card numbers (learned that one the hard way). Session timeouts are super important - you don't want some random person hopping on an abandoned laptop at Starbucks. Audit logging helps you track who accessed what and when. Honestly though, if you only do one thing, make it MFA first.
So your merchant dashboard could actually get pretty smart with AI and ML built in. Right now you're probably just seeing what happened last month, but this stuff can spot patterns and predict what's coming next. Weather affecting your sales? Products that sell together? It'll catch things you'd never notice. Think of it as having someone super analytical watching your data 24/7 - honestly beats staring at spreadsheets all day. The algorithms flag weird customer behavior before it becomes a headache. I'd start with dashboards that do anomaly detection and forecasting first, then build from there.
Ugh, data inconsistencies are the absolute worst part. Your inventory numbers won't match between platforms, orders show up in one place but vanish from another - it's maddening when you're trying to pull reports. Timing delays mess everything up too. API limits slow you down constantly, and some platforms are just stubborn about syncing properly. I'd set up automated syncing during slow hours if I were you. Also keep backup manual processes handy because something always breaks at the worst possible time. Trust me on that one.
Honestly, you need a mobile-friendly dashboard - trust me on this one. Picture yourself at a trade show trying to check sales on a desktop-only interface... nightmare. Quick inventory updates, customer responses, checking key metrics - all should work smoothly on your phone. Without proper mobile design, you'll be pinching and zooming like it's 2008. Look for bigger buttons, clean navigation, and dashboards that actually show important stuff first. I learned this the hard way when I was stuck squinting at tiny text in a parking lot once. Don't settle for vendors who treat mobile as an afterthought.
Your reviews mess with way more stuff than you'd think. Average ratings obviously, but also conversion rates since people totally stalk reviews before buying. I've noticed when ratings tank, repeat customers drop off too - kind of a domino effect. The whole sentiment thing feeds into your customer experience scores on the dashboard. Reviews are like an early warning system for other problems. Watch those trends next to your sales numbers. If ratings start sliding, dive into what people are actually saying before it tanks your revenue. Better to catch it early than scramble later.
Your merchant dashboard data is honestly a game-changer - it shows you what's actually moving the needle vs what you assume is working. You'll spot seasonal trends and figure out which products are your moneymakers. Plus you can catch stuff tanking before it becomes a real headache. I probably check mine way too often, but whatever. The trick is actually doing something with what you learn instead of just staring at pretty graphs. Double down on what's crushing it. Drop what isn't. Sounds obvious but most people just... don't.
Your dashboard shows stock levels in real-time, plus it tracks which stuff is flying off shelves vs just sitting there. Pretty handy for avoiding those panic moments when you suddenly run out of bestsellers. Set up alerts when inventory gets low - trust me on this one. Check your reports weekly to catch patterns early. The fancy ones even predict reorder timing based on your sales history, though honestly I'm still figuring out half those features. Seasonal trends are super useful too since they show when demand spikes are coming.
Honestly, the worst thing people do is get obsessed with vanity metrics - like freaking out over page views while their conversion rate is in the toilet. Most merchants don't even set up proper date comparisons, so they're just staring at random snapshots instead of actual trends. And don't get me started on filters - I've seen people panic about "terrible sales" when they're literally only looking at one tiny product category. Another big one? Not connecting the dots between metrics. Sure, traffic's up, but if your average order value tanked, you've got problems. Set up regular check-ins and always ask yourself "okay, so what does this actually mean?"
Dude, connecting third-party apps to your merchant dashboard is seriously worth it. You can link your accounting software, inventory stuff, email tools - basically everything flows into one spot instead of constantly switching between like 15 different tabs (which honestly drives me nuts). The best part? No more manual data entry since it all syncs up automatically. I'd start with whatever apps you use most - maybe your accounting software first? Once you get a few connected, you'll actually see patterns in your business you probably missed before. Saves me hours every week, no joke.
-
Great product with effective design. Helped a lot in our corporate presentations. Easy to edit and stunning visuals.
-
SlideTeam is the way to go when you are in a time crunch. Their templates have saved me many times in the past three months.