


Merger and takeovers powerpoint presentation slides


Try Before you Buy Download Free Sample Product
 Impress Your
 Audience
Editable
of Time


Introducing our merger and takeovers PowerPoint presentation slides. Implement the mergers and takeovers of your company with the help of our commerce acquiring PPT layout. Introduce your team to the new and upcoming growth market with the help of our association assistance PowerPoint design. Assimilate this well built company amalgamation PPT theme into your presentation if you want to graphically present the balance sheets of the cash flow of the company. Associate with this alliance negotiation PowerPoint set to present the post-merger integration in an organized manner. Deploy this merger association PPT bundle to track the performance before and after the merger. This affiliation pitchbook PPT deck lets you make required variations to the icons and colors, making this PPT more practical. Choose this company takeover PowerPoint design to showcase accuracy and precision of the analysis of the data. Download this PPT slide to explore true perfection.
People who downloaded this PowerPoint presentation also viewed the following :
Content of this Powerpoint Presentation
Slide 1: This slide introduces Merger & Takeovers. State Your Company Name and begin.
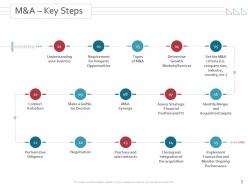
Slide 2: This slide shows M&A – Key Steps Requirement for Inorganic Opportunities.
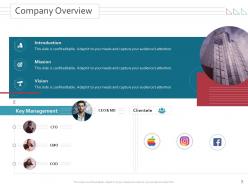
Slide 3: This slide presents Introduction describing Key Management, Company Overview, etc.
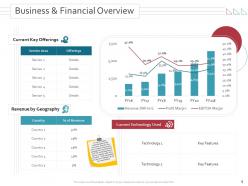
Slide 4: This slide displays Business & Financial Overview to have a better understanding of the business.
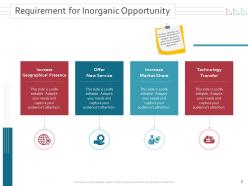
Slide 5: This slide shows Requirement for Inorganic Opportunity.
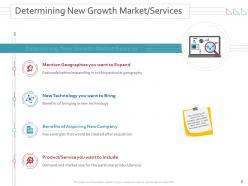
Slide 6: This slide represents Determining New Growth Market/Services.
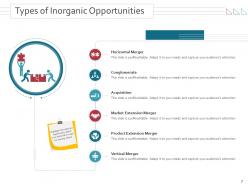
Slide 7: This slide shows Types of Inorganic Opportunities i.e. Market Extension Merger, Horizontal Merger, Conglomerate, etc.
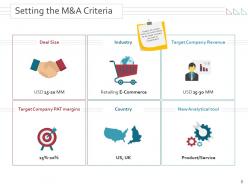
Slide 8: This slide presents Setting the M&A Criteria for the target company you want to merge/acquire.
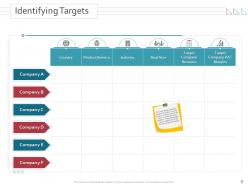
Slide 9: This slide displays Identifying Targets country, product, Industry, size of the deal, etc.
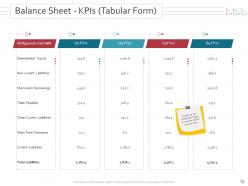
Slide 10: This slide shows Balance Sheet - KPIs Tabular Form.
Slide 11: This slide represents Balance Sheet - KPIs Tabular Form.
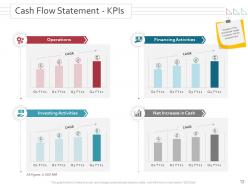
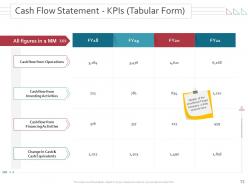
Slide 12: This slide shows Cash Flow Statement - KPIs.
Slide 13: This slide presents Cash Flow Statement - KPIs describing- Cash flow from Operations, Cash flow from Investing Activities, Cash flow from Financing Activities, etc.
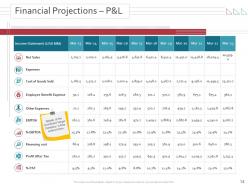
Slide 14: This slide displays Financial Projections – P&L with details of the shortlisted Target Company.
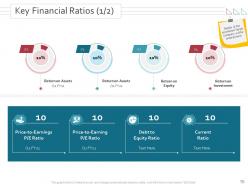
Slide 15: This slide shows Key Financial Ratios describing- Price-to-Earnings P/E Ratio, Debt to Equity Ratio, etc.
Slide 16: This slide represents Key Financial Ratios describing- Liquidity Ratio, Profitability Ratio, Activity Ratio, etc.
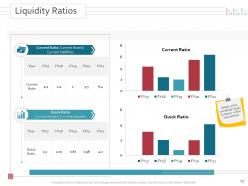
Slide 17: This slide shows Liquidity Ratios describing- Current Ratio, Quick Ratio, etc.
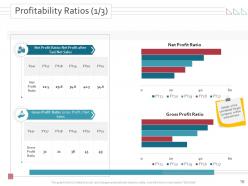
Slide 18: This slide presents Profitability Ratios describing- Net Profit after Tax, Net Profit Ratio, Gross Profit Ratio, etc.
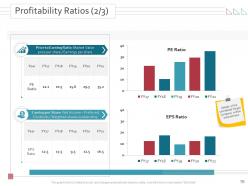
Slide 19: This is another slide showing Profitability Ratios describing- PE Ratio, EPS Ratio, etc.
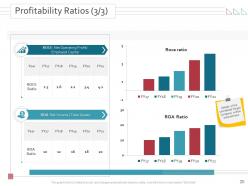
Slide 20: This is another slide showing Profitability Ratios describing- Employed Capital, Roce ratio, ROA Ratio, etc.
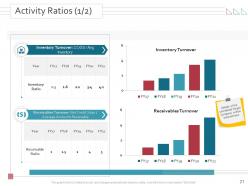
Slide 21: This slide displays Activity Ratios describing- Inventory Turnover, Receivables Turnover, etc.
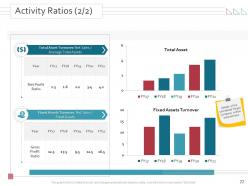
Slide 22: This slide shows Activity Ratios describing- Fixed Assets, Total Asset, Fixed Assets Turnover, etc.
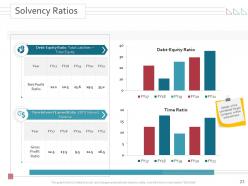
Slide 23: This slide presents Solvency Ratios describing- Debt-Equity Ratio, Time Ratio, etc.
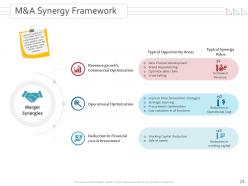
Slide 24: This slide shows M&A Synergy Framework describing- New Product Development, Brand Repositioning, Optimize sales chain, etc.
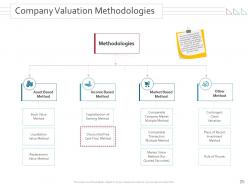
Slide 25: This slide displays Company Valuation Methodologies.
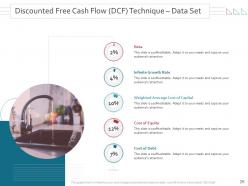
Slide 26: This slide shows Discounted Free Cash Flow (DCF) Technique – Data Set.
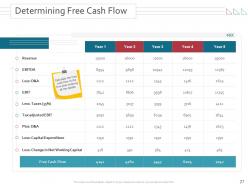
Slide 27: This slide presents Determining Free Cash Flow.
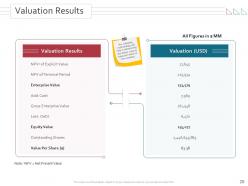
Slide 28: This slide shows Valuation Results with additional textboxes.
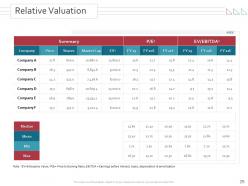
Slide 29: This slide displays Relative Valuation with related imagery.
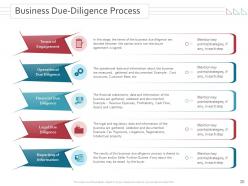
Slide 30: This slide shows Business Due-Diligence Process describing- Operational Due Diligence, Financial Due Diligence, Legal Due Diligence, etc.
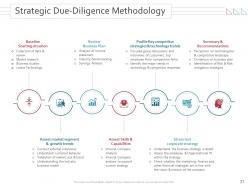
Slide 31: This slide represents Strategic Due-Diligence Methodology.
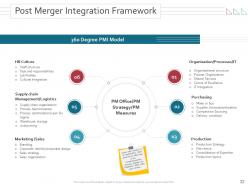
Slide 32: This slide shows Post Merger Integration Framework.
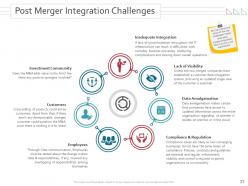
Slide 33: This slide presents Post Merger Integration Challenges.
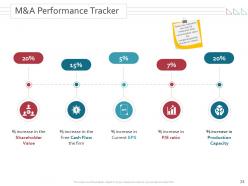
Slide 34: This slide shows M&A Performance Tracker with related icons and text.
Slide 35: This slide displays Merger & Takeovers Icons.
Slide 36: This slide reminds about a Coffee Break.
Slide 37: This slide is titled as Charts & Graphs for moving forward.
Slide 38: This slide presents Stacked Line With Markers.
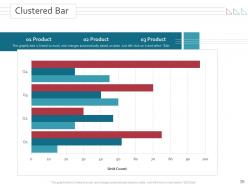
Slide 39: This slide displays Clustered Bar chart with three products comparison.
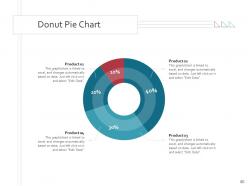
Slide 40: This slide represents Donut Pie Chart with data in percentage.
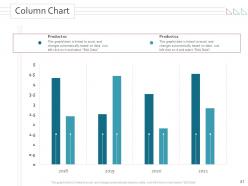
Slide 41: This slide shows Column Chart with two products comparison.
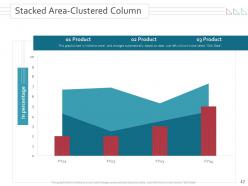
Slide 42: This slide presents Stacked Area-Clustered Column.
Slide 43: This slide is titled as Additional Slides for moving forward.
Slide 44: This is About Us slide to show company specifications etc.
Slide 45: This is Our Mission slide with related imagery and text.
Slide 46: This is Our Team slide with names and designation.
Slide 47: This is Our Goal slide. State your firm's goals here.
Slide 48: This is a Quotes slide to convey message, beliefs etc.
Slide 49: This is a Comparison slide to state comparison between commodities, entities etc.
Slide 50: This slide shows Dashboard with additional text boxes to show information.
Slide 51: This is a Financial slide. Show your finance related stuff here.
Slide 52: This slide shows Puzzle with related icons and text.
Slide 53: This is Our Target slide. State your targets here.
Slide 54: This is a Location slide with maps to show data related with different locations.
Slide 55: This slide shows Circular with additional textboxes.
Slide 56: This slide presents Venn diagram with text boxes.
Slide 57: This slide displays Silhouettes with related icons and text.
Slide 58: This slide represents Mind Map with additional textboxes.
Slide 59: This slide shows Magnifying Glass to highlight information, specifications etc
Slide 60: This is an Idea Generation slide to state a new idea or highlight information, specifications etc.
Slide 61: This is a Thank You slide with address, contact numbers and email address.
Merger and takeovers powerpoint presentation slides with all 61 slides:
Use our Merger And Takeovers Powerpoint Presentation Slides to effectively help you save your valuable time. They are readymade to fit into any presentation structure.


FAQs for Merger and takeovers
Honestly, it's mostly about grabbing market share and cutting costs through synergies. Companies buy others for tech they can't build fast enough themselves - way easier than starting from scratch. Economies of scale matter too when you're competing against giants. Plus cheap money makes deals look pretty attractive right now. Acqui-hires are super common - literally just buying talent. Traditional companies are going crazy acquiring tech startups because they're terrified of being left behind in digital transformation (and rightfully so). When you're looking at deals though, ignore the flashy press releases. Focus on whether the strategy actually works long-term.
Start with surveys and focus groups to get the real story on company values - not the motivational poster stuff. Talk to people at every level because managers will sugarcoat things that frontline employees won't. Communication styles matter way more than you'd think, plus how they make decisions and deal with conflict. Meeting culture is honestly a huge tell - some places love their 2-hour brainstorms while others keep it quick. Don't skip the cross-company workshops before you finalize anything. That's where you'll actually see if the teams mesh or if there's gonna be drama later.
Look, due diligence is your lifeline here - it can totally make or break everything. You're playing detective, hunting down red flags and making sure their financials aren't complete BS. Like house hunting but with way more paperwork and stress headaches. Skip this part and you'll hate yourself later when surprise debts pop up everywhere. Honestly, I've seen too many deals go sideways because people rushed through it. Budget extra time and money for this phase. Trust me, finding problems now beats discovering them after you've already signed your life away.
Get multiple valuations first - DCF, comparable companies, precedent transactions. Different methods will show you where the gap's coming from. Usually it's because someone's being way too optimistic about synergies (honestly happens constantly) or you've got totally different growth assumptions. Document everything so you can work through each difference instead of just meeting in the middle, which never really works. A third-party expert isn't a bad idea if you're completely stuck. The main thing is figuring out *why* there's a disconnect before trying to fix it.
Antitrust clearance is your biggest headache - Hart-Scott-Rodino filings can drag on forever if you're over the thresholds. Securities compliance gets tricky too, especially with public companies and all their disclosure rules. Don't forget sector-specific stuff like banking or telecom regulators who love to slow things down. International deals? Yeah, good luck juggling multiple jurisdictions on top of everything else. Honestly, loop in your regulatory lawyers during due diligence, not after you've agreed on price. Waiting periods kill deal momentum faster than anything.
Ugh, yeah M&A stuff is rough on teams at first. Everyone freaks out about getting laid off or having to deal with some weird new company culture. Your top people will probably bail before they even see how things shake out - which honestly makes sense from their perspective. The whole thing just creates this cloud of anxiety that kills productivity. But if you actually talk to people instead of keeping them in the dark, it helps a ton. Like, give them real timelines and be upfront about what roles might change. Don't just hope the gossip mill sorts itself out. Have those awkward conversations early and often.
Honestly, the key is nailing three things: getting your systems to play nice together, aligning company cultures (harder than it sounds), and standardizing how stuff gets done. Map out what each company does well first, then build workflows that grab the best from both sides. Communication is HUGE - people are gonna be freaked out about changes. Set up teams with folks from both companies to handle the integration. Don't try cramming everything into month one though, that's a recipe for chaos. Tackle the must-have systems first, then work through the rest. My take? Grab some easy wins early so everyone sees it's actually working.
Honestly, tech is a game-changer for M&A deals. Virtual data rooms make sharing sensitive stuff way more secure than email chains. AI tools can rip through contracts and spot red flags faster than your legal team - saves tons of time. Integration platforms are clutch for tracking synergies and keeping everyone on the same page during those crazy first 100 days. I've seen deals fall apart because teams couldn't stay aligned (what a mess). Collaboration tools help too, especially with cross-functional teams. Figure out where your process breaks down most, then find specific tech that fixes those exact problems.
Honestly, most deals fail because companies get starry-eyed about "synergies" that never actually happen. Cultural clashes are brutal too - like when a laid-back startup gets bought by some buttoned-up corporation. Due diligence gets rushed all the time, which is insane when you think about it. Teams don't talk to each other, leadership egos clash, and suddenly you've overpaid for a mess. Oh, and integration planning? Most companies wing it, which is why everything falls apart after closing. My advice? Be super honest about whether the cultures will actually mesh and map out integration before you sign anything.
Markets control everything in M&A - it's wild how much timing matters. Hot markets = companies throwing money at strategic deals for those sweet synergies. Downturns? Total opposite. You get fire sales and vulture buyers picking off distressed assets. Cheap interest rates make LBOs super appealing too. Bull runs let you use stock as currency, but bear markets force everyone into cash deals. I swear the whole industry just rides these cycles. Honestly, if you're planning anything, watch those market patterns first. Bad timing will absolutely destroy your valuation.
Look, communication can make or break your whole M&A deal. People start gossiping the second they sense something's up, so get ahead of it with honest updates instead of radio silence. Keep everyone in the loop during the actual transaction - reduces that "am I getting fired?" panic. After closing, you'll need constant communication for the cultural stuff and new processes. Oh, and don't sound like a corporate robot when you do it. Authenticity beats perfect PR speak every time. Draft your communication plan now before things get crazy busy.
So M&A gives you three ways to grow fast: grab new customers/markets, buy tech you need, or knock out competitors. Geographic expansion happens way quicker than building organically - you get their relationships and infrastructure right away. It's basically buying a shortcut instead of starting from zero. Though honestly, integration always gets messier than anyone expects. Before you sign anything, figure out if you're buying for scale, capabilities, or market access. Most deals live or die on how well you actually merge everything together afterward. That integration planning matters more than people think.
Yeah so globalization basically blew the doors open for M&A deals. Companies aren't just looking in their backyard anymore - they're hunting targets everywhere. Opens up tons of new markets and talent you couldn't reach before. But here's the thing - deals got way messier too. Different regulations in every country, currency headaches, cultural stuff that can totally derail integration if you're not careful. Cross-border M&A has exploded over the last 20 years. Due diligence becomes this whole other beast though. You can't just analyze the company anymore, you gotta understand their entire economic and regulatory landscape too.
Tech M&A is totally different from regular deals. These companies will throw insane money at startups just for their engineering teams and user growth - forget about actual profits. Cultural fit becomes huge because nobody wants their new developers jumping ship after six months. Traditional industries? They're buying factories and cutting costs. But tech acquirers obsess over keeping that startup vibe alive (which honestly makes integration a nightmare). If you're working these deals, focus on retention bonuses for the technical people. Those are the folks who actually built what you're buying.
So you'll want to track the obvious stuff first - revenue bumps, cost cuts, EBITDA gains. But honestly, don't sleep on customer retention and employee turnover because those can torpedo everything fast. Market share growth matters too, obviously. Here's something most people miss though - do culture surveys with your teams. Miserable employees will sink a deal quicker than you think. Oh, and track how well you're sticking to your integration timeline. Build a dashboard for all this and check it monthly for like two years. Gives you time to fix things before they get ugly.
-
Nice and innovative design.
-
Best way of representation of the topic.
-
Understandable and informative presentation.
-
Great product with effective design. Helped a lot in our corporate presentations. Easy to edit and stunning visuals.
-
Enough space for editing and adding your own content.
-
Unique and attractive product design.
-
Colors used are bright and distinctive.
-
Great product with highly impressive and engaging designs.
-
Designs have enough space to add content.