


Merger And Acquisition Powerpoint Presentation Slides
Mergers and acquisitions are a very complex process, our Merger And Acquisition PowerPoint Presentation Slides can help you to explain this complex process in a simpler way. The merger is a consolidation of two companies into one, whereas acquisition takes place when one company takes over another company. Business valuation PowerPoint compete deck helps you portray the entire process as it contains a set of slides such as key steps, company overview, business, and financial overview, determining new growth market, types of inorganic opportunities, M&A criteria, identify targets, balance sheet KPIs, cash flow statement, financial projections, key financial ratios, liquidity and profitability ratios, activity and solvency ratios, M&A synergy framework, company valuation methodologies, valuation results, business due diligence process, post-merger integration framework, challenges and performance tracker etc. This strategic alliance Presentation template is useful for business as well as educational purposes. Download M&A valuation PPT slide to give a presentation in top-level organizational meetings. Spray your thoughts with our Merger And Acquisition Powerpoint Presentation Slides. Your audience will swoon with their heady aroma.
Mergers and acquisitions are a very complex process, our Merger And Acquisition PowerPoint Presentation Slides can help you..


-

- Google Slides is a new FREE Presentation software from Google.
- All our content is 100% compatible with Google Slides.
- Just download our designs, and upload them to Google Slides and they will work automatically.
- Amaze your audience with SlideTeam and Google Slides.
-

Want Changes to This PPT Slide? Check out our Presentation Design Services
-

- WideScreen Aspect ratio is becoming a very popular format. When you download this product, the downloaded ZIP will contain this product in both standard and widescreen format.
-

- Some older products that we have may only be in standard format, but they can easily be converted to widescreen.
- To do this, please open the SlideTeam product in Powerpoint, and go to
- Design ( On the top bar) -> Page Setup -> and select "On-screen Show (16:9)” in the drop down for "Slides Sized for".
- The slide or theme will change to widescreen, and all graphics will adjust automatically. You can similarly convert our content to any other desired screen aspect ratio.
Compatible With Google Slides

Get This In WideScreen
You must be logged in to download this presentation.


Do you want to remove this product from your favourites?
PowerPoint presentation slides
Introducing Mergers And Acquisitions Framework PowerPoint Presentation Slides. This presentation includes 64 professionally designed PPT templates. These PPT Slides are 100 % editable. Users can change the fonts, colors, and slide background as per their need. On downloading the presentation, you get the templates in both widescreen and standard screen. The presentation is compatible with Google Slides and can be saved in JPG or PDF format.

People who downloaded this PowerPoint presentation also viewed the following :
Content of this Powerpoint Presentation
We see business owners struggling to expand and constantly searching for new revenue streams, which can affect their bottom-line profitability. Mergers and acquisitions are one such strategic move which provides an attractive opportunity for companies to combine resources, consolidate risks, and enhance their competitive advantage.
Check our blog for Company Evaluation Templates to assess your company's value and create summaries.
During this agreement and while preparing your operations for a transition, you will encounter many formalities that might distract you from understanding the combined entity's synergy.
Slideteam's merger and acquisition templates can help you make this complex seem simpler. This PPT deck includes 10 slides that are customizable according to your process, team size, and the resources you are planning to acquire.
Let's talk about each slide one by one and take a shift toward diversification!
Template 1: M&A - Key Steps
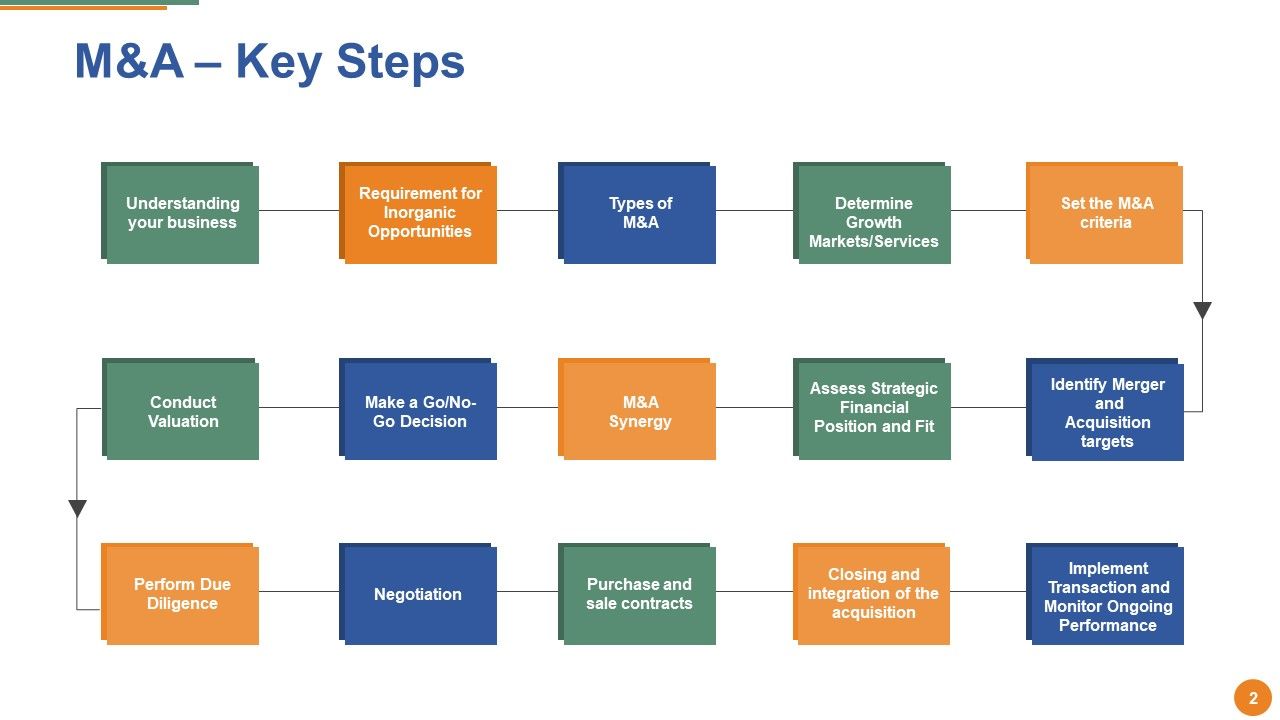
This PPT Slide allows you to understand the market landscape to make your strategy successful. You need to understand your business and target consumers, assess strategic fit, negotiate contract terms, get regulatory approvals, and close the deal with smooth integration. This slide effortlessly portrays these steps so that you can make your point with confidence.
Template 2: Setting the M&A Criteria
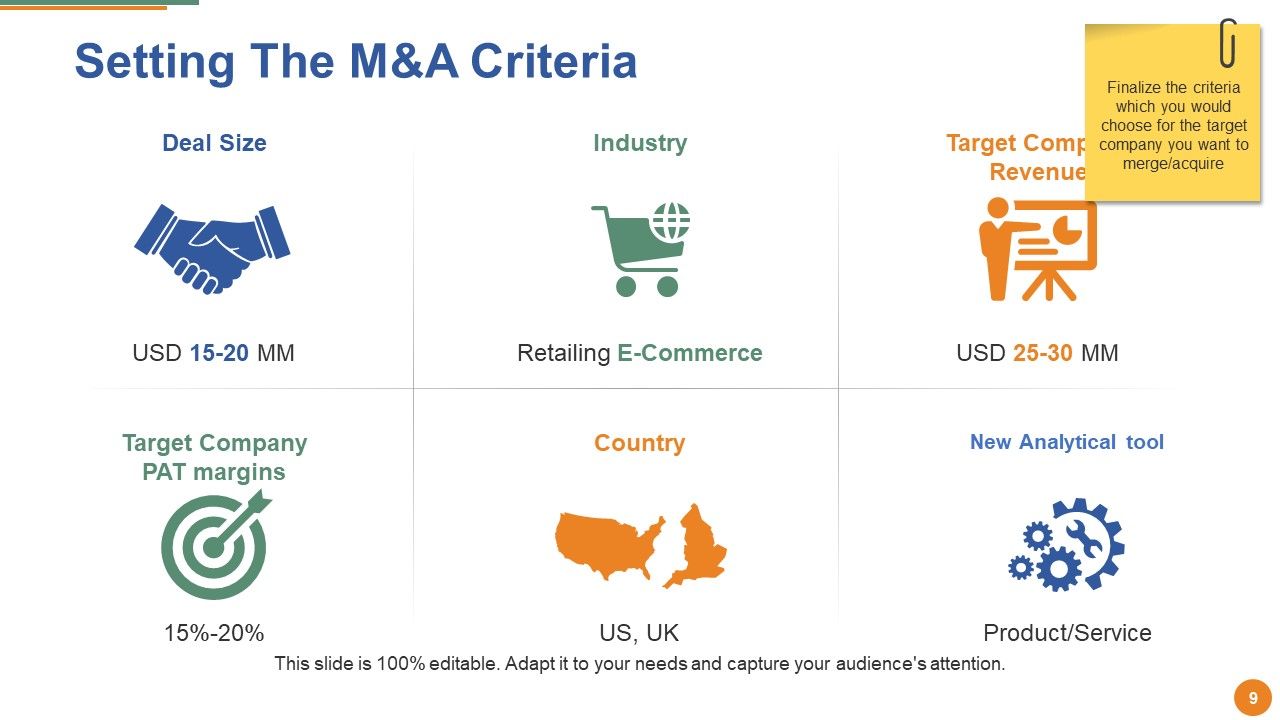
Use this PPT Template to elaborate on your criteria for the partnership with high-quality visuals that state your professionalism. Your purpose is to build brand recognition with great market traction; this template will do justice to your vision. Also, you can showcase the specific assets you are acquiring along with tender offers and consolidation to abandon old structures.
Template 3: Financial Projections - P&L
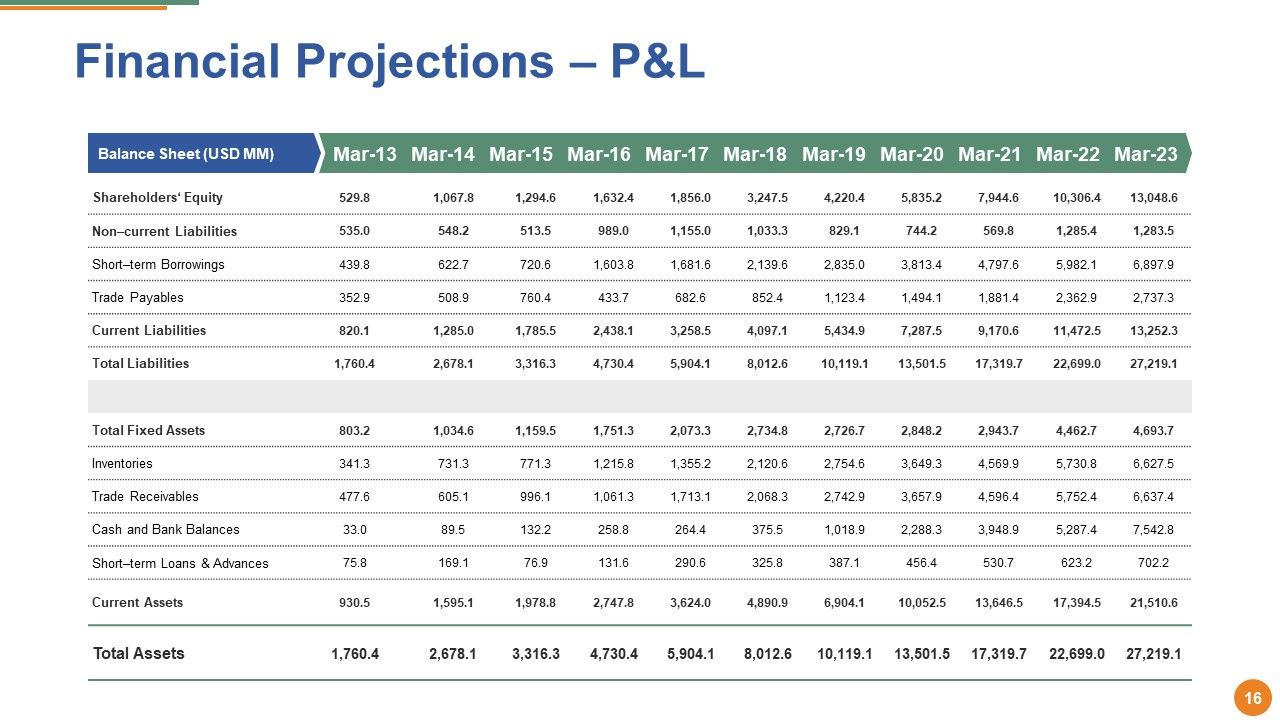
Showcasing how financially viable you are for undertaking a new project leaves a great impression on the stakeholders. This slide lets you showcase your financial projections to the acquiring party to gain trust and establish a reputation. Breaking down the assets, liabilities, and capital shows that the business had liquid capital. It can also be used to identify the financial records of the acquired party and analyze the cost structure and different expenses.
Template 4: Key Financial Ratios (1/2)
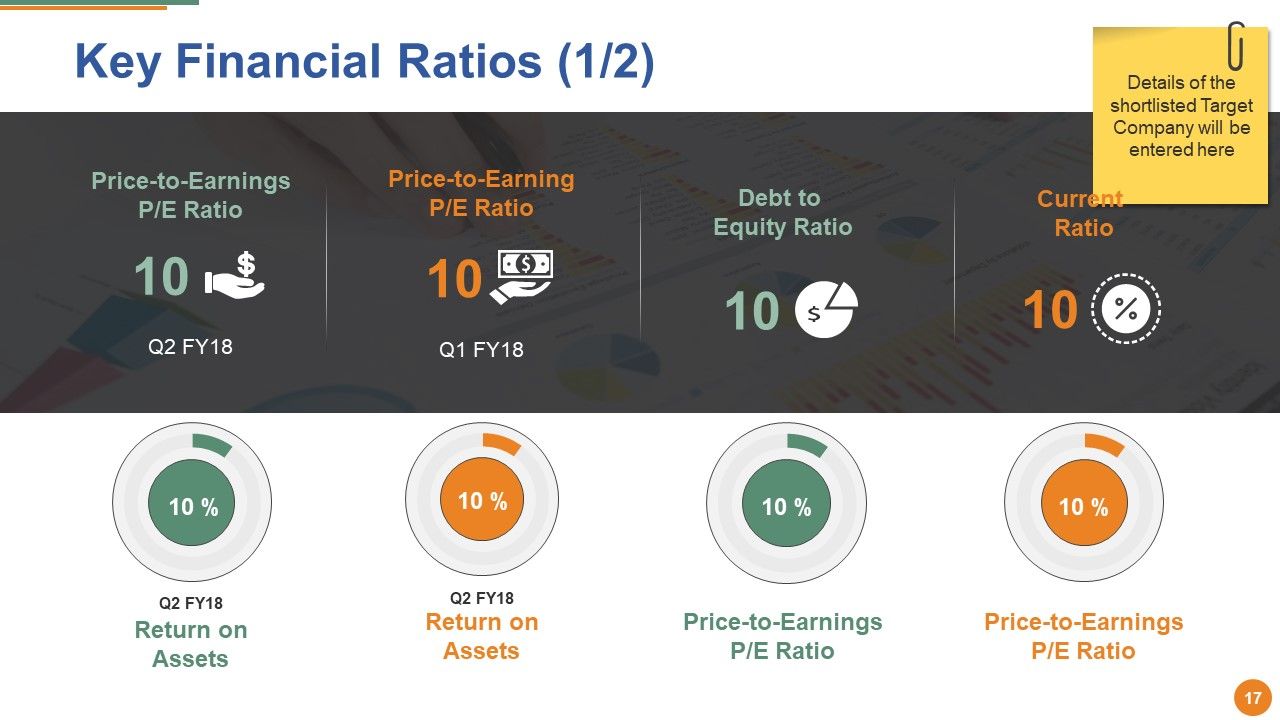
This is another slide that transparently showcases financial performance. The graphics and the percentage portrayal will quickly get the reader’s attention. Use it to compare the profitability metrics and alter your decision based on the figures you see. You can also perform sensory analysis to recognize the impact of changes in uncertain situations.
Template 5: Key Financial Ratios (2/2)
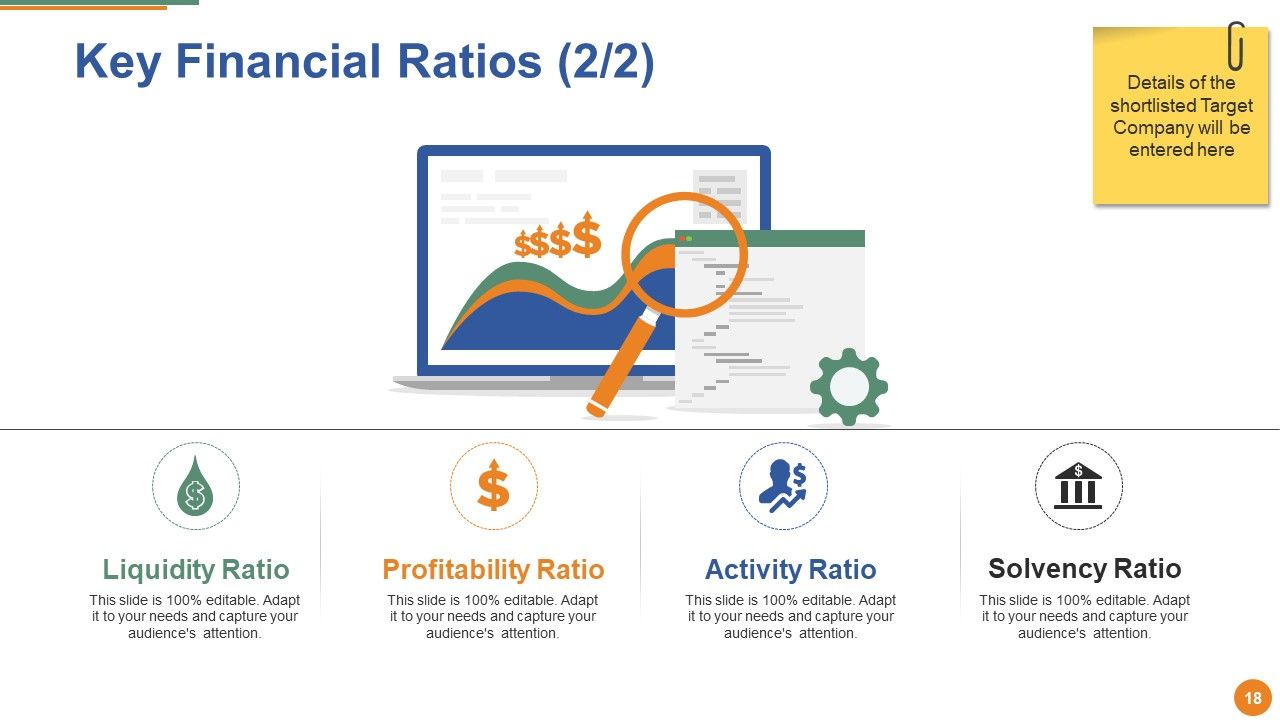
This PPT Template helps showcase liquidity, profitability, solvency, and activity ratios for projecting your entity’s financial performance. It is an analytical yet interesting way to explain your liquidity to gain the confidence of the acquiring partner. This slide can be the basis of risk management, as identifying these KPIs will help you analyze potential red flags so that you can take proactive action before the transaction takes place.
Template 6: M&A Synergy Framework
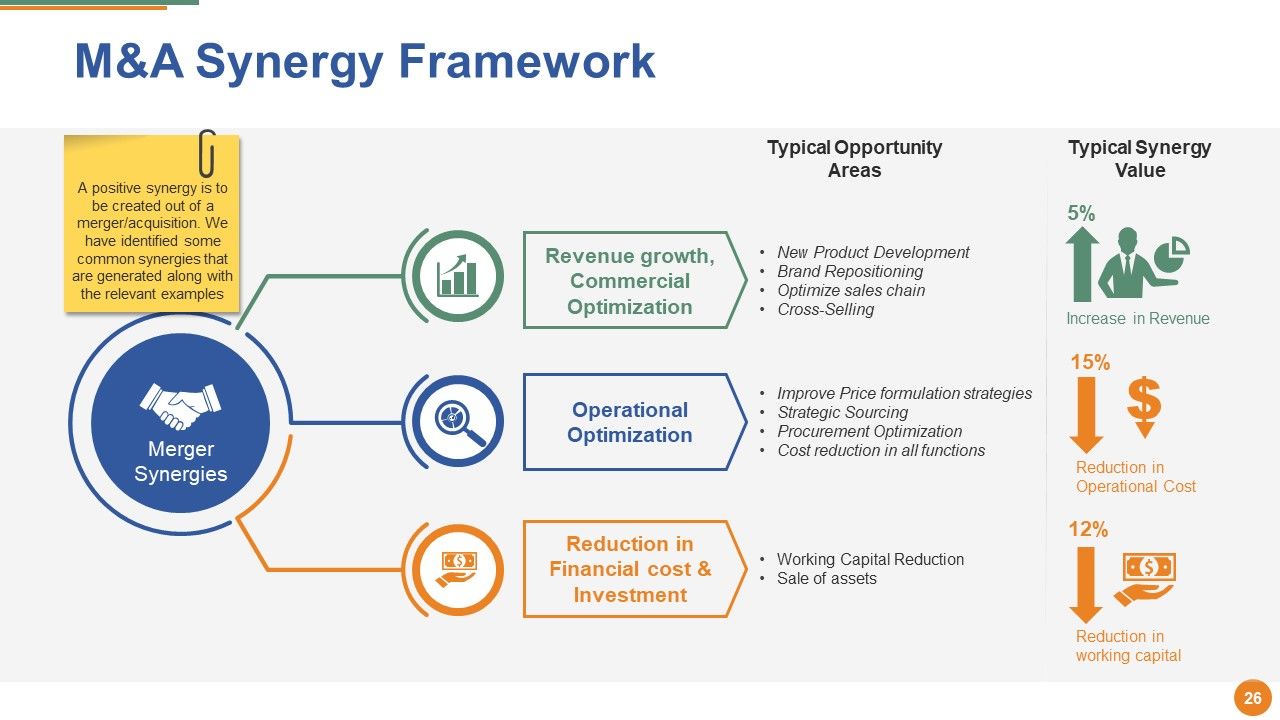
Use this interactive template to help your readers go through the opportunity areas and recognize the value of synergy in percentage. It is a valuable tool to consolidate operational costs, eliminate redundant functions, and combine the purchasing power of two different entities.
Template 7: Company Valuation Methodologies
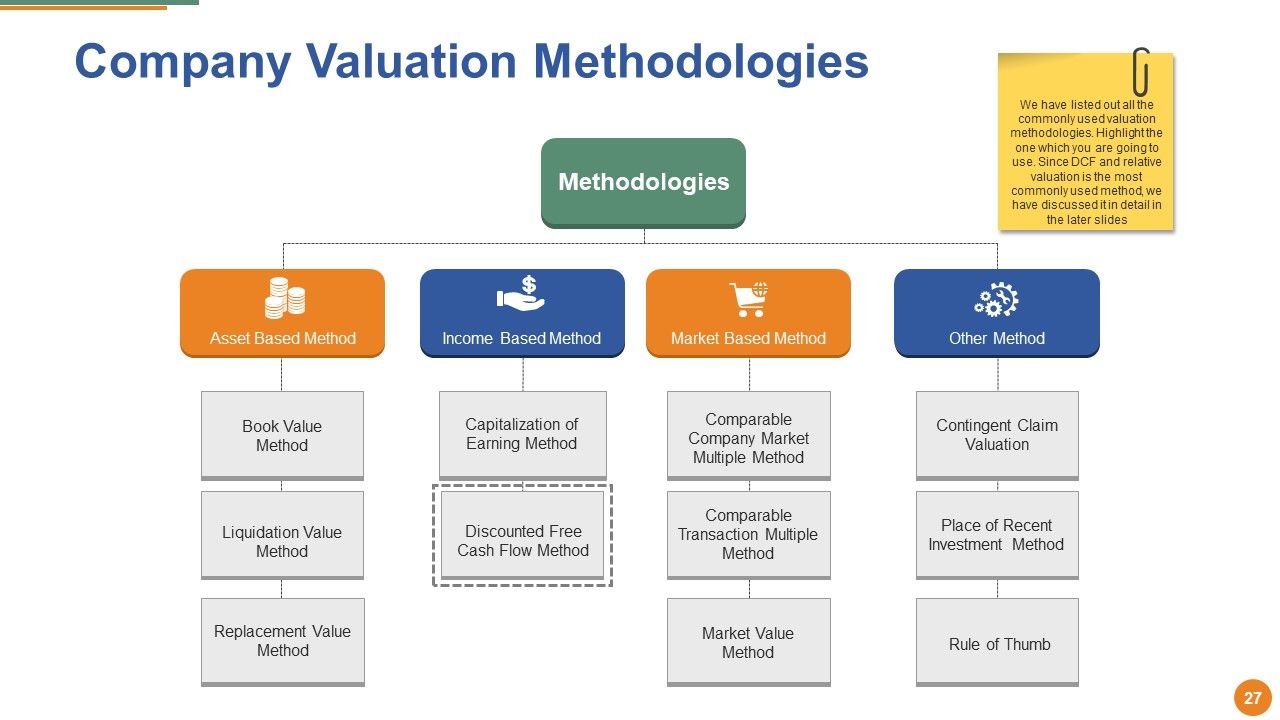
The M&A process is complex and requires due diligence. Use this slide to measure a company's valuation through asset-based methods, income-based methods, market-based methods, and other methods. This will help to create fair pricing by increasing your bargaining power and closing the deal, which brings revenue.
Template 8: Post Merger Integration Framework
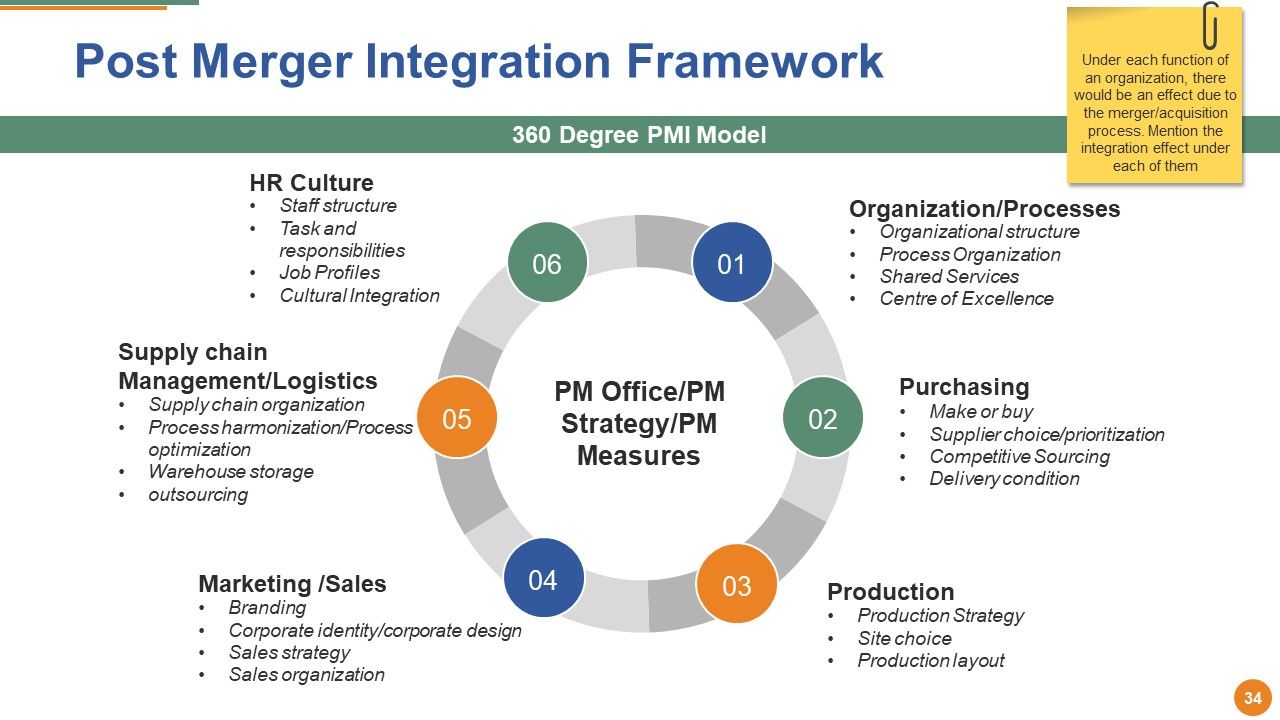
This post-merger integration framework will help to exercise strategic fit through culture, business operations/process, production, and marketing. Customized templates can make your detailed plan much more readable for the stakeholders. When you recognize any differences, you can work on them accordingly.
Template 9: Post Merger Integration Challenges
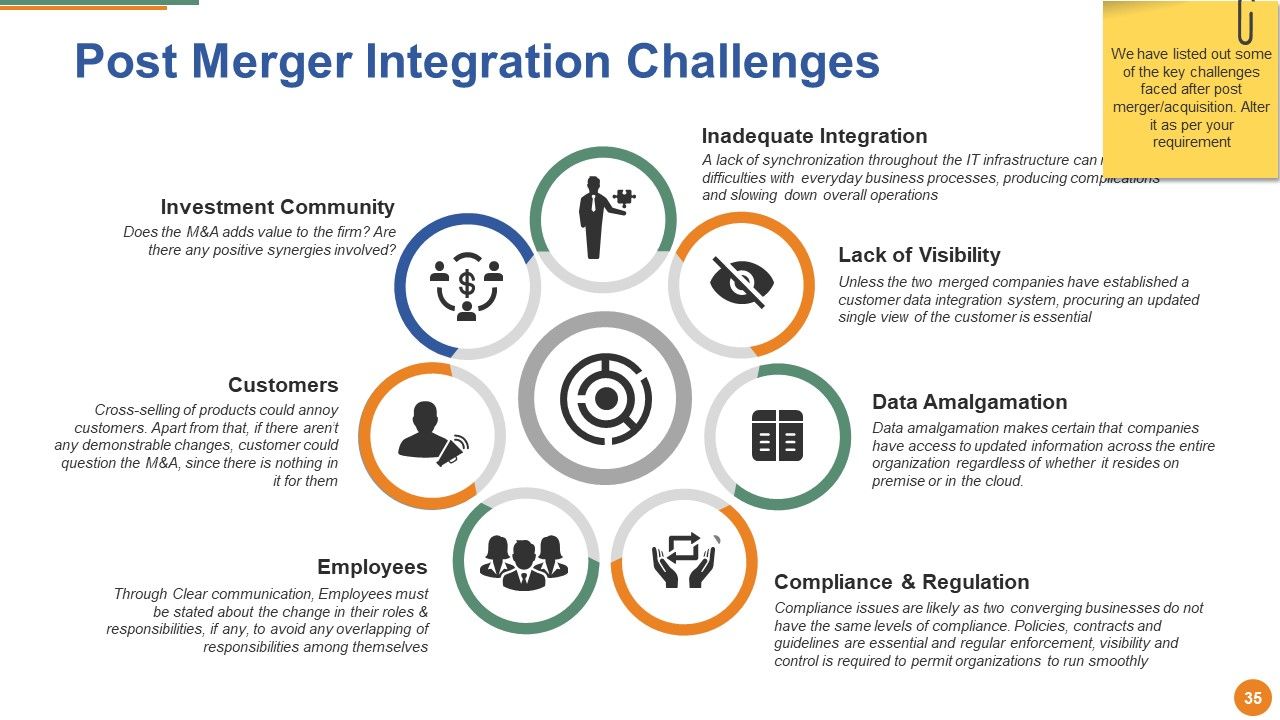
Post-merger integration can create challenges like communication, cultural risks, data amalgamation, and employee retention. Use this PPT Slide to streamline this process by tracking these challenges. The intuitive graphics and presentation of each challenge quickly inform the audience at a glance. These customizable slides allow you to keep your information and assess the risks.
Template 10: M&A Performance Tracker
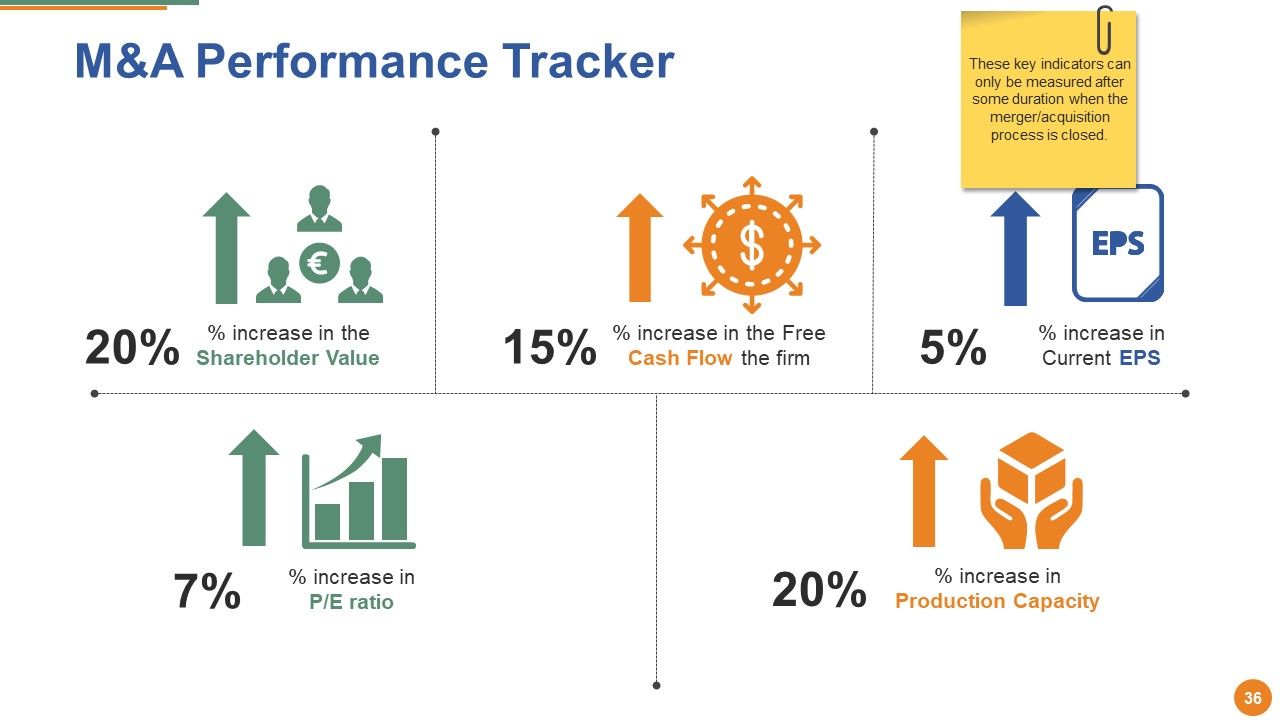
Identify the performance of your recent mergers with this PowerPoint Presentation. This template will help you determine the transaction's outcome by comparing several financial metrics. Showcase your outstanding numbers to evaluate integration efforts over time and deviations in this strategic move.
M&A: Dominate the Market with Innovation and Integration
Whether you want to expand or run a competitive business, mergers and acquisitions are considered the right strategy for sustained growth.
But the entire process is time-consuming, and we know you are occupied with much better things rather than developing presentations. SlideTeam's Merger and Acquisition Templates will do justice to your approach, as each slide poses an essential factor in this strategic approach. Elaborate on your acquisition steps and project financial numbers, and identify the key challenges post-integration. So why wait? Download this deck today and make this critical step seamless.
Merger And Acquisition Powerpoint Presentation Slides with all 64 slides:
All the depictions on our Merger And Acquisition Powerpoint Presentation Slides are absolutely correct. It conveys accurate impressions.
FAQs
A merger and acquisition include understanding your business, identifying the need for inorganic opportunities, determining growth markets/services, setting M&A criteria, identifying merger and acquisition targets, conducting valuation, performing due diligence, negotiation, purchase and sale contracts, closing and integration of the acquisition, implementing the transaction, and monitoring ongoing performance.
The different types of inorganic opportunities include market extension mergers, vertical mergers, product extension mergers, acquisitions, conglomerates, and horizontal mergers.
The liquidity ratios considered while assessing a target company include the current and quick ratios.
The M&A synergy framework is a model that identifies the various opportunities for synergy in a merger or acquisition. These opportunities may include revenue growth, commercial optimization, operational optimization, reduction in financial cost and investment, merger synergies, new product development, brand repositioning, optimized sales chain, cross-selling, improved price formulation strategies, strategic sourcing, procurement optimization, cost reduction in all functions.
The financial ratios used in evaluating a target company include the P/E ratio, debt-equity ratio, current ratio, return on assets, return on equity, return on investment, net profit ratio, gross profit ratio, inventory turnover, receivable turnover, total asset turnover, fixed assets turnover, debt-equity ratio, and time interest earned percentage.
-
Illustrative design with editable content. Exceptional value for money. Highly pleased with the product.
-
It saves your time and decrease your efforts in half.
-
wonderful
