


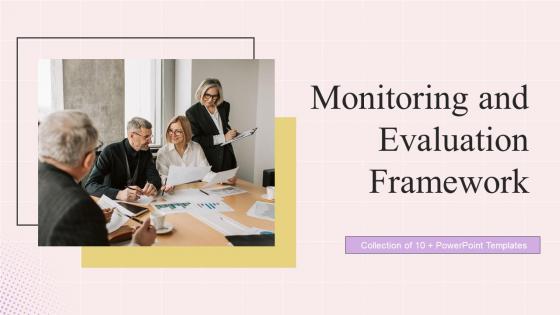
Monitoring And Evaluation Framework Powerpoint Ppt Template Bundles





Try Before you Buy Download Free Sample Product
 Impress Your
 Audience
 100%
100% Editable
 Save Hours
 of Time


Our Monitoring And Evaluation Framework Powerpoint Ppt Template Bundles are topically designed to provide an attractive backdrop to any subject. Use them to look like a presentation pro.
People who downloaded this PowerPoint presentation also viewed the following :
Monitoring And Evaluation Framework Powerpoint Ppt Template Bundles with all 19 slides:
Use our Monitoring And Evaluation Framework Powerpoint Ppt Template Bundles to effectively help you save your valuable time. They are readymade to fit into any presentation structure.










FAQs for Monitoring And Evaluation Framework Powerpoint
Honestly, start with your objectives and what success looks like. Get some solid indicators - both numbers and the softer stuff that's harder to measure. Set up how you'll collect data and when you'll check in on progress. Oh, and loop in your stakeholders early! Seriously saves you so much drama down the road. You need baseline data too, otherwise how do you know if anything's actually working? Keep it simple though - if it's too complicated, nobody will stick with it. Better to track a few things really well than try measuring every little detail. Your team will thank you for not overcomplicating it.
Okay so first thing - literally map out which metrics connect to your actual goals. I know it sounds basic but you'd be shocked how many people track random stuff that doesn't matter. Get your leadership team involved early so you're not measuring things they don't care about. Set up regular check-ins to tweak things when priorities change (and they will). Honestly, if your monitoring isn't helping you make better decisions, you're just creating fancy reports nobody reads. Focus on what actually moves the needle toward your objectives.
You absolutely need stakeholders on board from the start, or your M&E framework becomes expensive wallpaper. Get them in early workshops to define what success looks like and pick indicators that actually matter. They'll help you figure out realistic data collection too - plus they're way more likely to use the results if they helped build it. Honestly, I've watched so many gorgeous systems crash because nobody asked users what they needed. Oh, and keep checking in with them during development, not just at the beginning. Trust me on this one.
Don't put all your eggs in one basket - mix surveys with interviews and other methods. Test everything first though! I once had participants completely baffled by my survey questions, which was... embarrassing. Get your baseline data early and train everyone on the same collection process. Build in ways to catch problems as you go instead of finding out at the end that everything's messed up. Sample size is tricky - bigger isn't always better, but you need it to actually represent your population. Oh, and map out what data you actually need first. It's tempting to collect everything "just in case."
Start with what actually matters for your program's goals - output stuff (what you're delivering), outcomes (changes happening), and long-term impact. Honestly, most people get way too obsessed with metrics that look cool but tell you nothing useful. Stick to 5-7 indicators per area so you're not drowning in spreadsheets all day. I'd map backwards from your end goals to figure out what you actually need to track. Make sure they're specific and measurable, obviously. Oh, and don't forget process indicators - they'll show you if things are running smoothly or if you're about to hit a wall.
Honestly, tech can be a game-changer for M&E if you don't overcomplicate it. Mobile apps make field data collection way less painful, and dashboards help you actually see what's happening instead of drowning in spreadsheets. Real-time insights are pretty sweet too. Cloud platforms solve that annoying problem where everyone's working on different versions of the same file - you know how that goes. But here's the thing: pick tools that fit how you already work, not the other way around. I'd start with maybe one mobile app and a simple dashboard. See how that goes first, then add more stuff once you figure out what actually helps versus what just looks cool.
So basically, qualitative data tells you *why* stuff is happening - not just what the numbers show. Like if your survey says satisfaction dropped 20%, but then interviews reveal people actually like the new policy change long-term? That's huge context you'd miss otherwise. Focus groups and interviews help you figure out if your quantitative stuff is telling the real story. Plus stakeholders eat up the personal stories way more than spreadsheets (honestly, who doesn't?). Mix both in your reports - numbers get their attention first, but the human stories are what make them actually give a damn and help you fix things.
Honestly? People absolutely hate the extra paperwork - that's your biggest hurdle right there. Your team will think it's just bureaucratic BS instead of something useful. Finding good indicators is tricky too, you don't want vanity metrics that look impressive but mean nothing. Getting reliable data when everyone's already swamped is another headache. Oh, and if leadership isn't backing you, forget about getting proper time or budget. My advice - start with maybe 3-4 indicators that actually connect to what you're trying to achieve. Show some quick wins early on so people see the point.
Don't just collect evaluation data and let it sit there gathering dust - actually use it! Schedule monthly meetings where you dig into what the numbers are saying about your programs. I've watched so many orgs do amazing evaluations then completely ignore the results (drives me nuts honestly). Make the findings easy to digest - dashboards work great, or just simple one-page summaries that busy executives will actually read. You want automatic feedback loops so when evaluation results come in, they trigger real conversations about changes. Pick one decision that's coming up soon and try using your evaluation data as the main factor. Start small but make it count.
Honestly, I'd do a quick check every 6 months, then a bigger review annually. But don't be rigid about it - if your indicators aren't actually capturing what you need or if donors change requirements, update it right away. I've seen too many frameworks just collecting dust because people wait for the "official" review cycle. Major program shifts are another obvious trigger. Start small though - maybe flag 2-3 indicators that feel wonky and fix those first rather than overhauling everything at once. The whole point is staying responsive to what's actually happening in your program.
Honestly, skip the theoretical stuff and jump straight into real project data - that's when it actually makes sense. Mix it up with workshops for the heavy concepts, pair people up for ongoing support, and give them quick reference sheets they'll actually use. PowerPoint marathons are the worst and nobody retains anything from those. Just focus on what your team will really need, not every single framework out there. The buddy system works great too - experienced folks with newbies. Oh, and definitely check in regularly after training because people forget fast without reinforcement.
Oh man, this is huge and so many teams totally blow it. Start with cultural mapping right away - figure out if the community values individual wins or group success. That changes everything about your indicators. People give feedback differently too, like some cultures won't directly criticize stuff even if it's not working. I learned this the hard way on a project in Indonesia actually. Your data collection needs to match how locals actually communicate. Most importantly though? Get community members involved in defining what success even means to them. Don't assume you know.
Okay so first things first - informed consent and keeping people's info private. I swear this gets forgotten all the time when everyone's just trying to collect data fast. Think about who has power in the situation too, like if participants feel pressured to say yes. Cultural stuff matters a lot - don't be that person who assumes everyone thinks like you do. Be upfront about any risks or what they might get out of it. And honestly? Don't mess with vulnerable groups or get people's hopes up about changes that won't happen. Build this ethical thinking right into your plan from the start.
Honestly, visual tools are a game changer for M&E work. Nobody's gonna sit through 50 pages of spreadsheets - I learned that the hard way at my last presentation. Charts and dashboards actually get people to pay attention to your findings. You can show trends super clearly, compare different programs side by side, and suddenly those complex data relationships make sense. Even basic Excel charts work great, though I've been playing around with Tableau Public lately and it's pretty cool for interactive stuff. Your stakeholders will actually engage instead of just nodding politely while secretly checking their phones.
Honestly, you've gotta match your communication style to who you're talking to. Executives just want the highlights and what they should do about it. Program staff need the nitty-gritty details they can actually work with. Mix up your formats - dashboards for quick looks, infographics for board meetings (those always go over well), detailed reports for the people doing the real work. Here's the thing though: telling stories with your data beats dumping spreadsheets on people every time. Use visuals, celebrate wins, don't sugarcoat problems. And definitely don't just email reports and hope for the best - actually present your findings and follow up.
-
The website is jam-packed with fantastic and creative templates for a variety of business concepts. They are easy to use and customize.
-
Appreciate the research and its presentable format.