

Monthly Sales Report With Product Categories




Try Before you Buy Download Free Sample Product
 Impress Your
 Audience
 100%
100% Editable
 Save Hours
 of Time


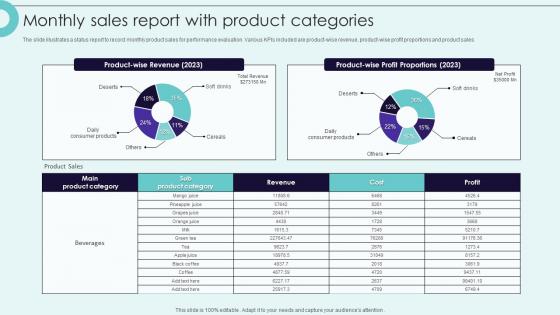
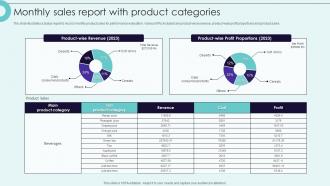
The slide illustrates a status report to record monthly product sales for performance evaluation. Various KPIs included are product wise revenue, product wise profit proportions and product sales.
People who downloaded this PowerPoint presentation also viewed the following :
Monthly Sales Report With Product Categories with all 7 slides:
Use our Monthly Sales Report With Product Categories to effectively help you save your valuable time. They are readymade to fit into any presentation structure.





FAQs for Monthly Sales Report
Focus on the big ones first: revenue, conversion rates, and deal size. Sales cycle length is clutch - shows you if your pipeline's actually working or just sitting there. Honestly, CAC vs lifetime value is where you'll find the real goldmine data. Win/loss ratios and pipeline velocity matter too, plus tracking lead sources so you know what's bringing in quality prospects. I'd say pull these weekly at first - you'll catch patterns way faster than monthly reviews. Maybe I'm overthinking it, but pick your top 3-4 and stick with those religiously instead of trying to track everything.
Honestly, looking at your old sales data is like having a cheat sheet for what actually works. You'll spot patterns you never noticed - like which products kill it during certain months or what regions are your goldmines. The crazy thing is how wrong your instincts can be until you see the actual numbers! It helps you figure out realistic goals too, instead of just throwing darts at a board. Pull maybe 2-3 years worth of data and start with the obvious stuff first. Way better than guessing and hoping for the best.
Think of customer segmentation like sorting your music playlist - way better than having everything jumbled together. You'll actually see which customer groups are crushing it and which ones need work. Honestly, it makes forecasting so much easier too. Break down your customer base first, then watch the patterns pop out. No more staring at endless spreadsheets wondering what it all means. You can target different segments with strategies that actually make sense for them. Plus your resource allocation won't be a total shot in the dark anymore. Start small and you'll be amazed how clear everything becomes.
Honestly, just pull your last 12 months of sales data and start grouping customers by age, location, buying habits - whatever makes sense. You'll notice weird stuff right away, like how certain age groups always buy specific products together or sales randomly spike on particular days (we had this Thursday thing happen too, no clue why). Track what people buy over time and watch for seasonal shifts. Repeat purchase cycles are gold mines. The demographic breakdowns usually show the clearest patterns - millennials doing their thing, boomers sticking to favorites. Don't overthink it at first, just let the obvious trends jump out.
Tableau and Power BI are your best bets honestly - both crush it for sales dashboards. Already using Salesforce? Their analytics are pretty decent too. Look, Excel gets a bad rap but it's still solid for quick stuff. Power BI's probably your move if you've got Office 365 since it might already be in there. Looker and Google Data Studio are good middle ground options with more interactive features than Excel. Really comes down to budget and how messy your data is. I'd mess around with Power BI first though.
Yeah, seasonal stuff will mess up your analysis big time if you're not thinking about it. Compare Q4 to last year's Q4, not to Q3 - otherwise you'll panic when January sales drop after the holidays when that's totally normal. I learned this the hard way honestly. Plot your data across a few years first so you can see your actual patterns. Then do year-over-year comparisons instead of month-to-month. You'll spot real problems way faster once you know what's just seasonal noise versus actual performance issues.
Dude, you absolutely need competitive analysis for sales data - otherwise your numbers exist in a vacuum. Like, 15% growth sounds great until you find out everyone else hit 25%, you know? Start tracking 3-4 main competitors and watch their pricing, features, and how often they beat you. This stuff helps you see why deals slip away and where you might grab market share. Your sales team will thank you too since they'll actually know what they're up against. Honestly, without this context your sales data is just... numbers floating around meaning nothing.
Honestly, dig into your historical data first - that's where the magic happens. Pull the last 12 months and spot your top 3 patterns. Pipeline velocity, conversion rates, seasonal stuff... it all matters way more than guessing. I know a team that jumped their accuracy 30% just by segmenting properly instead of winging it. Also track outside factors - market conditions, what competitors are doing. That correlation stuff really pays off. Customer behavior patterns are huge too. Start there and you'll see the difference pretty quick.
Honestly, the worst mistake is cherry-picking your timeframes - you'll fool yourself into thinking things are better than they are. Also watch out for vanity metrics. I've watched teams get obsessed with call volume while their conversion rates were absolutely tanking. Seasonal stuff and market changes will mess with your data too if you don't account for them. Oh, and actually talk to your sales people! Their feedback is gold. Compare similar periods and territories, not random chunks of time. Figure out what "winning" looks like first, then dig into the numbers.
Dude, sales analysis is seriously your best friend for pricing stuff. Look at your past data first - you'll see which products killed it at different price points and which ones flopped. Then try tweaking prices bit by bit and watch what happens. The cool thing is you can actually spot if customers bail when you raise prices or if you're basically giving money away by pricing too low. I mean, it's not rocket science but the patterns are pretty eye-opening once you start tracking this stuff. Price elasticity sounds fancy but it just shows how sensitive people are to your pricing changes.
Look, sales performance is basically the domino that knocks everything else over. Hit your targets and you'll see predictable cash flow, solid customer relationships, better market position. Miss them? Budget cuts, stunted growth, competitors eating your lunch - oh and your team's gonna feel pretty crappy about it too. One thing I learned the hard way - check your numbers weekly instead of monthly. Sounds obvious but most people don't do it. When things start going sideways (and they will), you can actually fix stuff before it becomes a real problem.
Dude, pull your sales reports from the last year and look for patterns - you'll catch stuff you never noticed before. Historical data shows you what sells when, so you can nail your ordering timing. Fast movers need constant restocking while slow items just eat up your cash flow (learned that the hard way). Seasonal trends are huge too. The crazy part? You'll spot new trends building before they actually hit. No more guessing what to order or dealing with empty shelves. It really does prevent both stockouts and that nightmare of having too much inventory sitting around.
Dude, there's a bunch of ways to track sales in real-time. Salesforce and HubSpot are probably your easiest bet - they sync everything instantly. Power BI and Tableau work too if you want fancy dashboards. API integrations are solid for pulling data into custom setups, though that's more techy. Google Analytics handles online sales tracking pretty well actually. I'd honestly just pick whatever your team won't ignore - I've seen people drop thousands on systems that collect dust because they're too complicated. Simple usually wins.
Honestly, sales analysis is a game-changer for CRM stuff. Look at your customer buying patterns and you'll spot who's valuable vs who might bail soon. When do people usually buy again? What do they typically bundle together? I was shocked when I first dug into this data - there's way more patterns than you'd think. Pull your top 20% customers and check their purchase history first. You can time your outreach way better instead of sending random emails to everyone. It's like having insider info on what actually works with each customer.
So quantitative is all your hard numbers - revenue, conversion rates, that kind of stuff. Qualitative digs into the why behind those numbers through customer feedback and what your sales team is actually seeing out there. Most teams just stare at spreadsheets all day and wonder why they're confused, honestly. Numbers tell you what happened, but you need the qualitative stuff to figure out why it happened. I'd start with your main metrics to see what's going on, then talk to people to understand what's really driving those trends. Both together give you the full picture.
-
The templates you provide are great! They have saved me tons of time and made my presentations come alive. Thank you for this awesome product. Keep up the good work!
-
I faced no difficulty while searching for the slide I wanted. Honestly, the website’s interface is easy to use and can be navigated easily!