


Monthly Sales Performance Inspection Dashboard




Try Before you Buy Download Free Sample Product
 Impress Your
 Audience
 100%
100% Editable
 Save Hours
 of Time


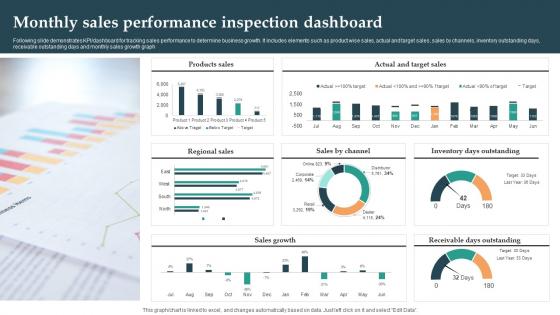
Following slide demonstrates KPI dashboard for tracking sales performance to determine business growth. It includes elements such as product wise sales, actual and target sales, sales by channels, inventory outstanding days, receivable outstanding days and monthly sales growth graph.
People who downloaded this PowerPoint presentation also viewed the following :
Monthly Sales Performance Inspection Dashboard with all 7 slides:
Use our Monthly Sales Performance Inspection Dashboard to effectively help you save your valuable time. They are readymade to fit into any presentation structure.





FAQs for Monthly Sales
Essential sales metrics include revenue performance, conversion rates, lead generation numbers, sales cycle length, and individual rep performance tracking. These metrics streamline decision-making by providing real-time visibility into pipeline health, identifying bottlenecks, and enabling proactive adjustments, with many organizations finding that comprehensive dashboards ultimately enhance forecasting accuracy and accelerate revenue growth.
Data visualization enhances sales dashboard readability by transforming complex datasets into intuitive charts, graphs, and visual indicators that highlight key performance trends at a glance. Through strategic use of color coding, interactive elements, and clear visual hierarchies, sales teams can quickly identify opportunities, track quota progress, and spot performance patterns, ultimately enabling faster decision-making and more effective sales strategies.
Common tools for creating sales dashboards include Tableau, Power BI, Salesforce Analytics, HubSpot, Google Data Studio, and Looker. These platforms streamline data visualization by integrating multiple sales sources, automating report generation, and providing real-time insights, with many organizations finding that interactive dashboards enhance decision-making speed and improve sales performance tracking.
A sales dashboard helps identify performance trends by tracking key metrics like revenue growth, conversion rates, deal velocity, and team productivity across different time periods, enabling pattern recognition through visual data representation. Through historical comparisons and trend analysis, sales managers can spot seasonal fluctuations, identify top performers, and pinpoint areas needing improvement, ultimately delivering strategic insights that enhance forecasting accuracy and competitive advantage.
Real-time data serves as the foundation for sales dashboard effectiveness by enabling immediate decision-making, accurate performance tracking, opportunity identification, and rapid response to market changes. Through live updates, sales teams can adjust strategies instantly, capitalize on emerging leads, and address performance gaps before they impact revenue, ultimately delivering competitive advantage and significantly improved sales outcomes.
Sales dashboards can be customized through role-based access controls, personalized KPI selections, departmental views, and stakeholder-specific metrics tailored to individual responsibilities and authority levels. These customization features enable sales managers to focus on team performance while executives access strategic overviews, ultimately delivering relevant insights that enhance decision-making and streamline sales operations across organizational hierarchies.
Common pitfalls include cluttering dashboards with excessive metrics, using poor visual hierarchy, lacking real-time data integration, ignoring user-specific needs, and failing to align KPIs with strategic goals. These design flaws ultimately undermine decision-making effectiveness, with many sales organizations finding that streamlined, role-based dashboards with actionable insights deliver significantly better adoption rates and performance outcomes.
Sales dashboards integrate with CRM systems through API connections, real-time data synchronization, and automated reporting workflows, creating unified views of customer interactions, pipeline status, and performance metrics. This strategic combination enables sales teams to track lead conversions, monitor deal progression, and identify revenue opportunities more effectively, with many organizations finding that integrated systems deliver faster decision-making and improved sales forecasting accuracy.
Best practices for sharing sales dashboards with remote teams include using cloud-based platforms, establishing real-time access controls, creating mobile-responsive designs, scheduling automated updates, and implementing collaborative commenting features. These approaches streamline remote collaboration by ensuring consistent data visibility, enabling seamless cross-timezone coordination, and maintaining team alignment, with many distributed organizations finding that centralized dashboard sharing ultimately enhances sales performance and accountability.
Sales forecasts can be accurately reflected in dashboards through real-time pipeline data integration, historical trend analysis, predictive analytics algorithms, and dynamic scenario modeling. These technologies streamline forecasting by incorporating lead conversion rates, seasonal patterns, and sales cycle metrics, with many organizations finding that automated data visualization ultimately delivers more precise predictions and enhanced strategic planning capabilities.
Effective sales performance visualizations include bar charts for target comparisons, line graphs for trend analysis, heat maps for territory performance, pie charts for revenue breakdown, and gauge charts for KPI tracking. These techniques enhance decision-making by highlighting patterns, identifying underperforming regions, and tracking progress against goals, with many sales organizations finding that combining multiple visualization types delivers comprehensive insights and accelerates strategic responses.
Sales dashboards should be updated in real-time or daily to maintain relevance, with weekly reviews for strategic metrics and monthly assessments for long-term trends. This frequency enables sales teams to respond quickly to market changes, track performance against quotas, and identify emerging opportunities, while managers can make data-driven decisions that ultimately enhance team productivity and revenue generation.
Customer engagement metrics include website session duration, email open and click-through rates, social media interactions, content downloads, and product demo requests. These indicators help sales teams identify highly engaged prospects by tracking behavioral patterns, content consumption frequency, and interaction depth across multiple touchpoints, ultimately enabling more targeted outreach and higher conversion rates.
User feedback improves sales dashboard design by identifying pain points, revealing workflow gaps, and highlighting missing metrics that impact daily operations. Through regular surveys, user testing sessions, and performance analytics, organizations can enhance interface usability, streamline data visualization, and optimize feature placement, ultimately delivering dashboards that boost sales productivity and decision-making efficiency.
Mobile-friendly sales dashboards deliver real-time access to key metrics, enhanced team collaboration, faster decision-making, improved customer responsiveness, and seamless integration across devices. These platforms enable sales teams to update opportunities, track performance, and respond to client needs instantly while in the field, ultimately delivering competitive advantage and increased revenue capture for organizations.
-
SlideTeam’s readymade presentations have landed my unique images with my bosses in the past and it continues to reward me.
-
Like always a great experience with you guys. Always there on the drop of hat to help.