


Multiple Pie Charts Powerpoint Ppt Template Bundles




Try Before you Buy Download Free Sample Product
 Impress Your
 Audience
 100%
100% Editable
 Save Hours
 of Time


Our Multiple Pie Charts Powerpoint Ppt Template Bundles are topically designed to provide an attractive backdrop to any subject. Use them to look like a presentation pro.
People who downloaded this PowerPoint presentation also viewed the following :
Multiple Pie Charts Powerpoint Ppt Template Bundles with all 17 slides:
Use our Multiple Pie Charts Powerpoint Ppt Template Bundles to effectively help you save your valuable time. They are readymade to fit into any presentation structure.
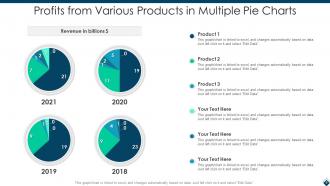
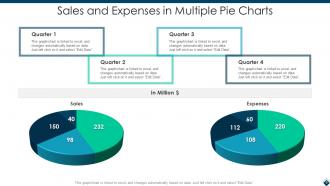
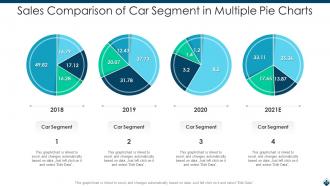
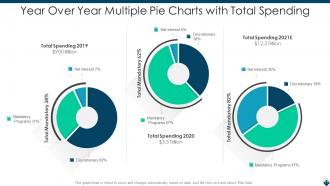






FAQs for Multiple Pie Charts Powerpoint
Honestly, side-by-side pie charts are perfect when you need to compare stuff across different time periods or regions. Way better than shoving everything into one confusing mess. Your audience can actually see what's going on! Budget breakdowns work great this way too - people spot the differences right away. I always use the same colors across all the charts though, otherwise it gets weird trying to compare things. The visual impact hits different when you can see proportions clearly laid out like that. Makes patterns super obvious.
Honestly, multiple pie charts are a lifesaver when your data gets messy. You can split things up by category or time period instead of shoving everything into one confusing chart. Think of it like telling a story with multiple scenes - each pie shows one piece, but together they give the full picture. Works great for comparing different groups or seeing how things shift over time. I always do a grid layout so people can scan them quickly. Way better than one giant pie that nobody can read (learned that the hard way).
Use multiple pie charts when you're comparing the same stuff across different groups or time periods. Like sales by product category for each region, or budget changes quarter to quarter. Don't go crazy though - 3-5 charts max or it gets messy. Each one should connect to tell the bigger story. Your audience will catch patterns way easier this way. Oh, and definitely keep your colors consistent between charts. Otherwise people get lost trying to figure out what matches what. I learned that the hard way once - total disaster presentation.
Honestly, less is more with pie charts. Stick to 5-6 slices max or people's eyes just glaze over. Same colors across all your charts too - it looks way more professional. Make sure there's breathing room between each one, and for the love of god, make your text big enough! I once watched someone present with tiny labels and half the room was squinting the whole time. Keep your pie sizes the same unless the numbers are wildly different. Oh, and don't forget actual percentages in the labels. People shouldn't have to do math while you're talking.
Honestly, the worst thing you can do is cram like 6 pie charts onto one slide - people just shut down when they see that mess. Stick to 3-4 max. Also, don't make those tiny slices under 5% because nobody in the back can even see them. Oh, and keep your colors consistent if you're comparing the same stuff across charts - otherwise it's just confusing. Skip the 3D effects too (I know they look fancy but they actually make the data look wrong). Clean titles help a ton so people know what they're looking at.
Here's what I'd do - create one master color palette first and never deviate from it. PowerPoint's built-in themes are honestly pretty decent for this. Pick maybe 5-8 colors that look good together. Then here's the crucial part: if Marketing is blue in your first chart, it stays blue forever. Same with every other category. I can't tell you how many presentations I've seen where colors are all over the place - it looks so sloppy. Make yourself a little cheat sheet beforehand so you don't accidentally switch things up. Trust me, consistency makes such a difference.
Find templates with editable data tables - you can just plug your numbers right in. Color schemes should match across all your charts, obviously. The animation thing is huge though - having pie charts appear one by one instead of everything at once actually keeps people awake during presentations. Auto-calculating percentages are a lifesaver. Check that legends don't cover up your data (happens more than you'd think). Most good templates give you layout options like grids or side-by-side setups. Honestly, just test the first chart - if changing the data is a pain, move on to the next one.
Honestly, side-by-side pie charts work great for this! Just stick with the same colors across all of them - it makes spotting patterns so much easier. Your data needs to be comparable though, like sales by region or budget breakdowns. I'd arrange them in a grid with clear titles above each one. Don't go crazy with too many slices (maybe 5-7 max or it gets messy). Oh, and keep your categories consistent between charts - otherwise people won't know what they're comparing. It's one of those things that seems obvious but you'd be surprised how often people mess it up.
Keep your font sizes and colors the same across all charts so people can actually compare them. Labels should go inside the slices when there's room, otherwise use clean lines pointing to each section. Honestly, nothing bugs me more than charts where you need a magnifying glass to read anything! If all your pie charts show the same categories, go with one legend. Different data sets? Individual labels work way better. Your titles need to be specific about what each chart shows. Oh, and definitely do the "back of the room" test - you'd be surprised how many presentations fail that one.
Yeah, try staggering the entrance animations so each pie chart appears one at a time instead of all together. Fade or Fly In effects work great - space them like half a second apart. Creates this cool cascading thing that actually holds attention. The Wipe animation for individual slices is honestly my favorite, makes everything feel way more alive. Oh and animate your titles/labels separately too, builds the whole story step by step. Just don't get too crazy with effects or people will miss your actual data. Keep it clean but interesting.
Honestly, bar charts are your friend when people need to compare numbers accurately. Pie charts? They're pretty but terrible for that. Line charts crush it for showing trends over time - way better than trying to use multiple pies (which looks messy anyway). If you're comparing parts of different wholes, go with stacked bars instead of side-by-side pies. Sometimes I just use a simple table though - people can reference exact numbers without squinting at chart slices. Quick comparisons = bars or lines. Skip the pie unless it's actually... well, pie.
Yeah, pie charts are weird - older execs still love them because they're familiar and simple. Younger people think they look outdated, which... fair point. Most Western audiences read them clockwise from 12 o'clock, but other cultures might process circular info differently. People with data backgrounds usually prefer bar charts since they're more accurate. General audiences find pie charts easier to grasp though. Oh, and education level totally changes how people interpret them. I'd just know your audience beforehand and maybe add a quick note explaining how to read it, especially if you're presenting internationally.
So pie charts are kinda controversial actually. Cleveland and McGill did this research showing people suck at comparing angles - like, we're way better at comparing bar lengths. But honestly? I still use pie charts all the time for client presentations. They're perfect when you've got maybe 3-5 categories and want people to instantly see the whole picture. Sure, they won't get the exact percentages, but sometimes that's not the point. Bar charts are more accurate but pie charts just... click better with business folks. Just don't go crazy with too many slices.
So you'd put like 3-4 pie charts next to each other, each one showing a different time period. More than that gets pretty messy to look at honestly. Same colors for each category across all the charts - that way people can actually track what's changing. Left to right works best since that's how we naturally read stuff. Oh and definitely label the time periods clearly on each one. If there's some big shift you want people to notice, throw percentage labels on those slices. I've seen people try to cram too many time periods and it just becomes impossible to follow.
Order your pie charts in a way that makes sense - chronologically works well, or by importance. Just make sure you're actually comparing similar stuff (same time frames, matching categories, etc). Focus on one main point per chart. People's attention spans are terrible these days, so don't cram everything in there. Keep your colors consistent across all charts so viewers can follow the same segments easily. Honestly, the summary slide at the end is where you really win people over. That's where you tie it all together and tell them what they should actually do with what they just saw.
-
Best way of representation of the topic.
-
Best way of representation of the topic.