

Net promoter score scale template powerpoint graphics





Try Before you Buy Download Free Sample Product
 Impress Your
Audience
 100%
Editable
 Save Hours
of Time


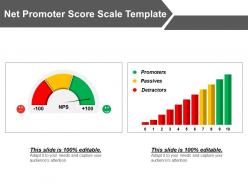
Evaluate your customer buying behavior and their satisfaction level you should use our net promoter score scale PPT template. It will help in retaining your existing customers for a long time. It also helps your management to reduce your customer churn rate too. Measure how likely your existing customer will recommend your products or service to the potential business customer with the use of this net promoter PowerPoint diagram. You can also predict your business development rate on the basis of this NPS PowerPoint diagram template. It likewise allows you calculate the customer experience with your organization. It will work as an essential customer management tool for your company management to understand their customer in an effective manner. You can improve your business-customer relations with this net promoter score benchmarks PPT image layout. It would further help in developing an effective organizational structure. Therefore, just simply click on the download tab and start commencing with our professional net promoter score PowerPoint layout template. Consider every factor in depth with our Net Promoter Score Scale Template Powerpoint Graphics. It helps arrive at important decisions.
People who downloaded this PowerPoint presentation also viewed the following :
Net promoter score scale template powerpoint graphics with all 5 slides:
Experience gaiety with our Net Promoter Score Scale Template Powerpoint Graphics. There will be an air of festivity all around.


FAQs for Net promoter score scale
So NPS is basically asking customers "How likely are you to recommend us?" on a 0-10 scale. Pretty simple stuff. You split responses into three groups: Promoters (9-10), Passives (7-8), and Detractors (0-6). The math is straightforward - take your % of Promoters minus % of Detractors. Like if 50% are Promoters and 20% are Detractors, you get an NPS of 30. Scores go from -100 to +100, and honestly anything above 50 is considered really good. I'd check it quarterly to see how things are trending. The passives don't factor into the calculation which always seemed weird to me, but that's just how it works.
So NPS is basically just asking customers "would you recommend us?" on a 0-10 scale. You sort responses into three buckets - promoters (9-10), passives (7-8), and detractors (0-6). Then subtract detractor percentage from promoter percentage. Way easier than those crazy long satisfaction surveys nobody wants to fill out. Honestly, the number itself isn't everything though. What matters is watching how it changes and - this is key - actually reaching out to people who gave you low scores. Send it after big interactions with customers. Oh, and don't just collect the data and forget about it like most companies do.
Honestly, NPS is great because it's just one simple number that tracks customer loyalty across everything. Super easy for executives to get behind since they love straightforward metrics. You can compare yourself to competitors and watch progress over time - plus it costs almost nothing to run compared to fancy research studies. But here's the thing - the real magic happens in those follow-up comments. That's where customers actually tell you what's pissing them off or making them happy. I'd start by sending surveys right after major interactions with customers, then really dig into what people are saying. That's where you'll find the easy fixes that make a real difference.
Honestly, the worst thing you can do is obsess over bumping your score from like 30 to 35 without figuring out WHY people are unhappy. I've seen so many teams just survey their favorite customers (which is total BS) or ignore the actual feedback. Also - and this one's huge - don't lump all your data together. Your enterprise customers might love you while smaller clients are miserable, but you'll never know if you're not breaking it down. Always add follow-up questions asking people to explain their rating. Those written responses are where the good stuff is. Numbers are cool but they don't tell you what's broken.
You want to break down your NPS by different customer groups - that's where the real insights live. Look at things like how long they've been customers, which product they use, company size, whatever matters for your business. I've seen cases where enterprise clients are super happy but small businesses hate the experience. Or sometimes new users are way more excited than people who've been around forever. Don't just stare at that overall score. Pick the segments that'll actually impact your bottom line and focus there first.
Look, NPS is kinda like having a compass for your customer experience stuff. It's not perfect, but beats guessing how people actually feel about your product. Track it regularly and you'll spot patterns - like which parts of your service turn customers into fans versus haters. The magic happens when you dig deeper though. Don't just look at the numbers - figure out WHY people gave those scores. I'd start by grouping all your unhappy customers' complaints to see what's really bugging them. Then you can actually fix the stuff that matters most. Way more useful than those random "how'd we do?" surveys that nobody fills out anyway.
Don't just collect the feedback - actually do something with it! Hit up your detractors fast, like within a day or two. Find out what went wrong and show them you give a damn. Your promoters? They're gold - thank them and see if they'll drop a review or send friends your way. Passives are honestly the toughest crowd since they're just... meh. But track what people keep complaining about and fix those things. Here's the part most companies mess up though: tell everyone what changes you made because of their input. Nobody wants to feel like they're shouting into the void.
Yeah, so promoters (those 9-10 scores) usually hang around way longer and spend more cash over time - that's your CLV boost right there. Detractors? They bounce fast and don't spend much before leaving. Honestly, I've seen some weird cases where people absolutely love a brand but just aren't big spenders, so it's not always perfect. But most of the time, better NPS means better CLV because happy customers stick around and tell their friends. You should definitely track both together - that's how you'll see if all those satisfaction tweaks actually translate to more money in your pocket.
Quarterly works best for most companies - gives you solid trend data without annoying customers. Monthly's only worth it if you've got tons of volume, plus honestly most teams can't even keep up with acting on that much feedback anyway. Don't go annual unless you're in like enterprise software or something with super long cycles. Way too slow otherwise. The real trick is staying consistent with your timing and sample size. Otherwise you can't compare anything meaningful. I'd set up those automated surveys right after key interactions - customer support, onboarding, whatever. Catches people when the experience is still fresh instead of some random Tuesday three weeks later.
Industry benchmarks are all over the place, honestly. SaaS companies usually hit 30-40, which isn't bad. Airlines? They're lucky to break even - that industry's brutal. Retail sits somewhere between 20-50, and banks typically land around 10-30. But here's the thing - comparing yourself to your own past scores matters way more than industry averages. Track your trends quarterly and just keep climbing. Satmetrix has decent benchmark data if you really want to see where you stack up, though I'd focus on beating last year's numbers first. Way more meaningful.
Dude, you can't just compare NPS scores straight across different countries - cultural differences totally mess with the numbers. Germans and Japanese people are super stingy with high ratings, rarely handing out 9s or 10s. Meanwhile Americans are pretty generous with scores. Scandinavians though? Forget about getting above a 7 from them, they're just built different. So your "terrible" 20 NPS in Germany might actually mean customers are just as happy as somewhere with a 50 NPS in Brazil. You've gotta compare against what's normal for each region, not some global benchmark that doesn't account for how different cultures rate things.
Yeah, definitely. Companies with higher NPS scores usually see better revenue growth - makes total sense when you think about it. Happy customers stick around longer and buy more stuff, plus they actually recommend you to friends. Meanwhile the unhappy ones bail quickly and you're stuck spending more to replace them. I've seen research saying a 12-point NPS bump can double revenue growth, though that probably varies a lot by industry. Honestly, the best approach is tracking your own numbers over time. Compare your quarterly NPS shifts with customer lifetime value and how many people are actually sticking around - that's where the money connection becomes super obvious.
Don't just throw numbers at people - tell the story behind them. Break things down by customer segments and show trends over time. Those direct customer quotes? Gold. They make executives actually pay attention way more than charts do. If you can swing competitive benchmarks, even better. Keep your visuals clean and connect everything to real business stuff like retention or revenue impact. Oh, and definitely end with 2-3 concrete action items. People need to walk away knowing what they're supposed to do, otherwise you'll get that glazed-over "thanks, we'll think about it" response.
Honestly, automated survey tools like Medallia or SurveyMonkey are total lifesavers for NPS stuff. They'll send surveys automatically at the right moments and pull responses in real-time. Dashboards calculate everything for you - scores broken down by customer type, purchase history, whatever you need. Here's the best part though: text analytics handles all those comment reviews so you don't have to sit there reading hundreds of responses (seriously, who has time for that?). Most platforms send alerts when your scores tank too. My advice? Pick one solid integrated platform instead of mixing random tools together. Trust me on this one.
Okay so honestly, start by actually reading what your detractors and passives are saying - like really dig into their specific complaints. Are they mad about the product itself, terrible customer service, or pricing being too high? Whatever patterns you find, tackle the biggest issues first. Here's what most companies mess up though - they implement changes but never circle back to those unhappy customers to show they listened. Big mistake. You've gotta follow up with them directly. And yeah, keep measuring your NPS regularly after you make improvements. Otherwise you're just throwing stuff at the wall hoping something sticks.
-
Awesome use of colors and designs in product templates.
-
Graphics are very appealing to eyes.