


Product Portfolio Planning And Analysis Powerpoint Presentation Slides




Try Before you Buy Download Free Sample Product
 Impress Your
 Audience
 100%
100% Editable
 Save Hours
 of Time


Product Portfolio is a representation of an organization’s course of action for achieving its desired goals. Our content-ready product portfolio planning and analysis PowerPoint presentation slides will help you achieve the perfect portfolio mix to reach your goal. For this purpose, we have tried to provide in-depth knowledge through slides on product research, idea, concept, design, production, manufacturing concept, prototyping, new product launch scope, market gap analysis, ideal customer profile, and market entry strategy. You can utilize the same product planning PPT to design presentation on product portfolio management, portfolio strategy, strategic portfolio planning, project portfolio model, and portfolio optimization. Having a broad product portfolio makes you risk free. If one product is rejected others can be considered. Download product portfolio planning and analysis presentation to make sure that the products you invest in deliver success to your company. Highlight incorrect evaluations with our Product Portfolio Planning And Analysis Powerpoint Presentation Slides. Counter invalid claims.
People who downloaded this PowerPoint presentation also viewed the following :
Content of this Powerpoint Presentation
Slide 1: This slide introduces Product Portfolio Planning and Analysis. State Your Company Name and get started.
Slide 2: This is an Agenda slide. State your agendas here.
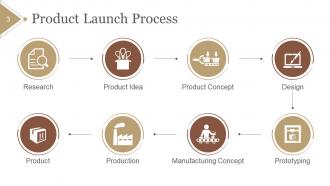
Slide 3: This slide shows Product Launch Process showing- Product, Prototyping, Production, Manufacturing Concept, Research, Product Idea, Product Concept, Design.
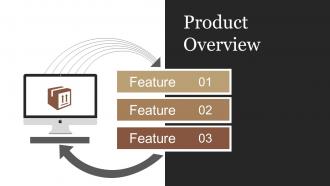
Slide 4: This is Product Overview slide for stating features.
Slide 5: This slide showcases Concept Definition and Key Challenges with- Product Idea, Process Idea, VISION, User, Technology, Innovation, Process, Marketing.
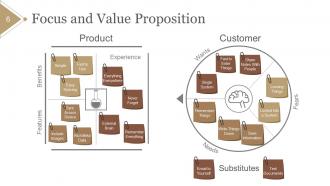
Slide 6: This slide presents Focus and Value Proposition for Product and Customer with- Benefits, Features, Experience, Simple, Easy Syncing, Rich Meta Data, Include Images, Everything, Everywhere, Fast to Use, Sync Across Device, Never Forget, External Brain, Remember Everything, Customer, Wants, Needs, Fears, Write Things Down, Save Information, Locked Into a System, Loosing Things, Single System, Share Notes With People, Fast to Enter Things, Remember Things, Substitutes, Email to Yourself, Text Documents.
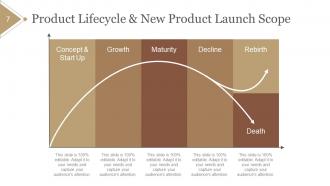
Slide 7: This slide displays Product Lifecycle & New Product Launch Scope showcasing- Rebirth, Death, Decline, Maturity, Growth, Concept & Start Up.
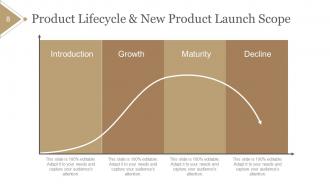
Slide 8: This slide shows Product Lifecycle & New Product Launch Scope showing- Introduction, Growth, Maturity, Decline.
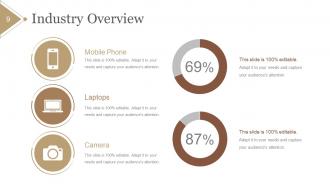
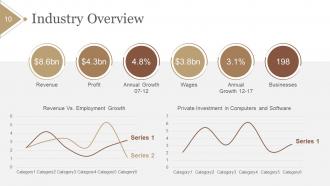
Slide 9: This slide shows Industry Overview.
Slide 10: This slide shows Industry Overview in graphical form displaying- Wages, Businesses, Profit, Revenue, Annual Growth, Revenue Vs. Employment Growth, Private Investment.
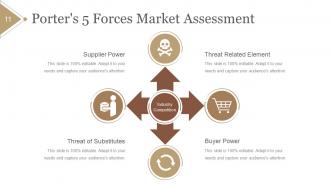
Slide 11: This slide shows Porter's 5 Forces Market Assessment displaying- Threat Related Element, Buyer Power, Supplier Power, Threat of Substitutes as points of Industry Competition.
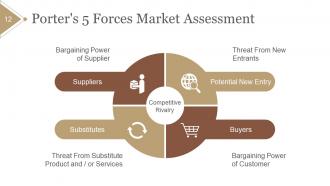
Slide 12: This slide shows Porter's 5 Forces Market Assessment displaying- Bargaining Power of Supplier, Threat From New Entrants, Threat From Substitute Product and / or Services, Bargaining Power of Customer, Potential New Entry, Buyers, Substitutes, Suppliers, Competitive, Rivalry.
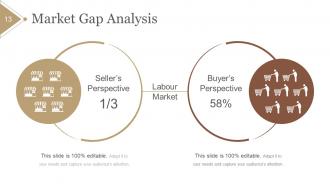
Slide 13: This slide shows Market Gap Analysis displaying- Labour Market, Buyer’s Perspective, Seller’s Perspective.
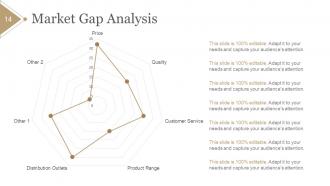
Slide 14: This slide shows Market Gap Analysis in graph form.
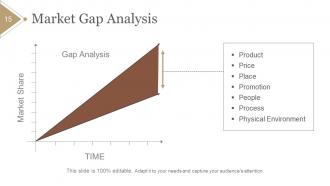
Slide 15: This slide shows Market Gap Analysis in graph form displaying- TIME, Market Share, Gap Analysis, Product, Price, Place, Promotion, People, Process, Physical Environment.
Slide 16: This is a Coffee Break slide to halt. You may alter/modify the content as per need.
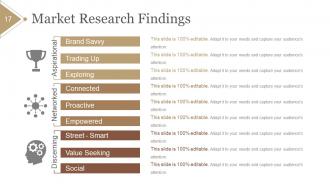
Slide 17: This slide shows Market Research Findings displaying- Discerning, Networked, Aspirational, Brand Savvy, Trading Up, Exploring, Connected, Proactive, Empowered, Street - Smart, Value Seeking, Social.
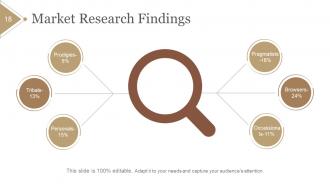
Slide 18: This slide shows Market Research Findings showing- Pragmatists, Browser, Occassionals, Prodigies, Tribals, Personals.
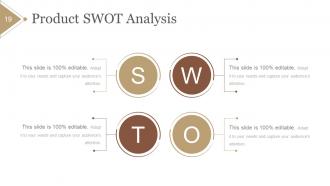
Slide 19: This is a Product SWOT Analysis slide.
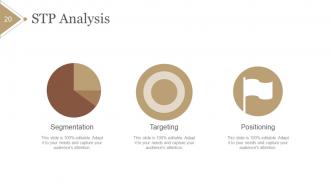
Slide 20: This slide shows STP Analysis displaying- Targeting, Positioning, Segmentation.
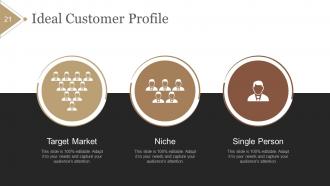
Slide 21: This slide shows Ideal Customer Profile displaying- Target Market, Niche, Single Person.
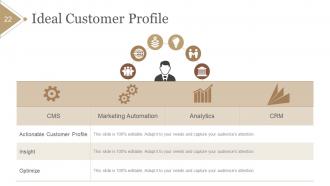
Slide 22: This is also Ideal Customer Profile slide.
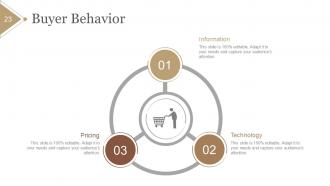
Slide 23: This slide presents Buyer Behavior.
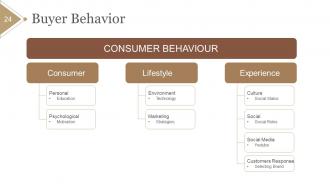
Slide 24: This slide presents Buyer Behavior showcasing- Personal, Education, Psychological, Motivation, Environment, Technology, Marketing, Strategies, Culture, Social Status, Social, Social Roles, Social Media, Youtube, Customers Response, Selecting Brand, headed under- Consumer, Lifestyle, Experience.
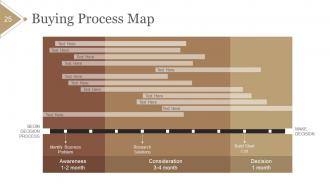
Slide 25: This slide presents a Buying Process Map.
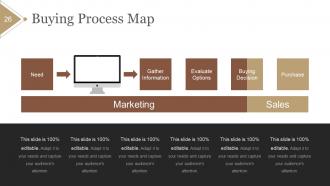
Slide 26: This slide showcases Buying Process Map displaying- Need, Gather Information, Evaluate Options, Buying Decision, Purchase, Marketing, Sales.
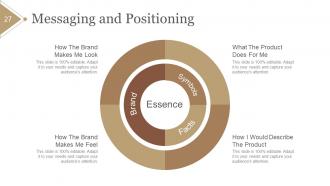
Slide 27: This slide shows Messaging and Positioning showing- How The Brand Makes Me Look, How The Brand Makes Me Feel, What The Product Does For Me, How I Would Describe The Product subheaded under- Brand, Symbols, Facts, Essence.
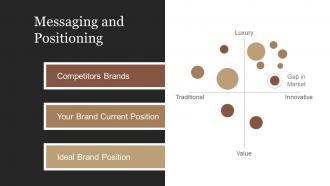
Slide 28: This slide shows Messaging and Positioning showing- Competitors Brands, Your Brand Current Position, Ideal Brand Position, Innovative, Luxury, Value, Traditional, Gap in Market.
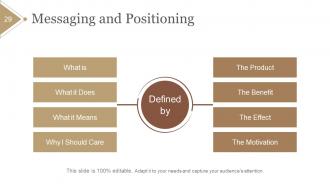
Slide 29: This slide displays Messaging and Positioning showing- What is, What it Does, What it Means, Why I Should Care, The Product, The Benefit, The Effect, The Motivation subheaded under- Defined by.
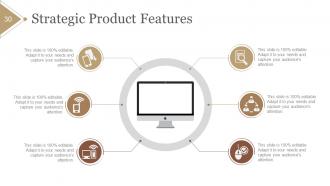
Slide 30: This slide presents Strategic Product Features to be displayed.
Slide 31: This slide presents Strategic Product Features to be displayed.
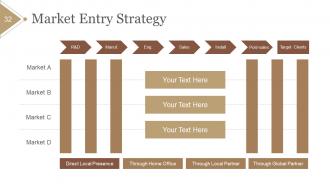
Slide 32: This slide shows Market Entry Strategy.
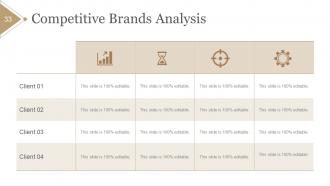
Slide 33: This slide shows Competitive Brands Analysis in tabular form.
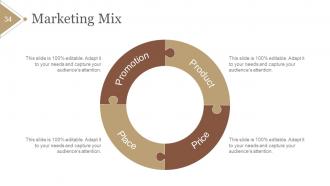
Slide 34: This slide shows Marketing Mix displaying- Product, Price, Place, Promotion.
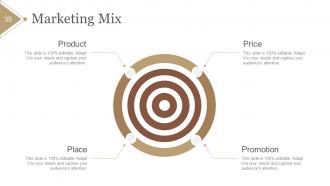
Slide 35: This slide shows Marketing Mix displaying- Product, Price, Place, Promotion.
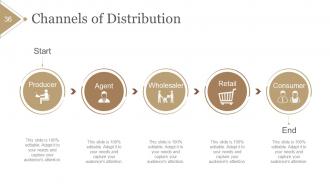
Slide 36: This slide shows Channels of Distribution displaying- Start, End, Producer, Wholesaler, Retail, Agent, Consumer.
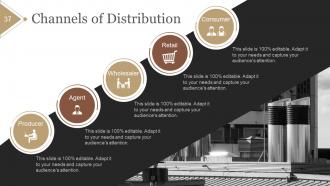
Slide 37: This slide shows Channels of Distribution displaying- Start, End, Producer, Wholesaler, Retail, Agent, Consumer.
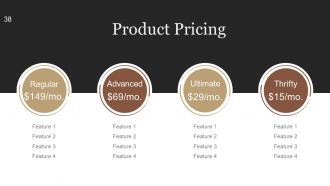
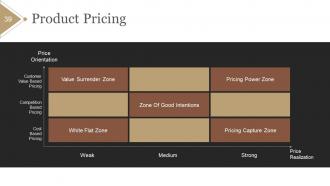
Slide 38: This slide showcases Product Pricing to be displayed.
Slide 39: This slide shows Product Pricing with- Price Orientation, Price Realization, Customer Value Based Pricing, Competition Based Pricing, Cost Based Pricing, Zone Of Good Intentions, Value Surrender Zone, White Flat Zone, Pricing Capture Zone, Pricing Power Zone.
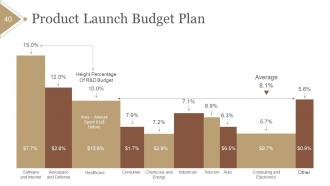
Slide 40: This slide shows a Product Launch Budget Plan.
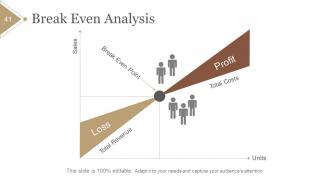
Slide 41: This slide showcases Break Even Analysis to be done.
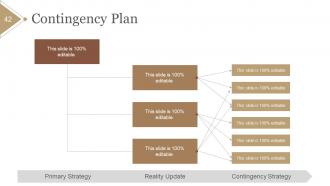
Slide 42: This slide shows a Contingency Plan displaying- Contingency Strategy, Reality Update, Primary Strategy.
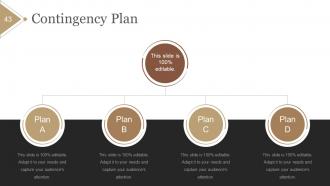
Slide 43: This slide shows a Contingency Plan.
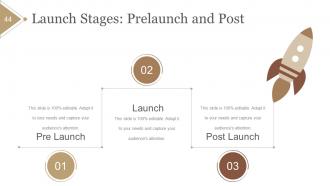
Slide 44: This slide shows Launch Stages: Prelaunch and Post.
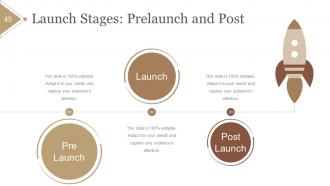
Slide 45: This slide shows Launch Stages: Prelaunch and Post.
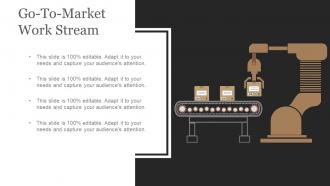
Slide 46: This slide displays Go-To-Market Work Stream.
Slide 47: This slide displays Go-To-Market Work Stream with- How to Sell, Where to Sell, What to Sell, Marketing Strategy, Markets, Customers, Products.
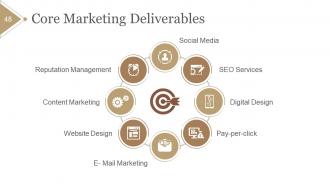
Slide 48: This slide presents Core Marketing Deliverables such as- Content Marketing, Pay-per-click, E- Mail Marketing, Reputation Management, Website Design, Digital Design, SEO Services, Social Media.
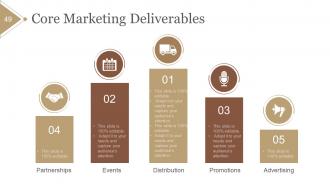
Slide 49: This slide shows Core Marketing Deliverables such as- Partnerships, Events, Distribution, Promotions, Advertising.
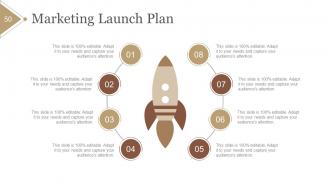
Slide 50: This slide shows a Marketing Launch Plan.
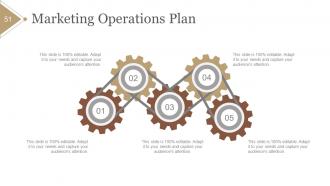
Slide 51: This slide shows a Marketing Operations Plan.
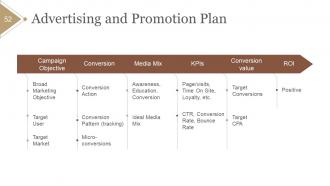
Slide 52: This slide showcases Advertising and Promotion Plan.
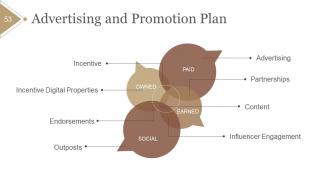
Slide 53: This slide showcases Advertising and Promotion Plan with- Incentive, Incentive Digital Properties, Endorsements, Outposts, Advertising, Content, Partnerships, Influencer Engagement.
Slide 54: This slide shows Launch Team Structure and Rules displaying- Manager, Communication & Brand, Integrated Marketing, Field & Partner Marketing, Digital Marketing & Operations, Product Marketing.
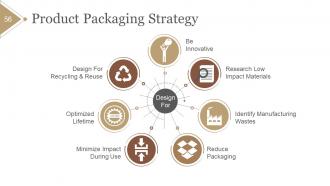
Slide 55: This slide shows Product Packaging Strategy to be displayed.
Slide 56: This slide shows Product Packaging Strategy to be displayed such as- Be Innovative, Reduce Packaging, Minimize Impact During Use, Identify Manufacturing Wastes, Optimized Lifetime, Research Low Impact Materials, Design For Recycling & Reuse.
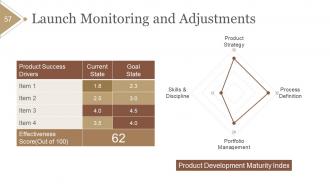
Slide 57: This slide presents Launch Monitoring and Adjustments. Display Product Development Maturity Index with ease.
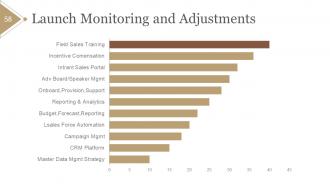
Slide 58: This slide shows Launch Monitoring and Adjustments in graph form.
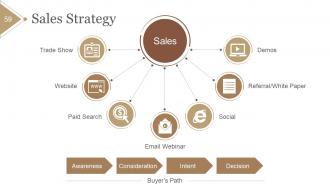
Slide 59: This slide showcases Sales Strategy displaying- Awareness, Consideration, Intent, Decision, Buyer’s Path, Trade Show, Website, Paid Search, Email Webinar, Social, Referral/White Paper, Demos, Sales.
Slide 60: This slide is titled Sales Strategy. You may change the slide content as per need.
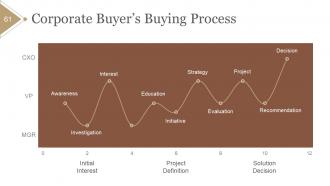
Slide 61: This slide shows Corporate Buyer’s Buying Process displaying- Decision, Recommendation, Evaluation, Project, Initiative, Awareness, Strategy, Education, Interest, Investigation, CXO, VP, MGR, Solution Decision, Initial Interest, Project Definition.
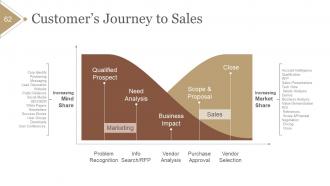
Slide 62: This slide shows Customer’s Journey to Sales displaying- Problem Recognition, Info Search/RFP, Vendor Analysis, Purchase Approval, Vendor Selection, Qualified Prospect, Need Analysis, Business Impact, Scope & Proposal, Close Sales, Marketing, Increasing Market Share, Account Intelligence Qualification, RFP, Sales Presentations Tech Note, Needs Analysis Demos, Business Analysis Value Demonstration ROI, References, Scope &Proposal Negotiation, Pricing, Close, Increasing Mind Share, Corp Identify Positioning Messaging, Lead Generation Website, Public Relations Social Media SEO/SEM, White Papers Newsletters Success Stories User Groups Downloads, User Conferences.
Slide 63: This is Product Portfolio Planning Icons Set slide. Use the icons as per need.
Slide 64: This slide is titled Additional Slides to move forward. You may alter/modify the content as per need.
Slide 65: This is Our Vision slide with Mission, and Goals. State them here.
Slide 66: This is Meet Our Team slide with names, designation and image boxes to fill information.
Slide 67: This is an About Us slide. State company/team specifications here.
Slide 68: This is Our Goal slide. State them here.
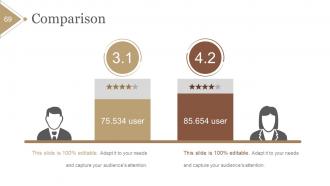
Slide 69: This slide shows Comparison. State comparison aspects etc. here.
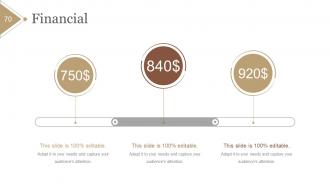
Slide 70: This is a Financial score slide. State financial aspects here.
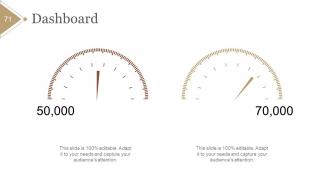
Slide 71: This slide displays Dashboard with imagery and text boxes to present kpis, metrics etc.
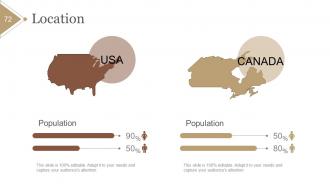
Slide 72: This slide showcases Location in world map image. Show global presence, growth etc. here.
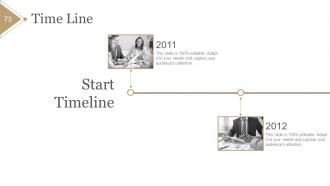
Slide 73: This is a Timeline slide. Show milestones, achievements, growth, journey etc. here.
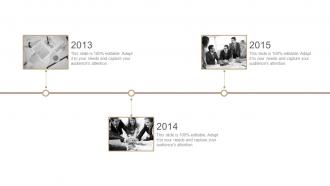
Slide 74: This is a Timeline slide. Show milestones, achievements, growth, journey etc. here.
Slide 75: This is a Timeline slide. Show milestones, achievements, growth, journey etc. here.
Slide 76: This is a Puzzle image slide to show information, specification etc.
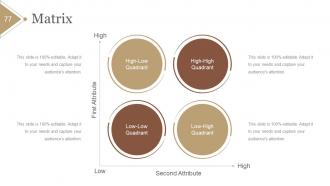
Slide 77: This is a Matrix slide. State information, specification etc. here.
Slide 78: This is a Lego Box slide. State information, specification etc. here.
Slide 79: This is a Contact Us slide with Address # street number, city, state, Contact Numbers, Email Address.
Slide 80: This is a Thank You slide for acknowledgement.
Product Portfolio Planning And Analysis Powerpoint Presentation Slides with all 80 slides:
Our Product Portfolio Planning And Analysis Powerpoint Presentation Slides team use current designs. They are also aware of emerging fashions.














FAQs for Product Portfolio Planning And Analysis
You'll want to nail three main things: strategic alignment, portfolio balance, and regular check-ins. Map your products against business goals first - I bet you'll spot weird gaps or duplicates right away. Balance risky moonshots with your bread-and-butter stuff. Resource allocation is honestly where everyone screws up though, spreading teams way too thin across everything. Set up clear decision points for killing or continuing projects. Oh, and actually track metrics that matter, not vanity numbers. Start with auditing what you've got now against priorities. Most companies are shocked at how disconnected their portfolio really is from strategy.
Track your revenue, margins, market share - the basics that matter. Customer acquisition costs and lifetime value are huge too since those numbers don't mess around. I'd do quarterly reviews to catch any duds early. Also think about the softer stuff - does each product actually fit where you're headed as a company? Some products look good on paper but are just... off-brand, you know? Set up a regular rhythm for reviewing everything so you can decide whether to double down, change direction, or just kill something that's not working. Customer satisfaction scores help too obviously.
Dude, market research is literally your roadmap for portfolio stuff. It shows you what to double down on, what to ditch, and when to change direction. You'll get the real scoop on what customers actually want, where competitors are slipping up, and how big these opportunities really are. Without it? You're basically gambling with your resources. The data helps you catch trends before everyone else does and spot when your current products are starting to tank. Oh, and don't just do research when launching - build it into your regular portfolio reviews. Trust me on this one.
Honestly, I'd go with something like the 70-20-10 split. Put 70% into your bread and butter products, 20% toward adjacent stuff, and 10% into wild card experiments. Set up totally separate budget buckets for each - this is crucial because when quarterly numbers get tight, innovation always gets the axe first. Do a quick audit of where your money's actually going right now. You'll probably find you're way more conservative than you think. The trick is protecting that innovation budget like it's sacred, even when your core products are screaming for more resources. Short-term pain, but you need those future bets.
Honestly, I'd focus on the basics first - revenue growth and profit margins will tell you if stuff's actually working. Market share and customer acquisition are solid for seeing how you stack up against competitors. Oh, and definitely track how efficiently you're using resources since that's where most portfolios totally fall apart. Time-to-market for new products matters too. But here's the thing - don't go overboard with metrics. Pick maybe 4 or 5 that actually align with what your business cares about. Otherwise you'll just drown in spreadsheets and lose sight of what's important.
Honestly, the outside world controls way more of your portfolio than you'd think. Market trends show you where demand's going - that's when you move money toward hot segments and dump the dying ones. Your competitors will force some brutal decisions too. Maybe you'll axe products that can't keep up or go all-in on what makes you different. Then there's economic changes, new rules, cultural shifts - all messing with what people actually want. I learned this the hard way, but regular market analysis during portfolio reviews beats relying on hunches every time.
There are a few ways to tackle this. Value vs. effort matrices work really well - just plot impact against how much work it'll take. Weighted scoring is another option where you give points based on strategic fit and ROI. MoSCoW method breaks things into Must have, Should have, Could have, Won't have (kind of cheesy name but whatever). The Kano model's solid for figuring out what actually makes customers happy. Honestly though? Start simple with the value vs. effort thing since it's visual and gets everyone on the same page fast. Pick whatever feels right for your team's vibe.
So you're basically creating a game plan for where to put your money and energy across all your products. Don't put all your eggs in one basket - spread the risk around different product lines. Map out what you've got now and figure out which ones actually make money versus the ones just bleeding resources. You'll spot gaps where competitors are winning too. Honestly, most companies have way too many products that aren't pulling their weight. Start by doing a brutal audit of everything and ranking each product's real value to the business. Kill the dead weight, double down on winners.
Honestly, tech makes portfolio management way less of a headache. Real-time dashboards show you how everything's performing at once, and the AI analytics actually help predict what might bomb or blow up. Automated reporting alone will save you like 5+ hours weekly - no joke. Your teams can share insights instantly instead of playing email tag. The optimization software is clutch for resource allocation too. Just don't try implementing everything at once (learned that the hard way). Pick a dashboard first, see how it works, then add more tools. Integration with your current systems means you won't have random data scattered everywhere.
Honestly, the hardest part is getting decent customer data - most companies are stuck with old or super shallow insights. Internal politics will drive you crazy too. Different teams protect their favorite projects like they're their babies. Leadership loves saying they're "customer-focused" but then just copies what competitors do or chases whatever sounds good to investors. Oh, and you're always juggling immediate revenue pressure against long-term market changes, which is exhausting. My advice? Set up direct customer feedback channels first. Don't try restructuring until you've got that foundation - trust me on this one.
Look, most companies watch revenue trends and profit margins over like 12-18 months before axing stuff. Missing forecasts consistently? That's a red flag. The hard part is figuring out if it's just a rough patch or actual decline - seasonal stuff can really mess with your judgment here. You don't want to get emotional about it either (easier said than done). Set performance thresholds early so you're not scrambling later. Also consider whether that underperforming product actually helps your winners somehow. Sometimes keeping the dud around makes sense if it supports your cash cows, but honestly? Most companies hang onto dead weight way too long.
Interactive dashboards are your best bet here. Bubble charts show portfolio stuff like market size vs revenue really well. I've watched so many people struggle with messy spreadsheets that just sit there collecting digital dust. Color coding should stay consistent across everything, and you'll want drill-down capabilities from big picture to individual products. Heat maps help you spot the winners and losers fast. Different stakeholders need different views though - executives want high level, product managers want details. Build one solid main view first. Then expand from there.
Yeah totally! Think of your whole portfolio like one big backlog that you're constantly reprioritizing. Ditch those annual planning marathons - quarterly sprints work way better. You can actually pivot based on what's working and what's flopping. Kill the duds fast, same as you would with crappy features. The boardroom silo thing has to go though - get your cross-functional teams involved in these decisions. Honestly, most companies are way too slow to change course. Start with shorter planning cycles and add more checkpoints where you can actually do something about underperformers instead of just watching them bleed money.
Honestly, you can't do portfolio optimization without getting everyone involved. Marketing knows what customers actually want, sales sees the competitive stuff, engineering tells you what's realistic to build. Finance? They'll bring you back to earth on costs real quick. I've watched so many "genius" strategies fall apart because nobody talked to the right people beforehand. Set up regular meetings where all departments can speak up about problems or opportunities. Otherwise you're just guessing and will probably focus on the wrong products entirely.
Set up feedback loops - surveys, user interviews, support tickets. Look for patterns in what people keep asking for. Those recurring complaints? Pure gold for deciding what to build next. I'd prioritize based on how often you hear something and the business impact. Don't just collect feedback though - actually tell customers when you've made changes based on their suggestions. It's huge for building loyalty. People will be way more honest with feedback when they see you're actually listening and acting on it.
-
Great quality slides in rapid time.
-
Top Quality presentations that are easily editable.