


Profit and loss statement powerpoint presentation


Try Before you Buy Download Free Sample Product
 Impress Your
 Audience
Editable
of Time


Compare the revenues, cogs, operating profit, and net profit of your organization using this Profit and Loss Statement PowerPoint Presentation. Focus on your company’s revenues and expenses during a particular period. Include revenue, expenses, gains, and losses in this balance sheet. Assess the capability of generating future cash flows through report of the income and expenses. Make complicated numerical data simple using this PPT slide. Help your investors and creditors determine the past and future financial performance of your enterprise with our profit and loss PPT template. Convey the simplified version of your information to the audience with this profit and loss template slide. Our designers have professionally designed this template for your convenience. Get this profit and loss sheet PPT template to generate an effective PowerPoint presentation in less time.
People who downloaded this PowerPoint presentation also viewed the following :
Content of this Powerpoint Presentation
In business, understanding and analyzing financial performance is important to success. Every decision that organizations take, from strategic planning to daily operations, is influenced by insights gleaned from financial data. Profit and Loss Statement is a cornerstone of financial reporting that provides a snapshot of an organization's revenue, expenses, and profitability over a specified period. This document serves as a barometer of financial health and also as a roadmap for informed decision-making and strategic direction.
The Profit and Loss Statement PowerPoint Presentation from SlideTeam will help you make sense of your financial information and steer your business in the direction of sustained growth and profitability.
You can perform an all-inclusive financial analysis with our PowerPoint presentation, which will help you with everything from breaking down revenue streams to finding areas where you can cut costs. Our PowerPoint Templates are 100% editable and customizable, providing you with the structure and flexibility you need to edit your presentations.
Let’s explore!
Preparing a monthly profit and loss statement can be tricky. Here’s a Premium PPT that can help simplify the process. Click here to explore.
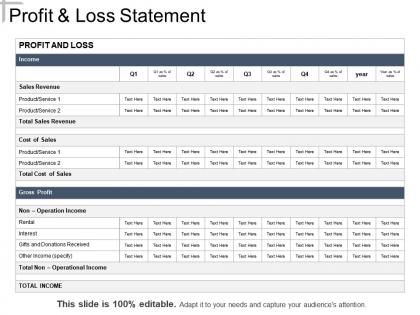
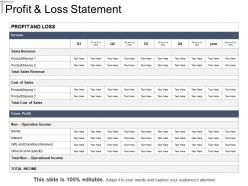
Template 1: Profit and Loss Statement PowerPoint Presentation
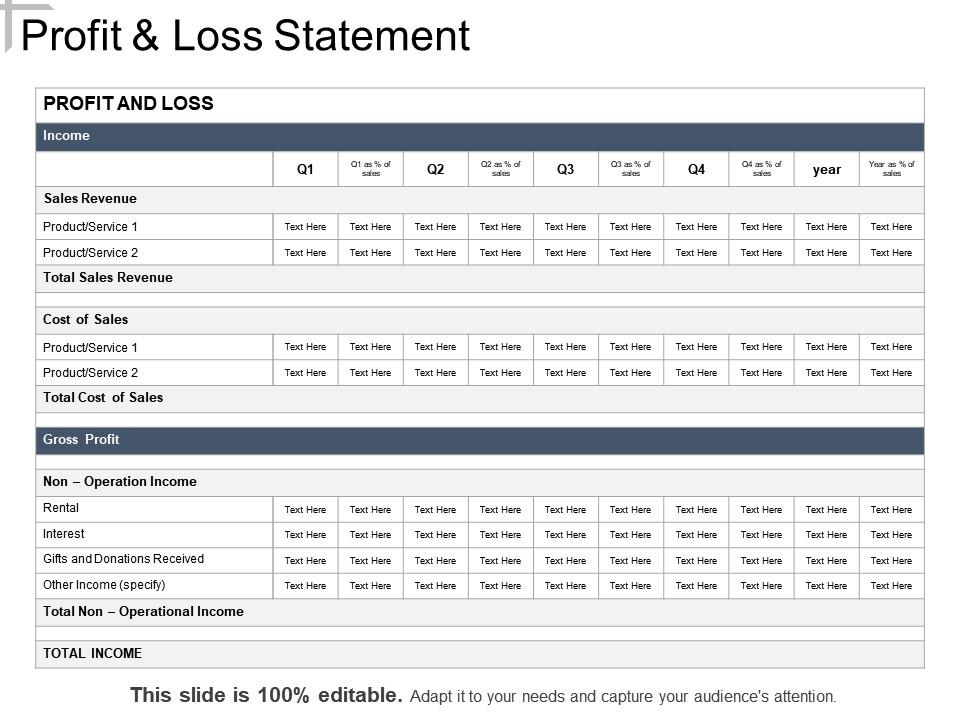
This PPT set presents a unique profit and loss statement. Unlike others, this P&L statement gives the complete picture of your accounting year, dividing your financial data into four quarters. This helps you compare when your profits were high and where your expenses shot up. The PPT slide also highlights the financial position of your organization at the end of the year. The layout of this PPT is such that you just have to input your data into relevant columns and present it to stakeholders. Download it today!
Beyond the Balance Sheet
Financial data is just numbers if you don’t know how to put it together to assess your organization’s health. But with SlideTeam's Profit and Loss Statement PowerPoint Presentation, you're not just presented with numbers; you're handed the blueprint for understanding, analyzing, and optimizing your organization's financial performance. With this tool, you can examine revenue streams, evaluate expenses, and uncover hidden opportunities for growth and efficiency. Get it today!
Profit and loss statement powerpoint presentation with all 5 slides:
Light the fuse with our Profit And Loss Statement Powerpoint Presentation. Your team will surely burst into action.


FAQs for Profit and loss
So basically, a P&L shows if you made or lost money over a set time - month, quarter, whatever. It's like your business report card honestly. Revenue comes in, expenses go out, and boom - there's your bottom line. Here's the thing though - don't just file it away when your accountant sends it! Actually look at where your money's flowing. Like, are you spending too much on office supplies? (guilty as charged). Are customers paying what you thought they would? Review it monthly if you can. Makes those big decisions way less scary when you actually know your numbers.
Look, profit is just revenue minus expenses - pretty basic math. The tricky part? You can make tons of money and still be broke if you're spending like crazy. I've seen it happen. What you really need to do is watch both numbers. Growing revenue is great, but don't slash every expense either. Sometimes you've gotta spend money on stuff like better marketing or quality improvements - it pays off later. Check your profit margins every month, honestly. That way you'll catch problems before they snowball into disasters.
So basically you've got revenue at the top - that's all your sales. Then cost of goods sold gets subtracted to give you gross profit. Operating expenses come next (salaries, rent, all that fun stuff). What's left is your net income. Interest and taxes can mess with things too, though honestly those are pretty straightforward. The whole thing flows top to bottom, showing how your money gets chipped away. I'd double-check your revenue recognition first since that's where things usually go wrong, then work down from there.
Your P&L is basically a treasure map for figuring out what's actually working. Monthly revenue patterns will show you which products are crushing it - then you can focus more energy there. The expense breakdown? That's where things get interesting (and sometimes scary). I always compare gross margins between different offerings to see what's worth my time. Honestly, the cash flow forecasting part has saved my butt more times than I can count. Don't just glance at it and file it away though. Actually dig into the numbers each month.
Gross profit = revenue minus what it actually costs to make your stuff (materials, labor, that kind of thing). Net profit is what's left after literally every expense hits - overhead, marketing, taxes, all of it. So gross profit is like your "before reality" number. Your actual bottom line? That's net profit - the cash you can pocket or put back into the business. Here's the thing though - you really need both numbers to be healthy. Gross profit shows if your product itself makes sense, but net profit tells you if the whole operation works. Always peek at both on your P&L.
Yeah, seasonal swings totally mess with your P&L if you're just staring at one month or quarter. Like your ice cream shop crushing it in July, then looking like garbage in January - but that's just how seasons work, right? Don't make big business calls based on single periods. Compare the same months year-over-year instead. Rolling 12-month views work great too. I'd map out your monthly P&Ls for the past couple years - you'll start seeing the patterns pretty quick. Way better than panicking every winter thinking you're failing when really it's just slow season doing its thing.
Okay so basically fixed costs stay the same no matter what - rent, salaries, that stuff. Variable costs move with your sales though, like materials and commissions. Here's why this matters: when you're forecasting, knowing your cost structure lets you predict what'll happen if revenue goes up or down. Your variable costs should stay around the same percentage of sales if you're doing things right. I'd track them separately because then you can see which ones to mess with when you need better margins. Makes budgeting way less of a guessing game honestly.
So when I'm checking out a P&L, I always hit three main things. Revenue growth is huge - you want to see it climbing over time, not tanking. Then I dig into the margins because honestly, what's the point of growing sales if you're bleeding money on every transaction? Gross margin shows you how efficient their actual business is. The bottom line trend matters too, but look at it over multiple quarters. Everyone has a rough patch here and there. If they're consistently losing money though, that's when you know something's seriously wrong with the business model.
So basically, you're hunting for patterns in revenue growth and where costs are getting out of hand. Year-over-year is way better than monthly stuff - less noise. Watch your gross margins like a hawk because they show if your business is actually getting stronger. The real red flags? When expenses grow faster than revenue as a percentage. That's where you'll find your problems hiding. Seasonal trends matter too, obviously. Focus on consistent patterns instead of random spikes - those one-offs will just confuse you. Oh, and don't get too caught up in every little fluctuation.
Okay so basically - P&L shows when you *earn* money vs when you actually *get* it. Like if you invoice someone in March but they don't pay until May, your P&L counts it in March but cash flow shows May. This is why profitable companies can still go broke (which honestly blew my mind when I first learned it). Your P&L might look great but if customers are slow to pay, you're screwed. I'd check both monthly. P&L tells you if you're making money, cash flow tells you if you can actually pay rent this month.
Ugh, the cash flow vs profit thing gets everyone. Don't count money you haven't actually received yet - I learned that the hard way. Also watch your expense timing and stop throwing everything into "miscellaneous" because that's just lazy accounting lol. Reconcile with your bank statements religiously. Double-counting is another trap - happened to my brother last year and it was a mess. Honestly? Go through everything twice, then get fresh eyes on the big numbers. Makes such a difference when someone else spots what you missed.
Benchmarks basically turn your P&L into a competitive scorecard instead of just your own little bubble. Like, if your gross margin is 15% but everyone else is hitting 25%, that's a problem worth knowing about. Same with operating costs - maybe you're spending way more than similar companies without realizing it. Honestly, looking at your numbers in isolation is pretty useless. You need context to know if you're actually doing well or just telling yourself you are. IBISWorld has decent industry data, or check your trade association if you're in one. Just throw together a quick comparison chart and you'll spot the trouble areas fast.
EBITDA basically strips out all the accounting BS - depreciation, interest, taxes, amortization - so you can see how your actual business operations are doing. Way cleaner picture than your regular P&L. It's great for comparing yourself to other companies since everyone has different debt structures and tax situations. Investors eat this stuff up because it shows your cash-generating power without all the financial engineering. I probably look at it weekly now. Just don't use it as your only metric - you still need the full P&L to see the complete story.
Honestly, charts are a game-changer for P&L statements. Nobody wants to stare at endless rows of numbers. Bar charts let you compare revenue vs expenses super easily. Line graphs? Perfect for spotting those seasonal dips or growth spurts you'd totally miss otherwise. I'm obsessed with pie charts for expenses – you'll probably be shocked when you see how much marketing actually costs! It's wild how fast people "get it" when they can see the story visually instead of squinting at spreadsheets. Just throw together 2-3 simple charts for your next meeting and watch everyone actually pay attention.
Honestly, start with cash flow - profit means nothing if you're broke, lol. Balance sheet stuff like debt ratios and current ratios show the real picture. Gross margins, customer acquisition costs, and working capital changes are super telling too. If you're subscription-based, definitely track revenue per customer and churn rates. Way more useful than just staring at your P&L all day. Pick maybe 3 or 4 metrics that actually fit your business and check them monthly. Don't go overboard though - I've seen people drown in spreadsheets trying to track everything.
-
Great quality product.
-
Professional and unique presentations.