

Profit And Loss Dashboard Indicating OPEX And EBIT




Try Before you Buy Download Free Sample Product
 Impress Your
 Audience
 100%
100% Editable
 Save Hours
 of Time


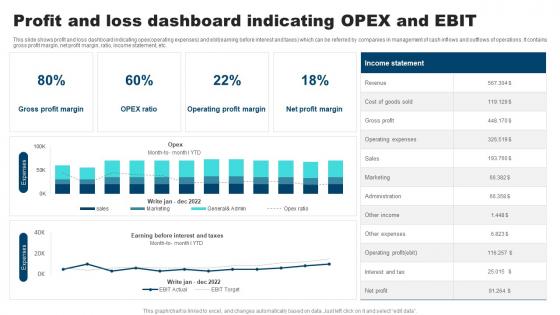
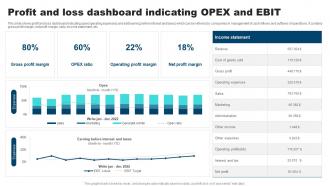
This slide shows profit and loss dashboard indicating opex operating expenses and ebit earning before interest and taxes which can be referred by companies in management of cash inflows and outflows of operations. It contains gross profit margin, net profit margin, ratio, income statement, etc.
People who downloaded this PowerPoint presentation also viewed the following :
Profit And Loss Dashboard Indicating OPEX And EBIT with all 7 slides:
Use our Profit And Loss Dashboard Indicating OPEX And EBIT to effectively help you save your valuable time. They are readymade to fit into any presentation structure.





FAQs for Profit And Loss Dashboard Indicating
Track your gross, operating, and net profit margins first - those are the big three. Gross shows if you're making money on each sale, operating tells you if expenses are killing you, and net is your actual bottom line. ROI matters too, obviously. EBITDA is honestly pretty clutch for comparing different months or quarters since it cuts through the accounting noise. Oh, and don't sleep on revenue per customer and lifetime value - those help you figure out if you're actually building something sustainable or just spinning your wheels.
So gross profit margin is basically revenue minus what it actually costs to make your stuff - shows how efficient your production is. Net margin? That's the real deal. It includes EVERYTHING - your rent, marketing budget, salaries, all that overhead nonsense. I always think of gross as "are we good at making things" and net as "can we actually run a profitable business." Honestly, I've seen companies with amazing gross margins that still tank because their expenses are out of control. You need both numbers. Gross helps with pricing decisions, but net tells you if you're gonna survive long-term.
Dude, think of profitability metrics as your business GPS - without them you're basically driving around lost. They show you which products actually make money vs. the ones just draining your bank account. Super helpful for deciding where to throw more cash or what to axe completely. You want to track stuff like gross margin, net profit margin, ROI - the usual suspects. Honestly, I've seen too many people make huge decisions based on gut feelings alone (never ends well). These numbers let you spot problems early and back up your choices with real data when you're pitching ideas to investors or your boss.
So ROE shows how well you're turning shareholder money into actual profits. Just divide net income by shareholders' equity - pretty straightforward math. Higher numbers are usually good, but don't look at it alone because companies can juice their ROE by taking on crazy amounts of debt. Most decent companies hit around 15-20%, though tech companies always seem to break those rules. I check mine quarterly against last year's numbers and competitors. Quick tangent - my old boss was obsessed with ROE but ignored cash flow, which was... not smart. Anyway, it's solid for seeing if you're actually creating value or just spinning your wheels.
ROA shows how well you're turning assets into profit - pretty solid for comparing companies in the same sector since size doesn't matter as much. But honestly? Don't rely on it alone. It gets weird when you compare different industries - like, tech companies vs manufacturers need totally different assets. Plus it ignores how those assets are financed, which matters. Book values can be off too because of depreciation stuff. I always look at ROE alongside it. Gives you a better sense of what's actually happening with profitability instead of just one angle.
Honestly, comparing your numbers to industry benchmarks is a total game-changer. You might think you're crushing it when really your margins suck compared to everyone else. Or the opposite - you're stressing about profits when you're actually doing better than most competitors. Check your gross margin, net profit, and ROA against similar companies. Trade associations usually have decent reports, or IBISWorld works too (though it can be pricey). It's basically a reality check that shows where you need to fix things and whether your pricing makes sense. Trust me, the insights are worth it.
Yeah so basically when operating expenses go up, your profit margins get squeezed - revenue minus expenses equals less money in your pocket. It hits everything downstream too: EBITDA, net margins, ROA, the whole chain. But here's what matters more - if those expenses are actually driving revenue growth faster than they're costing you, then whatever. Don't freak out over one bad quarter. What I'd actually track is whether revenue is outpacing expense growth over time. That ratio tells you if you're winning or just burning cash. Way more useful than staring at individual line items honestly.
Honestly, the worst thing you can do is fixate on one metric. Like you'll see killer gross margins and totally miss that your operational costs are through the roof. Companies love comparing themselves to industry benchmarks too, which is kinda pointless - why would a SaaS business stack up against retail margins? Makes no sense. Month-to-month swings will drive you crazy if you let them. Focus on longer trends instead. I always tell people to track several metrics together over like 6+ months. That's where you'll actually spot what matters.
Look at your gross profit margin, net profit margin, and return on assets every month - those three will tell you if you're actually making money or just chasing vanity metrics. Gross margin shows whether your pricing makes sense. Net margin is your real bottom line after everything. ROA matters because honestly, most small businesses are terrible at using their assets efficiently. Don't just stare at the numbers though - compare them to industry standards and your own past performance. Otherwise you're flying blind. Set up some basic dashboard to track these monthly so you don't forget.
So contribution margin is basically how much cash each product throws off after you cover the direct costs to make it. Think of it as your "profit punch" per item. Here's the thing though - your biggest revenue makers aren't always your best margin winners, which honestly surprised me when I first learned this stuff. You'll want to compare margins across products to see who's actually carrying their weight. Push the high-margin stuff harder in sales. Low performers? Maybe tweak pricing or find ways to cut costs. When you're deciding where to spend time and resources, go with the margin winners.
Yeah, external stuff can totally wreck your profit numbers in sneaky ways. When the economy tanks, customers get picky about prices and stop buying as much. Meanwhile inflation jacks up your costs way faster than you can raise prices - it's honestly brutal timing. Interest rates mess with both your financing costs and whether customers can afford your stuff. Then you've got random things like supply chain disasters or new regulations that can destroy your margins literally overnight. I always tell people to track this external chaos separately from how your actual operations are doing, so you know what you can actually control vs. what's just happening to you.
Honestly, QuickBooks or Xero are probably your best bet to start - they handle basic profit tracking pretty well. If you need fancier dashboards later, Tableau and Power BI are solid choices. There's also high-end stuff like Adaptive Insights, but that's probably way more than you need (and expensive as hell). You know what though? Don't sleep on Excel or Google Sheets. Set up some decent templates and you're golden. My advice? Start with whatever accounting software you've got, then upgrade if things get complicated. No point overcomplicating it from day one.
Honestly, start with gross profit margin - that's your best friend here. If it's tanking, you've got a direct cost problem (materials, labor, whatever). Operating margin will tell you if overhead's killing you, and net margin gives you the brutal truth including debt payments and all that fun stuff. I usually tackle gross margin first since it's way easier to fix than the other messy stuff. Compare these numbers across different time periods or product lines. You'll start seeing patterns real quick. Then just dig into whichever area looks the worst and figure out what's jacking up those costs.
So basically, profit tells you if you're making money on paper. Cash flow? That's whether you actually have money sitting in your account right now. Super confusing at first - I remember being like "wait, what?" You can totally be profitable but broke if customers haven't paid their invoices yet. Or you might have cash coming in but still be unprofitable overall. Weird, right? Both matter though. Profitability shows how healthy your business really is. Cash flow keeps the lights on day-to-day. Don't just look at one - you need both to get the real story.
Industries are just wildly different when it comes to profit margins. Tech companies can hit 80%+ gross margins while grocery stores are happy with 3% - both might be doing amazing though. Manufacturing needs tons of upfront cash for equipment, so their returns look nothing like a consulting firm that's basically just selling smart people's time. Software's weird because you spend a fortune building it initially, then each new customer costs almost nothing to serve. Oh, and always compare yourself to similar businesses in your space. Like, measuring your restaurant against Apple's numbers? That's gonna be completely pointless for making any real decisions.
-
The information is visually stunning and easy to understand, making it perfect for any business person. So I would highly recommend you purchase this PPT design now!
-
The designs are very attractive and easy to edit. Looking forward to downloading more of your PowerPoint Presentations.