

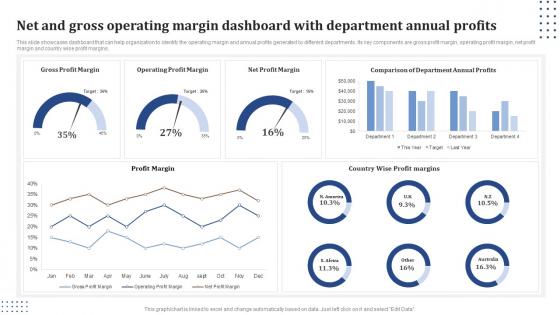
Net And Gross Operating Margin Dashboard With Department Annual Profits




Try Before you Buy Download Free Sample Product
 Impress Your
 Audience
 100%
100% Editable
 Save Hours
 of Time


This slide showcases dashboard that can help organization to identify the operating margin and annual profits generated by different departments. Its key components are gross profit margin, operating profit margin, net profit margin and country wise profit margins.
People who downloaded this PowerPoint presentation also viewed the following :
Net And Gross Operating Margin Dashboard With Department Annual Profits with all 7 slides:
Use our Net And Gross Operating Margin Dashboard With Department Annual Profits to effectively help you save your valuable time. They are readymade to fit into any presentation structure.






FAQs for Net And Gross Operating Margin Dashboard With
Key metrics for an Operating Margin Dashboard include operating margin percentage, gross profit margin, EBITDA, revenue trends, cost of goods sold ratios, operating expenses breakdown, and year-over-year comparisons. These metrics enable organizations to streamline financial analysis, enhance operational efficiency, and identify cost reduction opportunities, with many companies finding that comprehensive dashboards deliver faster decision-making and improved profitability tracking.
Visualizations enhance operating margin understanding by transforming complex financial data into clear charts, graphs, and trend analyses that reveal patterns, seasonal fluctuations, and performance drivers instantly. Through interactive dashboards, financial teams can identify margin compression risks, benchmark against industry standards, and communicate insights to stakeholders more effectively, ultimately enabling faster strategic decisions and improved profitability management.
Challenges include varying cost classification standards, inconsistent expense categorization between direct and indirect costs, industry-specific accounting practices, seasonal revenue fluctuations, and complex allocation methodologies. Manufacturing companies face different margin calculation complexities than service-based businesses like consulting or healthcare providers, with many organizations finding that standardized dashboard templates require significant customization to deliver accurate, industry-relevant financial insights.
Operating margin sits between gross margin and net profit margin, representing operational efficiency after deducting operating expenses but before interest and taxes. While gross margin only considers direct costs, and net profit margin includes all expenses, operating margin specifically measures how well management controls operational costs, with many retail and manufacturing companies finding that strong operating margins indicate effective resource allocation, streamlined processes, and competitive positioning in their markets.
Operating margins serve as a critical indicator of operational efficiency by measuring how effectively a company converts revenue into profit after covering operating expenses, labor costs, and overhead. This metric enables management to identify cost control opportunities, benchmark against industry standards, and optimize resource allocation, with many financial analysts and investors finding that consistent operating margin improvements signal strong operational management and sustainable competitive advantage.
Essential data sources for comprehensive Operating Margin Dashboards include financial systems, ERP platforms, sales databases, cost accounting modules, and inventory management systems. These integrated sources enable organizations to track revenue streams, operational expenses, and margin fluctuations in real-time, with many companies finding that unified data visibility streamlines decision-making and enhances profitability analysis.
Operating margin trends assist financial forecasting by revealing operational efficiency patterns, seasonal variations, cost structure changes, and performance trajectory over time. These insights enable finance teams to project future profitability scenarios, identify potential risk factors, and make strategic budget allocations, with many organizations finding that consistent margin analysis significantly enhances their forecasting accuracy and strategic planning capabilities.
Industries like software, pharmaceuticals, and financial services typically exhibit higher operating margins due to lower variable costs, scalable business models, and high barriers to entry. Manufacturing, retail, and hospitality sectors generally show lower margins because of significant operational overhead, inventory costs, and competitive pricing pressures, with many organizations finding that strategic automation and efficiency initiatives can help bridge these gaps.
Businesses can improve operating margins by reducing operational costs, increasing pricing strategically, enhancing productivity through automation, streamlining supply chain processes, and optimizing resource allocation. Through data-driven decision making and performance monitoring, organizations across manufacturing, retail, and service sectors achieve sustainable margin improvements, ultimately delivering enhanced profitability and competitive advantage in increasingly competitive markets.
Fluctuating operating margins can significantly impact investor confidence by signaling operational instability, inconsistent management execution, and unpredictable profitability patterns that make financial forecasting challenging. While occasional fluctuations are normal, persistent volatility often raises concerns about competitive positioning and strategic direction, with many institutional investors finding that consistent margin trends demonstrate stronger operational control and sustainable business models, ultimately affecting valuation multiples and investment attractiveness.
Seasonality significantly impacts operating margins through fluctuating demand patterns, variable cost structures, and seasonal workforce adjustments that create revenue peaks and valleys throughout the year. Retail businesses experience higher margins during holiday seasons, while hospitality and tourism companies face margin compression during off-peak periods, ultimately requiring strategic inventory management and flexible operational planning to maintain profitability.
Companies should benchmark operating margin performance against industry averages, direct competitors, their own historical trends, and top-quartile performers within their sector. Financial databases like Bloomberg and S&P provide industry-specific benchmarks, while internal year-over-year comparisons reveal operational efficiency trends, with many organizations finding that combining external industry standards with internal performance targets delivers the most comprehensive evaluation framework for strategic decision-making.
An Operating Margin Dashboard helps operational decision-making by providing real-time visibility into profitability trends, cost structure analysis, and performance benchmarks across departments or product lines. Through automated data visualization, managers can quickly identify underperforming areas, optimize resource allocation, and implement corrective measures, ultimately enabling faster strategic responses and improved operational efficiency.
**INPUT**: What tools and software are best suited for creating an Effective Operating Margin Dashboard? **OUTPUT**: Effective operating margin dashboards leverage tools like Tableau, Power BI, Qlik Sense, Excel with Power Query, and specialized platforms like Looker or Sisense. These technologies streamline financial data visualization by automating calculations, integrating multiple data sources, and delivering real-time insights, with many finance teams finding that comprehensive dashboards enhance strategic decision-making and operational transparency. **Word count: 56 words**
**INPUT**: How can a company use its operating margin to optimize pricing strategies? **OUTPUT**: Companies leverage operating margin data to identify optimal price points by analyzing profit relationships across product lines, customer segments, and market conditions. Through margin analytics, businesses can strategically increase prices on high-margin offerings, adjust pricing for underperforming products, and implement dynamic pricing models, ultimately delivering enhanced profitability while maintaining competitive positioning in increasingly demanding markets.
-
A fantastic collection of templates. I'll likely use this as my go-to resource for future templates and support.
-
“Ample and amazing variety of templates available, really helpful for making professional PPT for day to day workings.”