


Business Revenue Bar Graph With OPEX Details




Try Before you Buy Download Free Sample Product
 Impress Your
 Audience
 100%
100% Editable
 Save Hours
 of Time


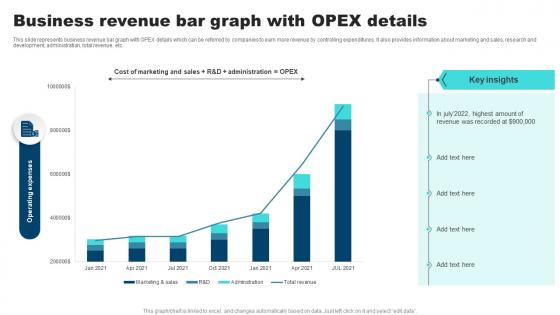
This slide represents business revenue bar graph with OPEX details which can be referred by companies to earn more revenue by controlling expenditures. It also provides information about marketing and sales, research and development, administration, total revenue, etc.
People who downloaded this PowerPoint presentation also viewed the following :
Business Revenue Bar Graph With OPEX Details with all 7 slides:
Use our Business Revenue Bar Graph With OPEX Details to effectively help you save your valuable time. They are readymade to fit into any presentation structure.





FAQs for Business Revenue Bar Graph
Track your total revenue and growth rate first - those are non-negotiable. Average revenue per customer matters too. If you've got subscriptions, monthly recurring revenue is huge. The real game-changer though? Customer acquisition cost vs lifetime value. That ratio will literally make or break your decisions. Also break things down by product, region, and sales channel so you can see what's actually working. Oh, and seriously - set up an automated dashboard. Trust me on this one. Pulling all this data manually every month is a special kind of torture you don't want.
Start with your last 2-3 years of revenue data - look for seasonal patterns and growth trends. Don't just check totals though, break it down by product lines or customer segments. Way more useful that way. Think about any big changes coming up too: new launches, market shifts, economic stuff that might mess with your numbers. Oh, and definitely create multiple scenarios - conservative, realistic, optimistic. Honestly, anyone who just does one forecast is setting themselves up for disappointment. Set quarterly check-ins so you can tweak things as real data rolls in.
So here's the deal with customer segmentation - it shows you who's actually making you money versus who's just sitting there in your CRM doing nothing. Break your revenue down by different groups, like high-spenders vs bargain hunters, or by location, industry, whatever fits. You'll see patterns that get totally buried when you look at everything together. That whole 80/20 thing is real - usually a small chunk of customers drives most of your cash. Some segments are just worth way more long-term too. Once you know this stuff, you can focus your energy on the profitable ones and maybe figure out how to get the cheapskates to spend more.
External stuff really screws with revenue more than people realize. When the economy tanks, customers just stop buying - hits you right in the sales. Inflation's brutal too because your costs go up but you can't always raise prices. Interest rates mess with everything from how much people can spend to what your loans cost. Oh, and currency swings are a nightmare if you're selling overseas (found that out the hard way recently). Supply chain issues pop up out of nowhere. Regulatory changes too. Honestly, you've gotta watch these indicators alongside your regular metrics so you can adjust forecasts before getting blindsided.
Honestly, the biggest mistake is just staring at revenue numbers without checking what it actually cost to get there. Seasonality will mess with your head too if you're not careful. Don't lump everything together either - some channels make bank while others barely break even. I've seen so many people cherry-pick random time periods to make things look rosier than they are (super annoying). Focus on the quality behind those numbers. Sure, revenue might be climbing, but are customers actually sticking around? Is each order getting smaller? That stuff matters way more than you'd think.
So here's the thing - those advanced analytics tools are game changers for revenue analysis. They catch patterns in huge datasets that you'd never spot manually. Seasonal trends, customer segments, revenue drivers - all that stuff becomes way clearer. No more spreadsheet typos screwing up your quarterly numbers either (been there!). The predictive modeling is honestly where they shine though - you can forecast revenue with actual confidence instead of just guessing. I'd start with Tableau or Power BI if you're new to this. They're pretty intuitive but still powerful enough to make your decision-making way sharper.
Look, start with industry reports - IBISWorld or whatever trade group you're in. Those give you decent baseline numbers. S&P Capital IQ is amazing but costs a fortune unless you're bigger. I'd just pull public competitors' financials and crunch revenue per employee, growth rates, that stuff. Pick 3-4 companies your size and track the same metrics every quarter. Social media sometimes has random useful data too, surprisingly. Make it routine or you'll forget. The whole point is having real comparisons instead of just guessing how you're doing.
Yeah, seasonality can really mess with your revenue numbers if you're not paying attention. You'll think your business is tanking when it's just the usual slow period, or get way too hyped about growth that's basically just your busy season kicking in. Think retail crushing it in Q4 or tax software going crazy in spring - totally predictable stuff. The hard part is figuring out what's actually a real trend versus just normal seasonal ups and downs. Year-over-year comparisons are your friend here, way better than comparing month to month. Oh, and definitely adjust your forecasts for seasonality - makes everything clearer.
Ditch the last-click attribution thing - it's pretty much garbage these days. You'll want to track how all your touchpoints work together instead. Social, email, search, whatever you're running. Try different models like first-touch or time-decay to see the full picture. Yeah, it gets weird when people hop between their phone and laptop, but at least you're not guessing anymore. Oh, and seriously - get your UTM parameters consistent across everything first. That's like step zero before any of this stuff makes sense.
So recurring revenue is like having a steady paycheck instead of just doing gig work, you know? Makes planning SO much easier when you can actually predict what's coming in each month. Sure, one-time sales give you those nice little dopamine hits, but they're stressful as hell for forecasting. Investors eat this stuff up too - they'd rather see consistent monthly revenue than wild ups and downs. Quick tip: track your recurring revenue ratio. If you're under 70%, maybe look into subscriptions or retainer contracts? Game changer for stability.
Dude, first thing - map out your whole revenue cycle and hunt for gaps where cash is leaking out. Billing mistakes, pricing too low, crappy collections, customers bailing when they shouldn't. Most companies are blown away by what they discover once they actually look into this mess. I'd start with your biggest revenue streams since that's where you'll find the juiciest leaks to fix. Set up regular check-ups on your pricing and billing stuff, plus track things like how long it takes to collect payments and revenue per customer. Oh, and definitely watch your churn patterns - that one's huge.
CLV analysis is seriously useful for figuring out which customers are worth your time and money. You can spot your most profitable segments and predict future revenue pretty accurately. Plus it shows you exactly how much to spend on getting new customers vs keeping current ones. I've seen companies completely change their approach once they dig into this data - it's wild how much you learn about customer behavior patterns. Short answer: focus your energy on high-value customers and stop throwing money at segments that'll never pay off. Makes budgeting way less of a guessing game too.
Pricing is tricky but it's literally how you control your revenue and margins. Go too low and sure, you'll sell more stuff, but you're basically throwing money away on each sale. Too high? Great margins but nobody's buying. I've seen people obsess over this for months honestly. The trick is finding that middle ground based on what your competitors are doing and how much people actually value what you're selling. Try different price points and see what happens to your total revenue versus profit per sale. Sometimes the data surprises you.
Think of competitive analysis like your revenue roadmap - it shows you where the real market opportunities are hiding. You'll spot gaps where competitors are totally missing the mark with customers. Plus you can see which revenue streams actually work for similar companies and avoid pricing yourself into a corner. Honestly, it's pretty satisfying to dig into everyone else's mistakes too. Look at both their wins and epic fails to shape your own pricing and positioning. I'd say set up reviews every quarter or so to keep your strategy fresh - the market moves fast and you don't want to get left behind.
Dude, line charts are perfect for showing revenue over time - trends pop right out. For comparing products or regions? Bar charts all the way. I swear, half the people I know just throw numbers in Excel and can't figure out why their boss glazes over during presentations lol. Interactive dashboards are clutch because people can click around and explore the data themselves. Don't go crazy with every single metric though. Pick one solid chart that actually answers their question first, then build from there if needed.
-
“I always have a wonderful experience with SlideTeam. It's my ""go to"" when I need a template.”
-
The best and engaging collection of PPTs I’ve seen so far. Great work!