

OPEX Dashboard Indicating Revenue And Costs Metrics





Try Before you Buy Download Free Sample Product
 Impress Your
Audience
 100%
Editable
 Save Hours
of Time


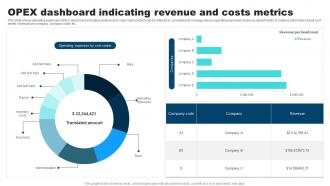
This slide shows operating expenses OPEX dashboard indicating revenue and costs metrics which can be referred by companies to manage various operating expenses of various departments. It contains information about cost center, revenue per company, company code, etc.
People who downloaded this PowerPoint presentation also viewed the following :
OPEX Dashboard Indicating Revenue And Costs Metrics with all 7 slides:
Use our OPEX Dashboard Indicating Revenue And Costs Metrics to effectively help you save your valuable time. They are readymade to fit into any presentation structure.





FAQs for OPEX Dashboard Indicating Revenue
Focus on these five things for your OPEX dashboard. Real-time expense tracking by category - labor, materials, utilities, all that stuff. Budget vs actual comparisons are huge so you catch variances fast. Trend analysis over time is honestly where most people find their biggest surprises. KPIs like cost per unit that actually connect to what you're trying to accomplish operationally. And drill-down features so you don't have to jump between a million different systems when something looks weird. Keep it visual too - nobody's making quick decisions from spreadsheet hell.
Honestly, real-time data integration is a game changer for OPEX dashboards. You're not stuck looking at yesterday's numbers anymore - you see cost changes and resource issues as they're actually happening. Think of it like getting instant bank alerts vs checking your balance monthly, you know? Spot cost overruns before they blow up your budget. Fix operational problems while they're still small. The trick is figuring out which metrics in your business change the fastest (for us it was always server costs, weirdly) and get those hooked up to live feeds first. Way better than playing catch-up with static reports.
Four main buckets for your OPEX dashboard: quality stuff (defect rates, complaints), efficiency (cycle times, throughput), cost metrics (waste reduction, productivity), and safety (incidents, near misses). Pick maybe 2-3 from each that your team actually gets - I swear half the dashboards I see are just digital wallpaper because nobody acts on the data. Start with metrics people already trust instead of jumping straight to fancy ones. Oh, and make sure you can actually do something about what you're tracking. Pretty charts are useless if they don't drive real decisions.
Honestly, visualizations are a lifesaver for OPEX data. Your spreadsheets just confuse everyone, but charts? People get it immediately. Finance can see budget impacts, ops teams spot what's driving costs up, and execs get their bird's-eye view - all from one dashboard. Those cross-functional meetings where everyone's staring at different numbers? Yeah, that nightmare ends. The trick is figuring out what each group actually cares about first. Then build your visuals around that. Trust me, it's way better than sending around Excel files that nobody opens anyway.
Dude, an OPEX dashboard is a game changer. Instead of waiting around for those boring monthly reports, you get live updates on what's actually happening. Costs going crazy somewhere? You'll catch it right away. Same with bottlenecks slowing things down. The visual setup makes spotting patterns way easier than staring at spreadsheets all day. Plus when you roll out improvements, you can watch them work in real-time - keeps the team pumped. Oh, and definitely set up alerts for your most critical stuff so nothing sneaks past you.
Honestly, if your team can't figure out the dashboard easily, they just won't use it - and then you're screwed on cost optimization. Make the navigation super intuitive and put the important KPIs right where people expect them. Different roles need different views, so build in some customization. I've watched so many dashboards bomb because they looked slick in presentations but were absolute torture for daily use. Quick drill-downs are crucial too. When costs are spiraling, nobody's got time to click through five screens to find basic info. Keep it simple enough that spotting trends and taking action feels natural.
Dude, automation is a game changer for this stuff. No more copying numbers from spreadsheets - we both know that never ends well lol. Your dashboard just pulls straight from your ERP and procurement systems automatically. Typos disappear. Version control nightmares? Gone. Everything stays in sync across departments instead of having finance show different numbers than operations (so awkward in meetings). The best part is setting up those validation rules that catch weird outliers before they screw up your whole dashboard. Honestly wish I'd done this years ago instead of manually updating everything like an idiot.
Manufacturing and healthcare companies crush it with OPEX dashboards - like, seriously impressive results. Real-time visibility into equipment costs and labor efficiency is huge when margins are tight. Energy and logistics aren't far behind since they're always dealing with costs that bounce around. My old boss swore by them in manufacturing. Any complex operation benefits, but those industries hit ROI in months, not years. Start with your biggest cost drains - that's where you'll see payoff fastest. Pretty much a no-brainer if you've got the operational headaches to match.
Honestly, the worst thing you can do is throw every metric you can think of onto one screen. Information overload much? Teams also get caught up debating which KPIs to use for literally months instead of just picking the obvious ones and starting. I've seen so many dashboards that look amazing but nobody actually uses them to make decisions - they're basically expensive wallpaper. Vanity metrics are another trap. Pick 3-5 things that actually move the needle on your operational costs. You can always add more later, but start simple or you'll never launch the thing.
So first thing - ask your team what they actually need to see, then build around that. Most platforms let you drag widgets around and swap chart types pretty easily. Honestly, half the dashboards I've seen track stuff nobody cares about. Set up different views for different people - finance wants all the nitty-gritty budget details while execs just want the big picture trends. You can adjust KPIs, time periods, department filters, whatever matches your priorities. Don't forget custom alerts for spending thresholds too. Really comes down to what decisions people need to make with the data.
Power BI or Tableau are your best bets for OPEX dashboards. Both handle financial data really well. Excel works if you're on a tight budget, but you'll probably outgrow it fast when pulling from multiple sources. Power BI plays nice with most ERP systems. Tableau's got better advanced analytics though - depends what you need. Auto-refresh is clutch with both so you're not constantly updating manually. I'd go Power BI first since it's cheaper and finance teams usually approve it easier. My buddy at work swears by it for their monthly reports.
Dude, historical data totally changes the game with OPEX dashboards. You'll start catching seasonal patterns and cost trends way before they bite you. Like instead of panicking over spending $50K this month, you'll actually know if that's normal or if something's off. The early warning stuff is honestly the best part - you can see budget issues coming instead of getting blindsided. I'd set up at least 12-24 months of comparison data so you're not just guessing. Makes such a difference when you can actually back up decisions with real trends instead of just hoping for the best.
Get your team leads on board first - they're your secret weapon for getting everyone else to actually use it. The data has to solve real problems your teams deal with every day, not just pretty charts for the C-suite. Formal training is fine, but honestly? Find a couple tech-savvy people who can become your go-to helpers. Way more effective. Build it into regular meetings so people can't ignore it. Oh, and listen to feedback - nothing kills adoption faster than feeling like you're shouting into the void. Keep tweaking based on what people actually tell you.
Honestly, those OPEX dashboards are clutch for catching where your money's actually disappearing. Check your top 3 cost drivers every month - that's where the real damage happens. The breakdown by category saves you from just panicking at huge totals, which I've definitely done before. Real-time data's great for spotting issues early, like maintenance costs slowly creeping up or some department going crazy with spending. Use those patterns to shift resources around and nail your forecasts better. It's way easier to adjust your strategy when you can see exactly what's burning through your budget versus what you originally planned.
Monthly check-ins work great for most teams. Automate your data pulls when you can - seriously, one screwed up manual update will haunt you forever. Only track metrics that actually matter for decisions, not just cool-looking stuff. Set up alerts for big changes so you're not babysitting dashboards all day. Oh, and ask your users what they actually find useful. Half the fancy charts we think are brilliant just confuse people. Start with auditing what data flows you have now - that alone will probably reveal some mess you forgot about.
-
Excellent products for quick understanding.
-
Presentation Design is very nice, good work with the content as well.