


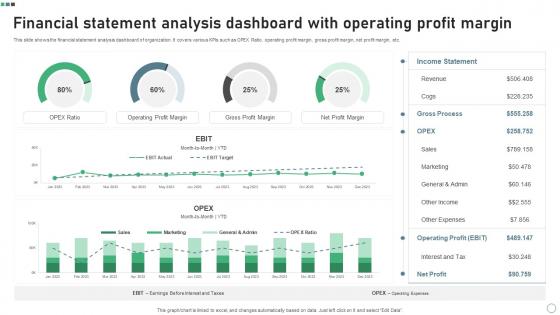
Financial Statement Analysis Dashboard With Operating Profit Margin




Try Before you Buy Download Free Sample Product
 Impress Your
 Audience
 100%
100% Editable
 Save Hours
 of Time


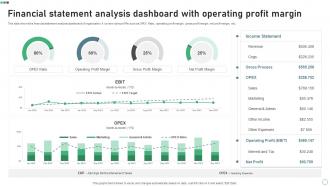
This slide shows the financial statement analysis dashboard of organization. It covers various KPIs such as OPEX Ratio, operating profit margin, gross profit margin, net profit margin, etc.
People who downloaded this PowerPoint presentation also viewed the following :
Financial Statement Analysis Dashboard With Operating Profit Margin with all 7 slides:
Use our Financial Statement Analysis Dashboard With Operating Profit Margin to effectively help you save your valuable time. They are readymade to fit into any presentation structure.






FAQs for Financial Statement Analysis Dashboard With
So there's four key things to look at. Income statement first - shows revenue trends and profit margins. Balance sheet tells you about debt and what assets they actually have. Cash flow from operations is honestly where the magic happens because it cuts through all the accounting BS. Oh and the equity statement too, though that one's pretty straightforward. Here's the thing though - don't look at these separately. They're way more useful when you read them together since each one shows a different piece of the puzzle. That's how you'll actually spot if something's off.
Think of ratio analysis as giving a company a financial physical. Raw numbers don't mean much by themselves, but ratios? They tell the real story. Can they pay their bills (liquidity)? Actually turning a profit (profitability)? Drowning in debt? Running efficiently? Here's the thing - one ratio alone is pretty useless. You've gotta compare them to industry standards or watch how they change over time. I'd stick to maybe 2-3 ratios from each main category instead of going crazy with every metric out there. Watch for sketchy trends like profit margins dropping or debt piling up.
Dude, cash flow statements are like the lie detector test for companies. A business can look super profitable on paper but actually be hemorrhaging cash - happens more than you'd think. They split everything into operating, investing, and financing so you can tell if they're making real money from their actual business or just moving funds around. Honestly, I check these before anything else because cash pays the bills, not "accounting profits." Focus on operating cash flow first. If that number's consistently in the red, something's off no matter how pretty the other statements look.
Looking at financial trends is honestly your best bet for spotting what direction a company's headed. Revenue growth, profit margins getting better, debt going down - these patterns usually keep going. Sure, past stuff doesn't guarantee anything, but it beats guessing randomly! I'd check out 3-5 years of data so you can tell if it's real progress or just lucky timing. Don't get obsessed with one metric though - that's where people mess up. Plot revenue, profits, and cash flow on a basic chart. Multiple data points tell the actual story.
Dude, financial statements have some real blind spots. You're looking at old data - like driving while staring at your rearview mirror, which is pretty useless for what's coming next. Different companies use totally different accounting tricks, so comparing them gets weird fast. Management quality? Market drama? Competitive threats breathing down their necks? Yeah, none of that shows up in the numbers. Plus some companies get... creative with their books, if you know what I mean. Honestly, I'd never make decisions based solely on these statements. They're helpful but definitely not the full story you need.
So vertical analysis is basically turning everything into percentages - like showing all your income statement stuff as a % of revenue, or balance sheet items as a % of total assets. Makes it way easier to see what's actually eating up your money instead of just staring at random dollar amounts. You can compare different quarters or even stack yourself against competitors since it's all normalized. Honestly, raw numbers are pretty useless on their own. Run it on your last few quarters and you'll spot trends in costs or where your assets are sitting that you totally missed before. Super quick way to see the big picture.
Horizontal analysis shows percentage changes in your financial data over time - way easier to spot trends than just looking at raw numbers. Grab like 3-5 years of data and calculate year-over-year changes for your main stuff. You'll catch things like revenue growth speeding up or slowing down, expenses climbing faster than sales, weird cash flow shifts. Honestly, I always start with the biggest swings since that's where the real story usually is. It's like watching your business on a timeline instead of just random snapshots. Super helpful for seeing patterns you'd totally miss otherwise.
Look at gross profit margin, operating margin, and net profit margin first - they'll show you how well a company turns revenue into actual profit. ROE and ROA are huge for seeing if management knows what they're doing with equity and assets. Don't sleep on current ratio and asset turnover either. Quick ratio's great for liquidity too, though honestly most people skip it. These ratios will help you spot patterns when you're comparing quarters or checking out competitors. Oh, and asset turnover's probably my favorite - it's weirdly telling about efficiency.
So basically, these ratios show how much debt a company has compared to their equity or assets. Higher numbers = riskier investment. You'll want to check stuff like debt-to-equity ratios to see if they're borrowing too aggressively. Think of it like maxed-out credit cards - major red flag! Companies with tons of debt struggle when times get tough since they're stuck making huge interest payments. Compare their numbers to industry averages first. Also watch for any climbing trends over time. That's usually when I start getting nervous about a stock.
Your financial ratios don't mean much without industry benchmarks to compare them against. A 15% profit margin might sound decent, but it's garbage in software and pretty solid in retail. Different industries just work completely differently - their capital needs, how they operate, what margins they expect. I usually check IBISWorld or grab data from industry associations first. Otherwise you're just guessing whether those numbers are any good. Makes a huge difference when you're trying to figure out if a company's actually crushing it or just okay.
So accounting policies are basically the rules companies pick for recording stuff, and honestly? They can make two identical businesses look totally different on paper. Depreciation methods are a big one - straight-line versus accelerated will show way higher profits early on. Same with inventory valuation and revenue recognition. It's such a pain when you're trying to compare companies because of this! Always dig into the notes section where they actually tell you what methods they're using. Otherwise you might be comparing a tech startup to like, a manufacturing company without realizing their accounting makes them look completely different than they actually are.
Oh man, yeah financial statements can totally screw you over. Companies pull some shady stuff - like booking revenue way too early or hiding expenses they should write off immediately. The debt hiding tricks are honestly insane sometimes. Watch out for one-time events too, they make regular performance look better or worse than it actually is. Also those footnotes? Actually read them lol, I know they're boring but that's where the real info is. Look at ratios over several quarters to spot weird patterns.
So the numbers tell you what happened, but qualitative stuff tells you *why* it happened. Management quality, industry changes, competitive position - that's where the real story is. Your ratios might look amazing, but what if the CEO just got arrested? Or some new tech is about to make their whole business model obsolete? I always check out the management discussion section and industry news - honestly, that's where you'll catch the red flags before they show up in the financials. Those "soft" factors usually predict whether the good performance will actually last.
Excel's your best bet to start - seriously, I live in that thing like 80% of the time. Pivot tables and financial functions are game changers once you get them down. Bloomberg and FactSet are amazing but crazy expensive, so unless your company's loaded, don't worry about those yet. For smaller businesses, QuickBooks works fine. Python's cool if you're analyzing tons of companies at once, but honestly? Master Excel first. The charting tools alone will save you hours. Oh, and Sage is decent too if you run into it. Start simple though - Excel will handle pretty much everything you need for ratios and trend analysis.
Yeah, international standards definitely help with comparing companies across countries. IFRS makes things way clearer than trying to decode random local accounting rules. But honestly, it's still not bulletproof - companies interpret stuff differently, and the US being stubborn with their own GAAP system doesn't help. Makes global analysis such a pain sometimes. You'll still find noise in the data from judgment calls and implementation quirks. Just double-check which standards they're using before you dive into any ratio comparisons. Saves you from making dumb assumptions later.
-
Easily Understandable slides.
-
My team has been relying on SlideTeam’s professional PPT designs for a while now. It has greatly sped up quality work at my organization. So thanks!