

Sample Financial Analysis Report Manufacturing Powerpoint Presentation Slides


Try Before you Buy Download Free Sample Product
 Impress Your
 Audience
Editable
of Time


A detailed appraisal of a company as far as company’s progress is concerned is a must and should be put together in the form of PPT presentation. There are many valuable steps that must be kept in mind while displaying the data in financial report ppt Slides. The core areas which need due and special attention in PPT layout include identification of economic characteristics, areas focusing on companies strategies, tracking the company’s financial statements along with its profitability and risks. Tabular form of data and bar graphs featured in the PPT templates focus on areas like revenue, net profit, operating profit and more. The different modes of showing data on balance sheets in slides of PowerPoint presentation makes your life so much easy as you just need to add the data and you are ready to go. All this composite form of data representation in financial analysis report manufacturing presentation slide helps you lead and take the right decisions well in time Brief them on first aid with our Sample Financial Analysis Report Manufacturing Powerpoint Presentation Slides. Enlighten folks on handling injuries.
People who downloaded this PowerPoint presentation also viewed the following :
Content of this Powerpoint Presentation
Slide 1: This slide introduces Sample Financial Analysis Report Manufacturing. State your company name and get started.
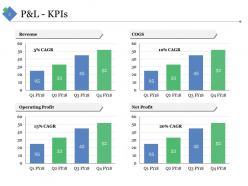
Slide 2: This is P&L - KPIs slide showcasing the following four graphs- COGS, Net Profit, Operating Profit, Revenue CAGR.
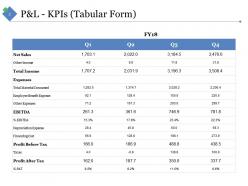
Slide 3: This is P&L - KPIs (Tabular Form) slide. Present your own P&L - KPIs in a tabular form here.
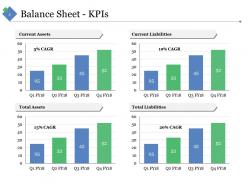
Slide 4: This slide presents Balance Sheet - KPIs further showing- Current Liabilities, Current Assets, Total Assets, Total Liabilities.
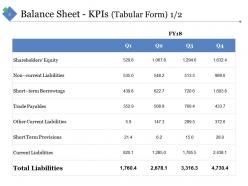
Slide 5: This slide presents Balance Sheet - KPIs in a Tabular Form majorly showing Total Liabilities.
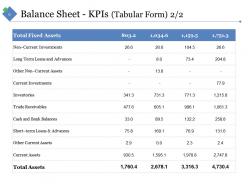
Slide 6: This slide also presents Balance Sheet - KPIs in a Tabular Form majorly showing Total Assets.
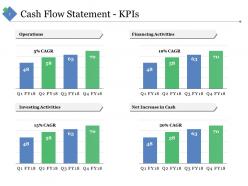
Slide 7: This is Cash Flow Statement - KPIs slide showing- Financing Activities, Operations, Investing Activities, Net Increase in Cash.
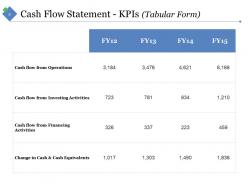
Slide 8: This slide shows Cash Flow Statement - KPIs in a Tabular Form.
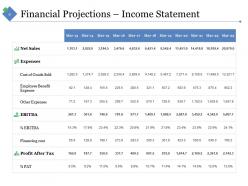
Slide 9: This slide shows Financial Projections – P&L Income Statement (USD MM).
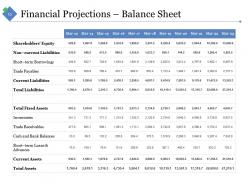
Slide 10: This slide shows Financial Projections – Balance Sheet.
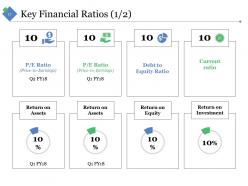
Slide 11: This is Key Financial Ratios (1/2) slide showing- Return on Equity, Return on Investment, P/E Ratio (Price-to-Earnings), Debt to Equity Ratio, Current ratio.
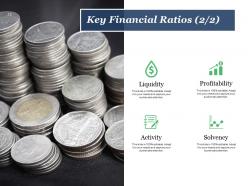
Slide 12: This slide also shows Key Financial Ratios (2/2) such as- Liquidity Profitability Solvency Activity
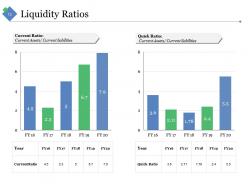
Slide 13: This slide shows Liquidity Ratios such as- Current Ratio: Current Assets/ Current liabilities, Quick Ratio: Current Assets/ Current liabilities.
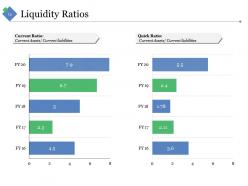
Slide 14: This is another slide showing Liquidity Ratios presented in a graphical form
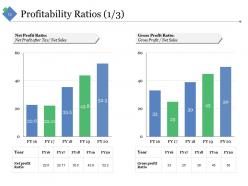
Slide 15: This slide shows Profitability Ratios (1/3)- Net Profit Ratio: Net Profit after Tax/ Net Sales, Gross Profit Ratio: Gross Profit / Net Sales.
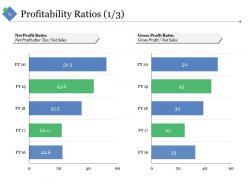
Slide 16: This slide also shows Profitability Ratios (1/3).
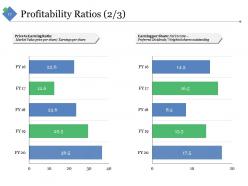
Slide 17: This too is Profitability Ratios (2/3) slide.
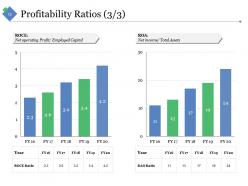
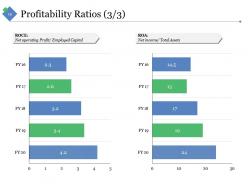
Slide 18: This is another slide showing Profitability Ratios (3/3) such as- ROCE: Net operating Profit/ Employed Capital, ROA: Net income/ Total Assets.
Slide 19: This slide also presents Profitability Ratios (3/3) in a garphical form.
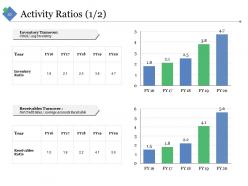
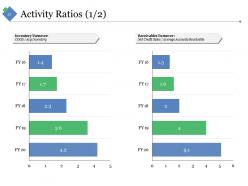
Slide 20: This slide shows Activity Ratios (1/2) such as- Inventory Turnover: COGS / Avg Inventory, Receivables Turnover : Net Credit Sales / Average Accounts Receivable.
Slide 21: This slide also shows Activity Ratios (1/2) graph.
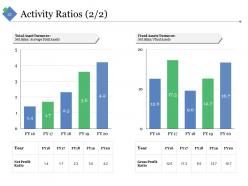
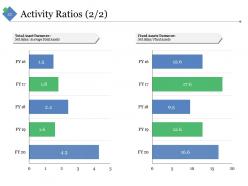
Slide 22: This is another slide showing Activity Ratios (2/2) further showing- Total Asset Turnover : Net Sales/ Average Total Assets, Fixed Assets Turnover: Net Sales/ Fixed Assets.
Slide 23: This too is an Activity Ratios (2/2) slide showing- Total Asset Turnover : Net Sales/ Average Total Assets, Fixed Assets Turnover: Net Sales/ Fixed Assets.
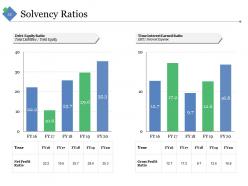
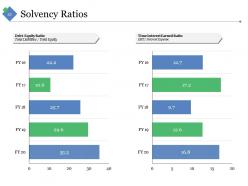
Slide 24: This sldie shows Solvency Ratios with- Debt-Equity Ratio: Total Liabilities / Total Equity, Time Interest Earned Ratio: EBIT/ Interest Expense.
Slide 25: This slide also shows Solvency Ratios with-Debt-Equity Ratio:Total Liabilities / Total Equity, Time Interest Earned Ratio: EBIT/ Interest Expense.
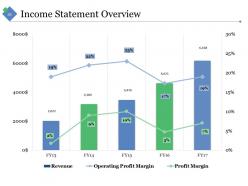
Slide 26: This slide shows Income Statement Overview graphically.
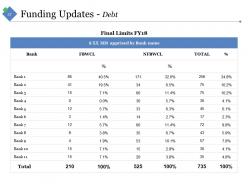
Slide 27: This slide shows Funding Updates - Debt table.
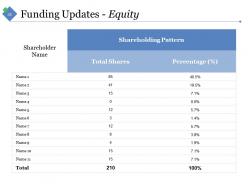
Slide 28: This slide shows Funding Updates - Equity table.
Slide 29: This is a Coffee Break slide to halt. You may alter/ modify the content as per need.
Slide 30: This slide forwards to Our Charts And Graphs. You may alter/ modify the content as per need.
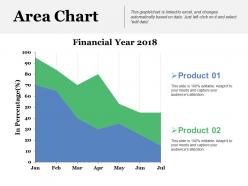
Slide 31: This is an Area Chart slide to show product/ entity growth, comparison, specifications etc.
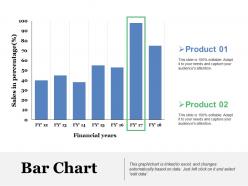
Slide 32: This is a Bar Chart slide to show product/ entity growth, comparison, specifications etc.
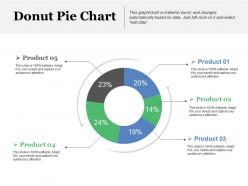
Slide 33: This is a Donut Pie Chart slide to present product/ entity comparison, specifications etc.
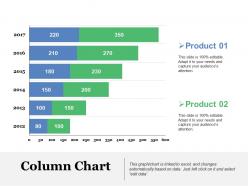
Slide 34: This is a Column Chart slide to present product/ entity comparison, specifications etc.
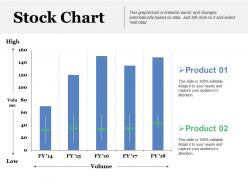
Slide 35: This is a Stock Chart to present product/ entity comparison, specifications etc.
Slide 36: This slide is titled Additional Slides. You can change the slide content as per your needs.
Slide 37: This is Our Mission slide to state your mission and vision.
Slide 38: This is an Our Team slide with name, image and text boxes to put the required information.
Slide 39: This is an About Us slide. State company or team specifications here.
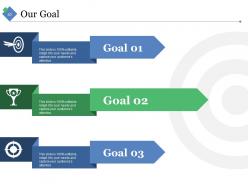
Slide 40: This is Our Goal slide. State your important goals here.
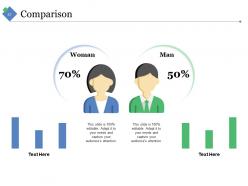
Slide 41: This slide shows Comparison between two entities- Man and Woman.
Slide 42: This is Financial slide to state financial aspects etc.
Slide 43: This is a Business Quotes slide to quote something you believe in.
Slide 44: This slide displays a Dashboard with metric imagery. You can present kpis, metrics etc. here.
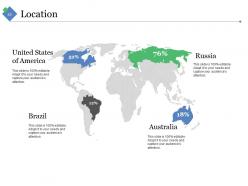
Slide 45: This is Location slide to show global growth, presence on a world map image.
Slide 46: This is a Puzzle pieces image slide to show information, specifications etc.
Slide 47: This slide presents a Timeline to show growth, milestones etc.
Slide 48: This is a Circular image slide to show information etc.
Slide 49: This is a Target slide. State your targets here.
Slide 50: This slide presents Mind Map imagery with text boxes.
Slide 51: This is a Bulb or Idea image slide to show information, ideas, specifications etc.
Slide 52: This slide shows a Magnifying Glass with imagery and text boxes to go with.
Slide 53: This is a Thank You slide with Address# street number, city, state, Contact Numbers, Email Address.
Sample Financial Analysis Report Manufacturing Powerpoint Presentation Slides with all 53 slides:
Folks find focus with our Sample Financial Analysis Report Manufacturing Powerpoint Presentation Slides. They encourage a feeling of creativity.


FAQs for Sample Financial Analysis Report Manufacturing
Start with profitability stuff like gross margin and ROE - those are non-negotiable. Then hit liquidity (current ratio, quick ratio) and debt ratios like debt-to-equity. Honestly, stakeholders eat up growth rates so definitely include those. Asset turnover and inventory turnover round things out nicely. Pick maybe 8-12 metrics max because nobody wants to wade through a million calculations. Industry benchmarks are clutch for context - your numbers mean nothing in a vacuum. Oh, and don't stress about getting everything perfect upfront. You can always add more specific stuff later when people start asking random questions.
Look, you can't just stare at numbers by themselves – they don't mean much without context. Compare your stuff to competitors or industry averages, and suddenly everything clicks. That 5% profit margin? Seems okay until you find out everyone else is pulling 12%. Honestly, historical data is probably the most useful comparison since it shows if you're actually improving. Short sentences work too. You'll catch trends you missed before and figure out what's actually working versus what's just... not. Just pick comparisons that make sense for your business instead of random benchmarks that don't apply.
Think of financial ratios as your go-to tools for figuring out if a company's actually doing well or just pretending to be. Liquidity ratios show whether they can cover their bills. Profitability ones tell you if they're actually making decent money. Then you've got debt ratios that reveal how much they owe. Honestly, I learned this the hard way - you can't just look at one ratio and call it good. Compare them to what other companies in the same industry are doing, plus check how they've changed over time. Focus on those four main types: liquidity, profitability, efficiency, and debt stuff.
Look at your financial data from the past 3-5 years and spot the patterns - are revenues going up, expenses climbing, ratios staying steady? Pretty much connect the dots with your numbers. Then use those growth rates to project what's coming next. I always think regression analysis sounds scarier than it actually is, but it works great for this stuff. Just don't assume trends will continue forever. If there's a big market shift or your business changes direction, those historical patterns might not mean much. But it's still your best starting point for forecasting.
Okay so first thing - put your main findings right at the top in an exec summary. Most people won't read past that anyway, trust me. Structure the rest logically: methodology, analysis, findings, recommendations. Headers and bullet points are crucial because nobody wants to read walls of text. Visuals beat paragraphs of numbers every single time. Skip the jargon and actually explain what those numbers mean for business decisions. Here's the thing though - don't just dump data on people. End each section by answering "so what?" Make it actionable. Your whole job is turning complex financial stuff into something decision-makers can actually use without getting a headache.
Look, external economic stuff will mess with your financial analysis big time. Interest rates hit your borrowing costs and how much customers actually spend. Inflation jacks up your input costs while you're trying to figure out pricing. Currency swings? They'll get you even if you think you're purely domestic - supply chains are crazy interconnected now. GDP growth and unemployment obviously affect demand forecasting. Industry trends too, but those are harder to predict honestly. You can't just look at internal company metrics anymore. The broader economic picture matters way more than people think when you're building out your analysis.
Oh man, biggest thing is using old data and never questioning your assumptions. Cherry-picking metrics to fit what you want to hear? Recipe for disaster - I've watched people crash and burn doing that in front of executives. Also make sure you're actually comparing similar things when you benchmark competitors. Market conditions and regulatory stuff can mess up your whole analysis if you ignore them. Honestly though? Double-check your Excel formulas because one stupid mistake will destroy your credibility faster than anything else. Always do a quick sanity check before you present.
Okay so financial analysis reports are basically your secret weapon for making decisions that don't suck. They show you which parts of your business are actually making money vs bleeding cash - way better than just guessing. You can spot trends in performance and cash flow, which honestly saves you from some embarrassing mistakes. When you're in those leadership meetings where everyone wants proof? These reports are gold. They help you run different "what if" scenarios too, like if you're thinking about expanding or need to cut costs. Trust me, having solid numbers makes your recommendations way more convincing.
Honestly, Excel's still king for most analyst work, but Power BI and Tableau will blow your mind for visualizations. Your reports will actually look professional instead of like spreadsheet vomit. Python with pandas is incredible once you get past the learning curve - though fair warning, the syntax felt weird at first. SQL's super helpful for pulling data without bugging the IT team constantly. Quick financial modeling? Check out Adaptive Insights or Anaplan. I'd start by getting really good at Excel's advanced features first. Then see what gaps you're running into and pick your next tool based on that.
Put your assumptions and limitations right up front - after the exec summary or methodology section works best. List out the obvious stuff first: growth rates you used, market conditions, data sources. Then be straight about what you couldn't figure out or didn't have access to. Honestly, I see people hide this in tiny footnotes all the time and then act shocked when someone calls them out later. Use bullet points so people can scan it fast. Your stakeholders need to know what might go wrong with your analysis before they make decisions with it.
Honestly, charts and graphs are game-changers for financial stuff. You can spot trends right away instead of staring at endless spreadsheet rows. Line graphs work great for showing changes over time. Bar charts? Perfect for comparing different periods. Heat maps are amazing too - they'll show you problem spots you'd totally miss otherwise (though nobody seems to use them enough). Color coding makes everything faster to read. Oh, and infographics can basically tell your whole story without anyone having to dig through numbers. Just do one visual per main point and people won't hate you for it.
Look, you definitely need to dig into the history first. Like, a 20% revenue drop seems awful until you find out they sold off a whole division that quarter. I usually go back 3-5 years to catch trends and seasonal stuff - plus any weird one-time events that mess with the current numbers. You're gonna miss the whole story otherwise. Honestly, financial statements without context are pretty useless. Grab at least three years of data before you start analyzing anything. Trust me on this one.
Honestly, stakeholder feedback is what makes or breaks your analysis. Numbers alone don't mean much if they're not useful for decisions. Getting input early helps you figure out which metrics actually matter to people and what assumptions might be off. Plus they'll spot mistakes you missed - happens to me all the time. I always set up quick check-ins during drafts instead of waiting until the end. Way less painful than doing major revisions later. Their feedback also helps you present stuff differently depending on who's looking at it. Trust me, it's worth the extra effort upfront.
Hey! So sensitivity analysis is basically stress-testing your financial projections. You mess around with key variables - like "what if sales drop 10%?" or "what happens if costs jump 15%?" - then see how much your bottom line moves. Honestly, it's way more helpful than it sounds. Some assumptions will barely budge your numbers, while others completely wreck everything. Focus on your three biggest assumptions first. That's where you'll spot which variables actually matter so you can keep a closer eye on those instead of worrying about every little thing.
Accuracy and objectivity are huge - don't cherry-pick data just because it fits what you want to prove. I've watched analysts crash and burn doing exactly that. Be upfront about conflicts of interest too, like if your company has ties to whoever you're analyzing. Document your methodology and call out any sketchy data sources. Honestly, stakeholders always want rosy forecasts, but resist that pressure. Stay conservative with conclusions. Oh, and write down all your assumptions - future you will thank present you when someone questions your work later.
-
Innovative and Colorful designs.
-
Attractive design and informative presentation.