


Example Presentation Of Financial Reports Powerpoint Presentation Slides


Try Before you Buy Download Free Sample Product
 Impress Your
 Audience
Editable
of Time


If you are looking to represent your financial statements, then use our example presentation of financial reports PowerPoint presentation slides. Incorporate this financial statement analysis presentation template to provide a detailed financial detail about your company to your business creditors, investors and analysts which will help them to know about the financial position of the business stability. This financial results PPT template will further result in taking the effective business decisions in accordance to your company’s prevailing position in the competitive market. Utilize this financial report of a company PowerPoint slide as a device which directs your administration to have a control on different business errands. Our financial statement example PowerPoint design is crafted by our group of professional experts for your business development. Thus, showcase your financial record with this interesting PPT layout. Place a bet on our Example Presentation Of Financial Reports Powerpoint Presentation Slides. They will come up trumps everytime.
People who downloaded this PowerPoint presentation also viewed the following :
Content of this Powerpoint Presentation
Slide 1: This slide introduces Example Presentation Of Financial Reports. State Your company name and begin.
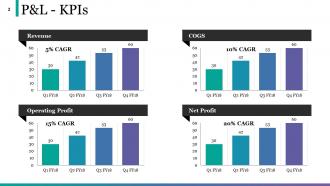
Slide 2: This slide showcases P&L - KPIs with these four factors- Revenue, COGS, Net Profit, Operating Profit.
Slide 3: This slide presents P&L - KPIs with three of the bar charts- Revenue, COGS, Net Profit, Operating Profit.
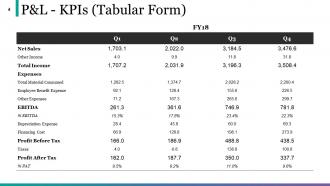
Slide 4: This slide showcases P&L - KPIs (Tabular Form). Please update the tabular form and make use of it.
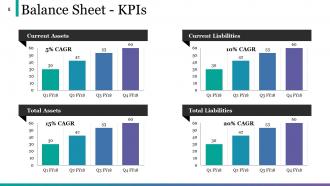
Slide 5: This slide presents Balance Sheet - KPIs with these four of the parameters- Current Assets, Current Liabilities, Total Liabilities, Total Assets.
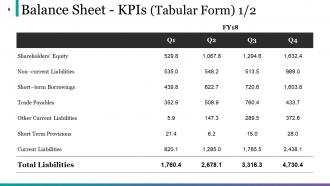
Slide 6: This slide showcases Balance Sheet - KPIs (Tabular Form) 1/2.
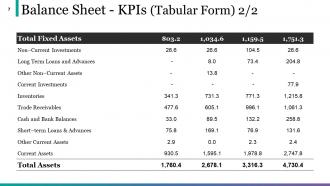
Slide 7: This slide presents Balance Sheet - KPIs (Tabular Form) 2/2. You can add the data and make use of it.
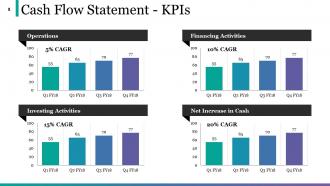
Slide 8: This slide shows Cash Flow Statement - KPIs with four of the parameters- Operations, Financing Activities, Net Increase in Cash, Investing Activities.
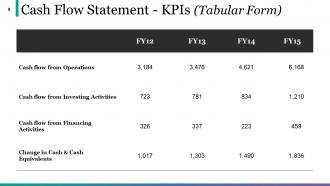
Slide 9: This slide presents Cash Flow Statement - KPIs (Tabular Form).
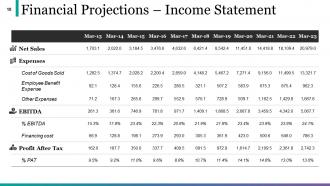
Slide 10: This slide showcases Financial Projections – Income Statement.
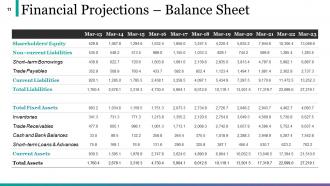
Slide 11: This slide shows Financial Projections – Balance Sheet. You can add the data and use as per your requirement.
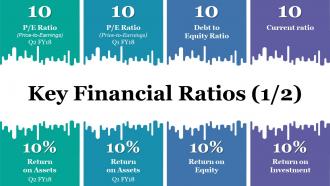
Slide 12: This slide presents Key Financial Ratios (1/2) with which you can add the current ratio, return on assests.
Slide 13: This slide showcases Key Financial Ratios (2/2) with these four of the factors- Liquidity, Profitability, Activity, Solvency.
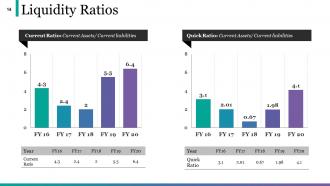
Slide 14: This slide presents Liquidity Ratios with those of the two parameters.
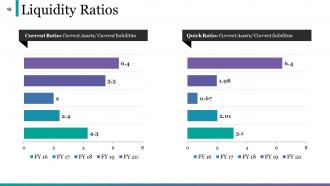
Slide 15: This slide showcases Liquidity Ratios with these of the two points- Current Ratio: Current Assets/ Current liabilities, Quick Ratio: Current Assets/ Current liabilities.
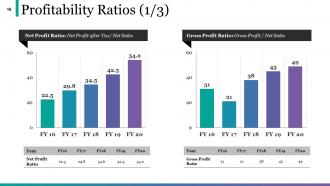
Slide 16: This slide presents Profitability Ratios (1/3) with these of the two parameters- Net Profit Ratio: Net Profit after Tax/ Net Sales, Gross Profit Ratio: Gross Profit / Net Sales.
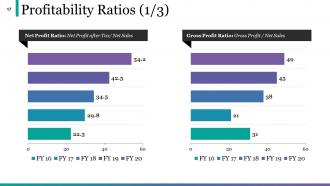
Slide 17: This slide showcases Profitability Ratios (1/3) which presents these main categories- Net Profit Ratio: Net Profit after Tax/ Net Sales, Gross Profit Ratio: Gross Profit / Net Sales.
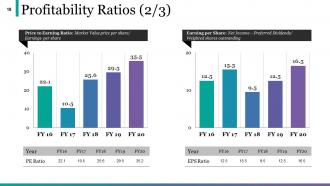
Slide 18: This slide presents Profitability Ratios (2/3) with these Price to Earning Ratio, Earning per Share.
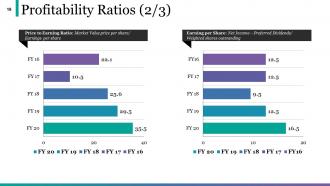
Slide 19: This slide shows Profitability Ratios (2/3) with some of these we have put it- Price to Earning Ratio: Market Value price per share/ Earnings per share, Earning per Share: Net Income – Preferred Dividends/ Weighted shares outstanding.
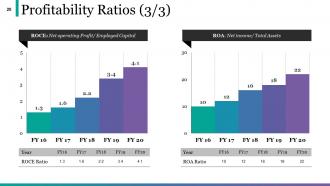
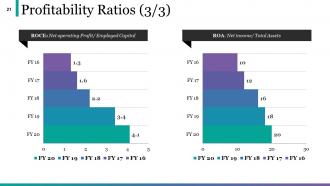
Slide 20: This slide presents Profitability Ratios (3/3) with these of the factors- ROCE: Net operating Profit/ Employed Capital, ROA: Net income/ Total Assets.
Slide 21: This slide showcases Profitability Ratios (3/3) which further showing- ROCE: Net operating Profit/ Employed Capital, ROA: Net income/ Total Assets.
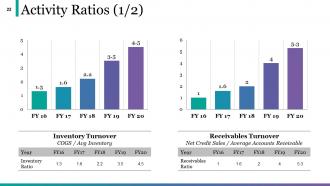
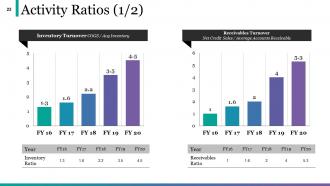
Slide 22: This slide presents Activity Ratios (1/2). Add the data and details and use it.
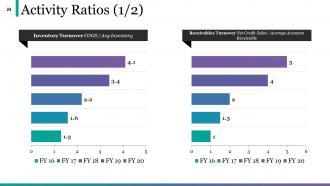
Slide 23: This slide shows Activity Ratios (1/2) with these three of the categories- Inventory Turnover COGS / Avg Inventory, Receivables Turnover, Net Credit Sales / Average Accounts Receivable.
Slide 24: This slide presents Activity Ratios (1/2) which can be used as- Inventory Turnover COGS / Avg Inventory, Receivables Turnover Net Credit Sales / Average Accounts Receivable.
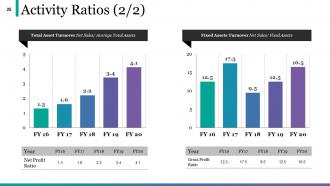
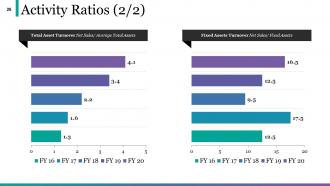
Slide 25: This slide showcases Activity Ratios (2/2) with these two points- Total Asset Turnover Net Sales/ Average Total Assets, Fixed Assets Turnover Net Sales/ Fixed Assets.
Slide 26: This slide presents Activity Ratios (2/2) with these two important factors- Total Asset Turnover Net Sales/ Average Total Assets, Fixed Assets Turnover Net Sales/ Fixed Assets.
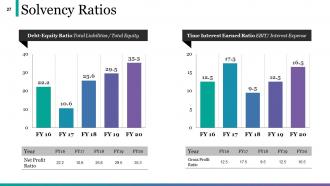
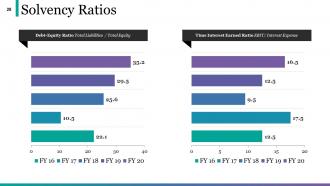
Slide 27: This slide shows Solvency Ratios with these of the two categories- Debt-Equity Ratio Total Liabilities / Total Equity, Time Interest Earned Ratio EBIT/ Interest Expense.
Slide 28: This slide showcases Solvency Ratios with these two of the parameters- Debt-Equity Ratio Total Liabilities / Total Equity, Time Interest Earned Ratio EBIT/ Interest Expense.
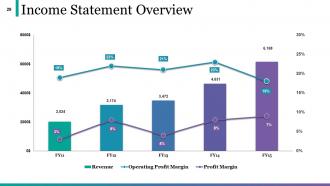
Slide 29: This slide presents Income Statement Overview with a graph and use it according to you requirement.
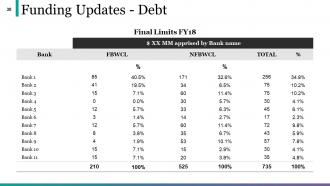
Slide 30: This slide showcases Funding Updates - Debt with the information of the bank and percentage.
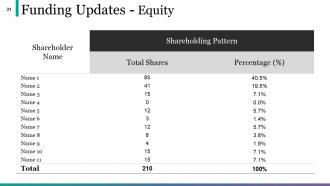
Slide 31: This slide presents Funding Updates - Equity with which you can add the shareholding pattern.
Slide 32: This slide is a Coffee Break image for a halt.
Slide 33: This slide displays the title Charts & Graphs.
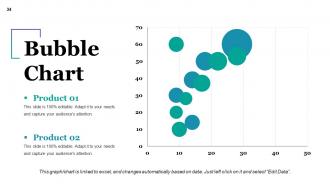
Slide 34: This slide contains a bubble Chart. Product 01Product 02 can be shown in comparison.
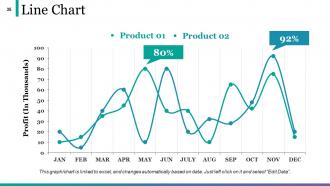
Slide 35: This slide shows a Line Chart for two product comparison
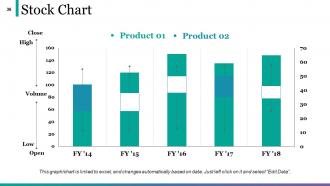
Slide 36: This slide displays a Stock Chart with volume as parameter in terms of high and low, open and close.
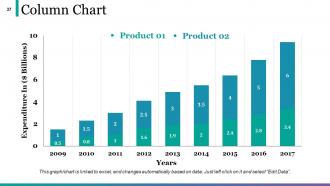
Slide 37: This slide presents Column Chart with which you can use for the comparing.
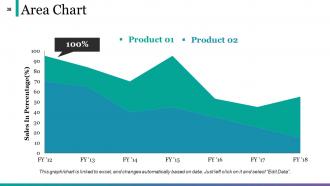
Slide 38: This is an Area Chart slide for product/entity comparison.
Slide 39: This slide is titled Additional Slides to move forward.
Slide 40: This slide represents Our mission,vision,goal. State your mission, goals etc.
Slide 41: This is an Our Team slide with name, image&text boxes to put the required information.
Slide 42: This is an About Us slide showing Our Company, Value Client, and Premium services as examples.
Slide 43: This is an Our Goal slide. State them here.
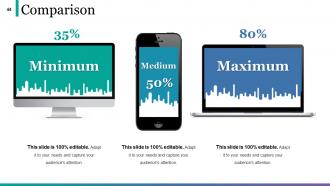
Slide 44: This slide shows Comparison of Positive Factors v/s Negative Factors with thumbsup and thumb down imagery.
Slide 45: This is a Financial Score slide to show financial aspects here.
Slide 46: This is a Quotes slide to convey message, beliefs etc.
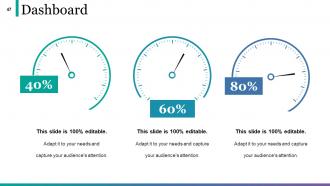
Slide 47: This is a Dashboard slide to show- Strategic System, Success, Goal Process, Sales Review, Communication Study.
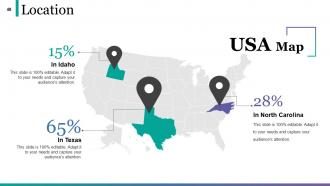
Slide 48: This is a Location slide to show global growth, presence etc. on world map.
Slide 49: This slide showcases a Puzzle with imagery
Slide 50: This slide presents a Timeline to show growth, milestones etc.
Slide 51: This is a Circular image slide to show information etc.
Slide 52: This is a Target slide. State your targets here.
Slide 53: This slide presents a Mind map with text boxes.
Slide 54: This is a Bulb/idea image slide to show information, ideas, innovation specific stuff etc.
Slide 55: This is a Magnifying glass image slide to show information, scoping aspects etc.
Slide 56: This is a Thank You slide for acknowledgement.
Example Presentation Of Financial Reports Powerpoint Presentation Slides with all 56 slides:
No attempt is half hearted with our Example Presentation Of Financial Reports Powerpoint Presentation Slides. They always exert great effort.


FAQs for Example Presentation Of Financial Reports
You need the big three: income statement, balance sheet, and cash flow statement. They show revenue/expenses, assets/liabilities, and where your cash actually went. Start with an executive summary - honestly, half the people won't read past that anyway. Include notes explaining your accounting methods and any weird items that pop up. Year-over-year comparisons are clutch for showing trends. Don't skip the management discussion either. Numbers without context are pretty useless when people are trying to make real decisions. Oh, and throw in some key performance indicators to highlight what's actually working.
So basically, public companies have to file all these detailed SEC reports that anyone can look up - like those quarterly 10-Qs and annual 10-Ks. Pretty much everything's out there. Private companies? They only report to their own investors and lenders. Way more chill for them honestly. They don't have to follow the same strict GAAP rules or deadlines that public ones do. Can use different accounting methods too. External audits aren't even required unless their lenders make them do it. If you're trying to analyze a company though, you'll get way more useful data from public reports.
So there are three big financial statements that matter. Income statement shows if they're actually making money or bleeding cash. Then you've got the balance sheet - that's like a snapshot of what they own versus what they owe. Cash flow is probably my favorite though, since companies can get creative with their earnings but cash doesn't lie. Honestly, looking at just one is pretty useless. You need all three to really understand what's happening. Oh, and don't get too caught up in the fancy ratios at first - just focus on reading these together and the patterns will start making sense.
So financial ratios are like getting the real story behind those boring spreadsheets. You pull numbers from their statements to calculate stuff like debt-to-equity and profit margins. Honestly, it's way more telling than just staring at random figures. These ratios show you patterns over time and how they stack up against competitors - super helpful for catching trends early. I always start with profitability, liquidity, and debt ratios first. They're like a company's health checkup but actually useful. Once you get the hang of it, you'll spot red flags way faster.
Okay so basically those notes and disclosures are like the real story behind all those numbers. They'll tell you about accounting methods, debt details, lawsuits, stuff that happened after the reporting period ended - you know, the actual context. Raw numbers by themselves are pretty useless tbh. It's kinda like looking at a photo without knowing when or where it was taken. The notes section is honestly where you find the good stuff when you're trying to figure out what's really going on with a company. Don't skip that part.
So IFRS basically makes your financials comparable worldwide, which is cool. But yeah, it's gonna mess with your current setup if you're using local GAAP. The main headaches? Revenue recognition changes, intangible assets get treated differently, and don't get me started on lease accounting - IFRS loves broad principles while US GAAP is all about specific rules. Transitioning honestly sucks at first. Worth it though if you've got international operations or want foreign investors. They'll actually understand your numbers. I'd start by figuring out which accounting policies will bite you the hardest.
Look, it's all about knowing your audience. Investors want the juicy stuff - cash flow, profit margins, where you're headed next year. They're hunting for returns, basically. Regulators? Totally different game. They just want everything by the book and zero funny business with the numbers. Your investor reports can get creative with strategy and future plans, but regulatory stuff has to be boring and standardized - no wiggle room there. I always map out what questions each group's actually trying to answer first. Makes it way easier to figure out what to emphasize.
Don't rush it - that's like the
-
Great designs, Easily Editable.
-
The Designed Graphic are very professional and classic.