

Financial analysis module powerpoint presentation slides





Try Before you Buy Download Free Sample Product
 Impress Your
 Audience
 100%
100% Editable
 Save Hours
 of Time


Need to present financial status of your organization then our financial analysis module PowerPoint Presentation is ideal for you. The income statement PPT slides having multiple slides such as P & L KPIs, balance sheet KPIs, financial projections, key financial ratios, liquidity ratios, cash flow statement KPIs, profitability ratios, activity ratios, solvency ratios, income statement overview and funding updates etc. Our monetary statement PPT presentation goes well with topics like profitability analysis, business impact analysis, financial health, and income statement, balance sheet, statement of cash flow, and financial heath, and financial ratio analysis. You can download this cash flow statement PowerPoint slides to perform some quick profitability analysis. Ratios provided in this presentations can demonstrate how long a company to pay off its account payable. This financial analysis module PowerPoint template is also helpful to showcase how well management is managing its company resources. Our Financial Analysis Module Powerpoint Presentation Slides are exclusively crafted. They can be alluringly awesome.
People who downloaded this PowerPoint presentation also viewed the following :
Video for Financial analysis module powerpoint presentation slides
Content of this Powerpoint Presentation
Slide 1: This slide introduces Financial Analysis Module. State Your Company Name and begin.
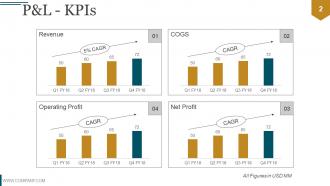
Slide 2: This is P&L - KPIs showcasing- COGS, Net Profit, Operating Profit, Revenue CAGR.
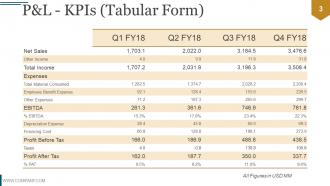
Slide 3: This is P&L - KPIs (Tabular Form) slide.
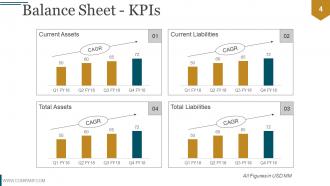
Slide 4: This slide presents Balance Sheet - KPIs Current Liabilities,, Total Liabilities Total Assets, Current Assets CAGR.
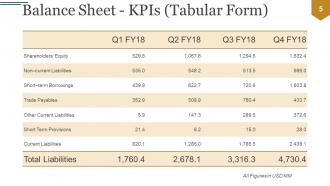
Slide 5: This is a Balance Sheet - KPIs (Tabular Form) slide.
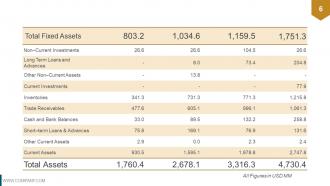
Slide 6: This is a continuation slide for Balance Sheet.
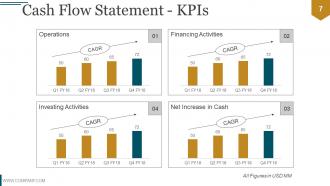
Slide 7: This slide showcases Cash Flow Statement - KPIs displaying- Financing Activities, Net Increase in Cash, Investing Activities, Operations CAGR.
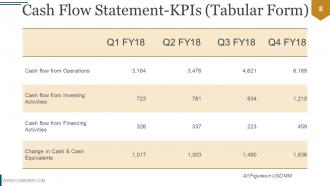
Slide 8: This is a Cash Flow Statement-KPIs (Tabular Form) slide.
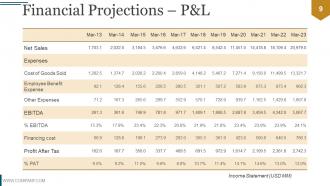
Slide 9: This slide shows Financial Projections – P&L Income Statement (USD MM).
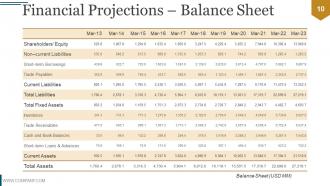
Slide 10: This slide presents Financial Projections – Balance Sheet.
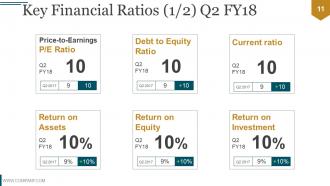
Slide 11: This slide presents Key Financial Ratios of- P/E Ratio, Debt Equity Ratio, Current Ratio with- Return on Assets, Return on Equity, Return on Investment, Return on Assets.
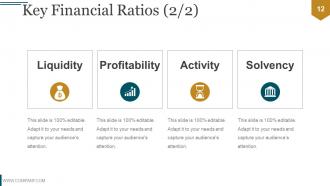
Slide 12: This slide presents Key Financial Ratios of- Liquidity, Profitability, Activity, Solvency.
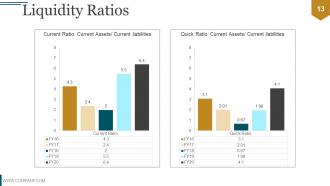
Slide 13: This slide showcases Liquidity Ratios displaying- Current Ratio: Current Assets/ Current liabilities, Quick Ratio: Current Assets/ Current liabilities.
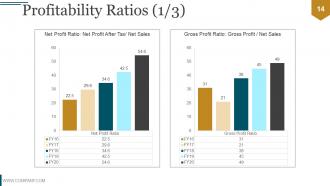
Slide 14: This slide presents Profitability Ratios (1/3) displaying- Net Profit Ratio: Net Profit After Tax/ Net Sales, Gross Profit Ratio: Gross Profit / Net Sales.
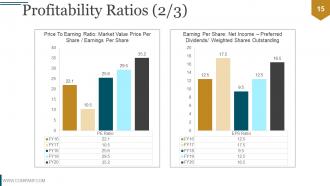
Slide 15: This slide showcases Profitability Ratios (2/3) displaying- Price To Earning Ratio: Market Value Price Per Share / Earnings Per Share Earning Per Share: Net Income – Preferred Dividends/ Weighted Shares Outstanding
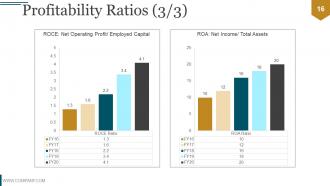
Slide 16: This slide shows Profitability Ratios (3/3) displaying- ROCE: Net Operating Profit/ Employed Capital ROA: Net Income/ Total Assets
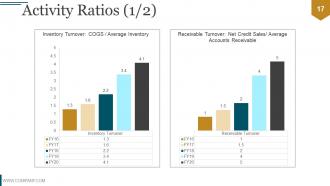
Slide 17: This slide showcases Activity Ratios (1/2) displaying- Inventory Turnover: COGS / Average Inventory, Receivable Turnover: Net Credit Sales/ Average Accounts Receivable.
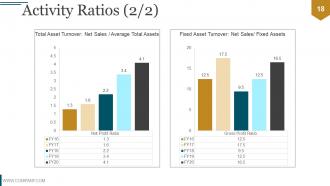
Slide 18: This slide shows Activity Ratios (2/2) displaying- Total Asset Turnover: Net Sales / Average Total Assets, Fixed Asset Turnover: Net Sales/ Fixed Assets.
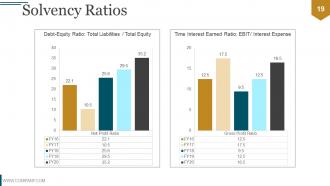
Slide 19: This sldie shows Solvency Ratios displaying- Debt-Equity Ratio: Total Liabilities / Total Equity, Time Interest Earned Ratio: EBIT/ Interest Expense.
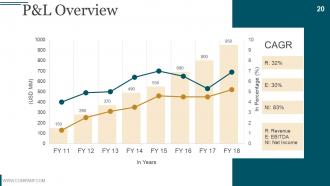
Slide 20: This slide showcases P&L Overview in graph form showcasing- CAGR of R: Revenue, E: EBITDA, NI: Net Income.
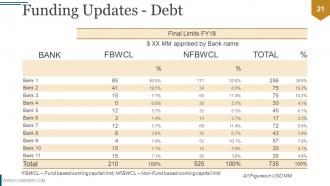
Slide 21: This slide showcases Funding Updates - Debt in tabular form.
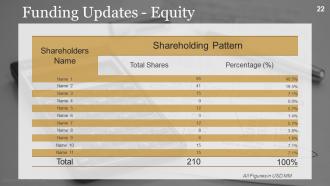
Slide 22: This slide showcases Funding Updates - Equity in tabular form.
Slide 23: This slide showcases Financial Analysis Module Icons Set. Use the icons as per need.
Slide 24: This slide is titled Additional Slides to move forward. You ma alter/modify the slide content as per need.
Slide 25: This is Our Mission slide with Vision and Goal etc. icon imagery. State them here.
Slide 26: This slide presents Meet Our Team with name, designation to put relevant information.
Slide 27: This is an About Our Company slide. Show company/team specifications etc. here
Slide 28: This is Our Goal slide. State them here.
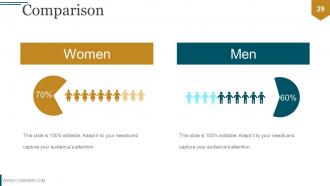
Slide 29: This slide shows Comparison in a creative manner displaying male and female imagery. State comparing aspects here.
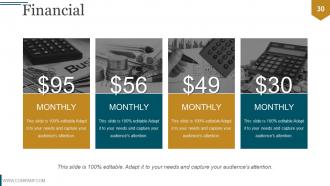
Slide 30: This slide shows Financial Score. State financial aspects here.
Slide 31: This is a Quotes slide. State business message, beliefs etc. here.
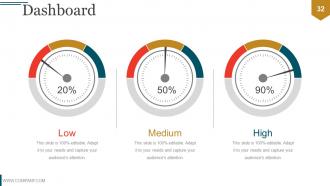
Slide 32: This is a Dashboard slide to display metrics, kpis, etc.
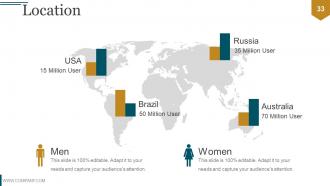
Slide 33: This is a Location slide of a world map image to show global growth, presence etc.
Slide 34: This is a Timeline slide to show growth, journey, evolution etc.
Slide 35: This is continuation of Timeline slide to show growth, evolution etc.
Slide 36: This is continuation of Timeline slide to show Current Progress, growth, evolution etc.
Slide 37: This slide displays Post It Notes to flash company event, news or anything to highlight.
Slide 38: This slide displays Newspaper image to flash company event, news or anything to highlight. You may change the content as per need.
Slide 39: This is a Puzzle image slide to show information, specifications etc.
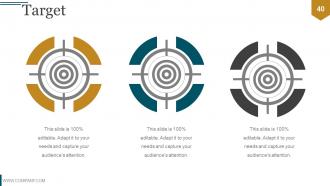
Slide 40: This is a Target slide to show targets, plans etc.
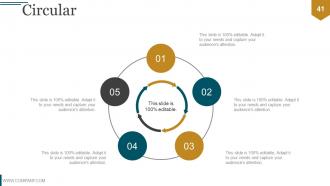
Slide 41: This is a Circular image slide to show information, specifications etc.
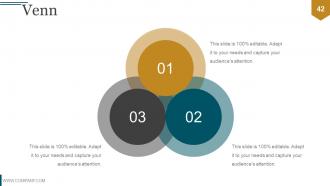
Slide 42: This is a Venn diagram image slide to show information, specifications etc.
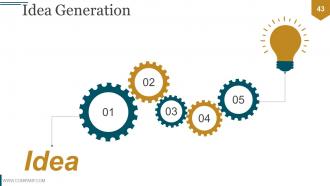
Slide 43: This is an Idea Generation gear bulb image slide to show information, specifications etc.
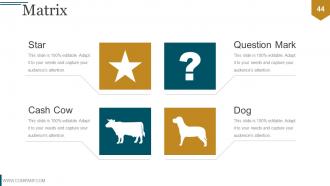
Slide 44: This is a Matrix slide to show information, specifications, comparison etc.
Slide 45: This is a SWOT Analysis slide.
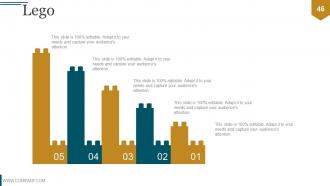
Slide 46: This slide showcases Lego imagery. Present information, specifications etc. here.
Slide 47: This slide shows Silhouettes image with text boxes. State information etc. here.
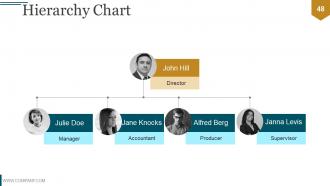
Slide 48: This is a Hierarchy slide to state team specifications, organizational structure etc.
Slide 49: This is a Mind Map Chart slide to show information, segregations, specifications etc.
Slide 50: This slide shows a Magnifying glass image with text boxes. State information etc. here.
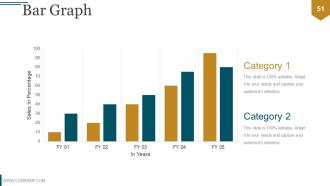
Slide 51: This slide presents a Bar Graph for two product/entity comparison, information, specifications etc.
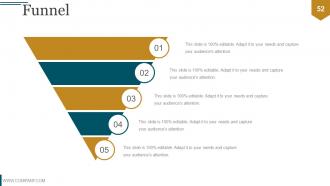
Slide 52: This slide displays a Funnel image. State information, funneling aspects etc. here.
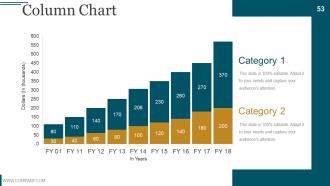
Slide 53: This slide presents a Column Chart for two product/entity comparison, information, specifications etc.
Slide 54: This slide is titled Our Charts to move forward. You may change the slide content as per need.
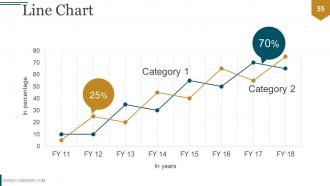
Slide 55: This slide presents a Line Chart for two product/entity comparison, information, specifications etc.
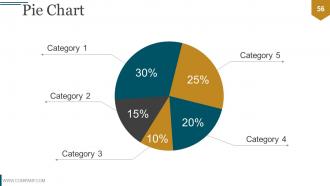
Slide 56: This slide presents a Pie Chart for two product/entity comparison, information, specifications etc.
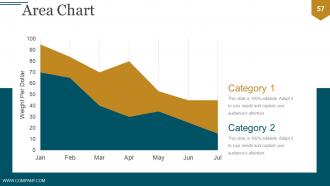
Slide 57: This slide presents an Area Chart for two product/entity comparison, information, specifications etc.
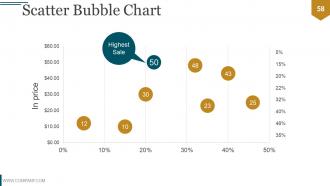
Slide 58: This slide presents a Scatter Bubble Chart for two product/entity comparison, information, specifications etc.
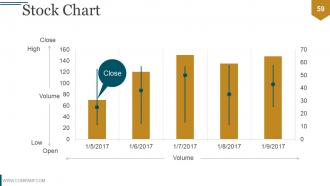
Slide 59: This slide showcases a Stock Graph for two product/entity comparison, information, specifications etc.
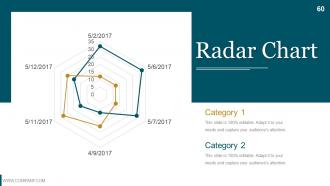
Slide 60: This slide showcases a Radar Chart for two product/entity comparison, information, specifications etc.
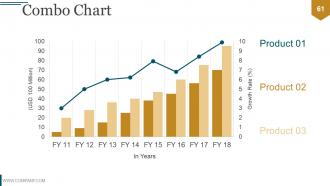
Slide 61: This slide showcases a Combo Chart for two product/entity comparison, information, specifications etc.
Slide 62: This is a Thank You slide with Address# street number, city, state, Contact Numbers, Email Address.
Financial analysis module powerpoint presentation slides with all 62 slides:
Highlight the adverse effects of climate change with our Financial Analysis Module Powerpoint Presentation Slides. Elaborate on the factors that influence it.

















FAQs for Financial analysis module
So basically there are four types of ratios you should look at. Liquidity ones first - current ratio, quick ratio - just to see if they can actually pay their bills. Profitability is obvious but super important: ROE, gross margin, net margin. I mean, a company that's bleeding money isn't gonna work out great. Debt-to-equity tells you how risky they're being with borrowed cash. Then efficiency stuff like inventory turnover shows how smoothly they're running things. Don't go crazy though - just pick like 2-3 from each category or you'll drive yourself nuts trying to track everything.
Look, cash flow analysis shows you when money actually hits your account vs when it leaves. Way more useful than those fancy profit projections that look great on paper. Timing is everything - I've watched "sure thing" investments go belly up because people didn't think about liquidity. You'll know if you can cover your bills while waiting for returns to roll in. It's also perfect for comparing different opportunities based on how they actually generate cash. My dad always said profits don't pay rent, cash does. Run those numbers before you commit to anything big.
Honestly, you can't do decent forecasting without budgeting first. Think of it as your roadmap - budgets give you those baseline numbers for revenue, costs, and cash flow that you'll need later for projections. The variance analysis alone (comparing what actually happened vs what you planned) is super helpful for spotting patterns. Plus it makes you think through all your business drivers systematically, which is annoying but necessary. I've seen too many people skip this step and their forecasts are just... rough. Get your budgeting process down first and your predictions will be way more accurate.
Look, trend analysis is basically your early warning system for catching problems before they blow up. Track your key numbers over time - cash flow, debt ratios, profit margins - because something might seem okay right now but show a nasty pattern when you look at it quarterly or yearly. It's way better than waiting until you're already in trouble, you know? I always compare my trends against industry benchmarks too. If everyone else is going up and you're consistently sliding down? Time to figure out what's wrong and fix it fast.
So horizontal analysis tracks your numbers over time - like comparing this year's revenue to last year's. Vertical analysis breaks down percentages within one period, showing how each expense relates to your total spending. I always think horizontal is way more useful for spotting trends tbh. Like you'd use horizontal to see if sales dropped 10% since 2022. Vertical tells you marketing eats up 15% of your budget right now. Both are helpful but horizontal gives you the bigger picture of where things are headed.
Look, variance analysis is basically your detective tool for figuring out why your budget went sideways. Instead of just staring at that depressing bottom line, you break down exactly what happened - price changes, volume stuff, efficiency problems, whatever. Honestly, I wish I'd started doing this sooner because it shows you what you can actually control vs random market chaos. Focus on your biggest variances first though, that's where the real insights are hiding. It's like... why waste time on small potatoes when there's obviously something major going on elsewhere? Game changer for decision making.
First thing - split up your fixed costs (rent, salaries) from the variable stuff like materials and per-unit commissions. Don't just pick nice round numbers for pricing either, that's tempting but unrealistic. Calculate your contribution margin per unit, then divide your total fixed costs by that number. I'd honestly run this a few different ways with various price points because it's kinda scary how much one small change can shift everything. Be conservative with estimates too - costs creep up and prices don't always hold. Check your assumptions every few months since nothing stays the same forever.
Dude, external stuff will completely mess up your financial analysis if you ignore it. Interest rates change your discount rates and borrowing costs. Inflation hits your revenue and cost assumptions hard. Economic growth shifts market demand around too. Currency fluctuations are brutal for international ops - we got burned by that last quarter, ugh. Instead of static assumptions, you gotta stress-test against different scenarios. Build sensitivity analysis for the big macro variables so stakeholders can see how external shocks might wreck your forecasts. Trust me on this one.
Think of financial analysis as your GPS for M&A deals. You'll want to value the target company and check if they're actually healthy or just look good on paper. Due diligence is where you dig through their books - honestly, this part can get pretty tedious but it's where you catch the nasty surprises. Model out different scenarios to see your potential returns. Don't forget to crunch the numbers on synergies since that's how you justify paying extra. Oh, and definitely stress-test your assumptions with sensitivity analysis before you commit.
So basically, you're building scenarios using past data and your best guesses about the future - revenue, expenses, cash flow, all that stuff. Test different situations like "what if sales jump 15% instead of 25%?" or "should we actually launch that new product?" Your assumptions make or break everything though, which is kinda obvious but worth saying. The real magic happens with sensitivity analysis - tweak the important variables and watch how it hits your profits. I'd start simple with a basic three-statement model connecting P&L, balance sheet, and cash flow. Then just add layers when you need them.
Honestly, Excel is still king for financial stuff - everyone knows it and it's super flexible. Once you've got that down, grab either Power BI or Tableau for making pretty charts. SQL is clutch if you're pulling data from databases. Python's where it's at now though, especially for big datasets and automating boring tasks (makes you look like a wizard too lol). R does great statistical work but it's kind of a pain to learn. My take? Get really good at Excel first. Then just pick whatever viz tool and programming language your team is actually using - no point learning something fancy if nobody else touches it.
Honestly, you need to compare your numbers to competitors or you'll have no clue what's actually happening. Like, 15% profit margin sounds decent, but what if everyone else in your industry is hitting 25%? That's a problem. Pull ratios for maybe 4-5 similar companies and see how you stack up. It'll help you catch issues early and figure out where you're killing it versus where you're behind. Plus stakeholders actually take your analysis seriously when you've got real context - I learned that the hard way. Makes such a difference.
Honestly, the worst mistake is trusting old data too much - markets shift fast. Also don't just stare at spreadsheets all day without understanding what the business actually does. I've watched people cherry-pick numbers that made their theory look good, then crash and burn when reality hit. Make sure your data sources aren't garbage or inconsistent too. When you're comparing competitors, you gotta compare the right stuff - sounds obvious but people mess this up constantly. Always double-check if your conclusions make sense with what's happening in the real world. And seriously, have someone else review your work.
So sensitivity analysis is basically your "what if" tool for financial models. You tweak key variables - interest rates, sales numbers, costs - to see how much they mess with your results. Pick your 3-4 sketchiest assumptions and bump them up or down 10-20%. You'll spot which ones actually matter vs the ones that barely move the needle. Way better than just crossing your fingers and hoping your projections work out. I learned this the hard way after building models that looked perfect until one variable shifted. Now you can see exactly where things might break before they do.
Don't mess with the data, seriously. I've watched people get into major legal hot water trying to make numbers look prettier than they actually are. Be upfront about your assumptions and any limitations - like if your sample size was kinda small or whatever. Management will probably push you to spin things their way, but think about everyone else too. Investors, employees, creditors - they all deserve the real story. Document everything you did so you can back it up later. Trust me, it's way better to deliver bad news honestly than get caught fudging results.
-
The Designed Graphic are very professional and classic.
-
Innovative and Colorful designs.