


Business performance analysis and planning powerpoint presentation slides


Try Before you Buy Download Free Sample Product
 Impress Your
 Audience
Editable
of Time


Assess performance of the company and focus on the critical issues with our professionally designed business performance analysis and planning PowerPoint presentation slides. Remove barriers and analyze the financial analysis of your business by incorporating detailed profit and loss kpi, balance sheet and cash flow statements. This content ready professionally designed company overview PowerPoint templates cover the topics like a firm overview, financial performance, competitor’s analysis, future enterprise development, quarterly business report and many more. Not just this, by using these organizational development PPT presentation graphics you can also represent various other topics like performance reporting, financial and operational planning, company modeling, organizational presentation, company process management and consolidation reporting can also be worked on if you go with this PPT. Just click to download our business performance analysis and planning presentation templates and get all your top vendors and customers, debtors, creditors and client updates in one just PPT. Integrate our compelling Business Performance Analysis And Planning Powerpoint Presentation Slides design into your next presentation. High design for projects with lofty goals.
People who downloaded this PowerPoint presentation also viewed the following :
Content of this Powerpoint Presentation
Slide 1: This slide introduces Business Performance Analysis and Planning. State Your Company Name and begin.
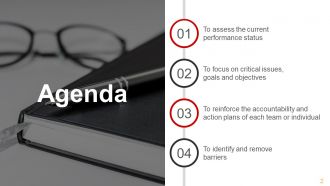
Slide 2: This is an Agenda slide. State your company agendas here such as- To assess the current performance status, To focus on critical issues, goals and objectives, To reinforce the accountability and action plans of each team or individual, To identify and remove barriers.
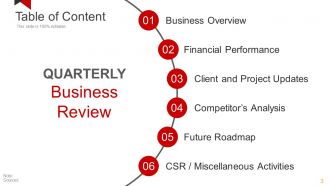
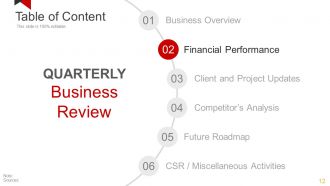
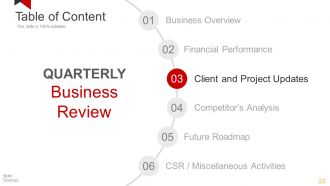
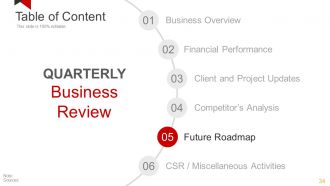
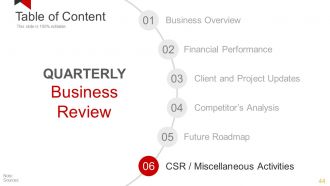
Slide 3: This slide showcases QUARTERLY Business Review Table of Content- Business Overview, Financial Performance, Client and Project Updates, CSR / Miscellaneous Activities, Future Roadmap, Competitor’s Analysis.
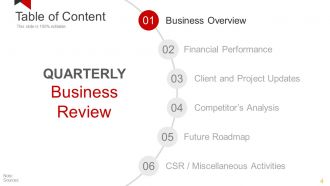
Slide 4: This slide showcases QUARTERLY Business Review Table of Content- Business Overview, Client and Project Updates, CSR / Miscellaneous Activities, Future Roadmap, Competitor’s Analysis.
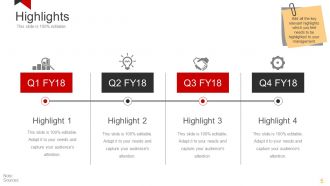
Slide 5: This slide presents Highlights for four quarters. Add all the key relevant highlights which you feel needs to be highlighted to your management.
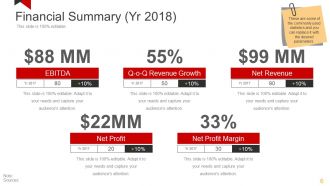
Slide 6: This is a Financial Summary slide showing- EBITDA, Q-o-Q Revenue Growth, Net Revenue, Net Profit, Margin, Net Profit. These are some of the commonly used statistics and you can replace it with the desired parameters.
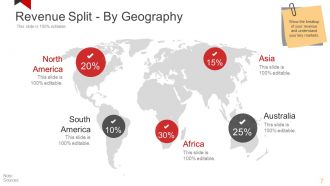
Slide 7: This slide present Revenue Split - By Geography on a world map image. Show the breakup of your revenue and understand your key markets.
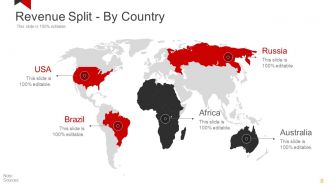
Slide 8: This slide also present Revenue Split - By Country on a world map image. Show the breakup of your revenue and understand your key markets.
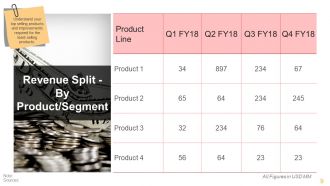
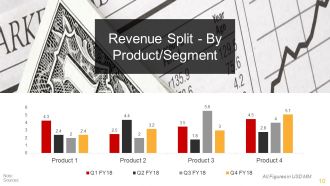
Slide 9: This slide shows Revenue Split - By Product/Segment. Understand your top selling products and improvements required for the least selling products.
Slide 10: This slide shows Revenue Split - By Product/Segment in graph form. Understand your top selling products and improvements required for the least selling products.
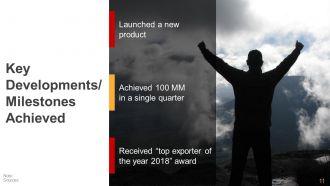
Slide 11: This slide showcases Key Developments/ Milestones Achieved with the following points- Launched a new product, Received “top exporter of the year 2018” award, Achieved 100 MM in a single quarter.
Slide 12: This slide presents Table of Content of QUARTERLY Business Review focusing on- Financial Performance.
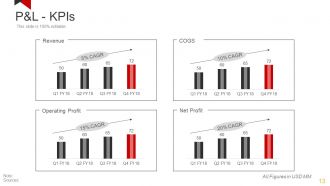
Slide 13: This slide presents P&L- KPIs graphs for COGS, Net Profit, Operating Profit, Revenue.
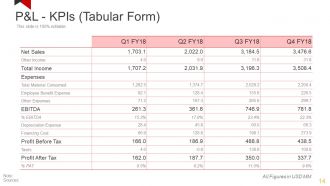
Slide 14: This slide presents P&L- KPIs in tabular form.
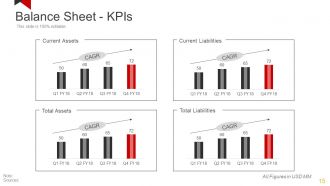
Slide 15: This slide presents Balance Sheet - KPIs graphs for- Current Liabilities, Total Liabilities, Total Assets, Current Assets.
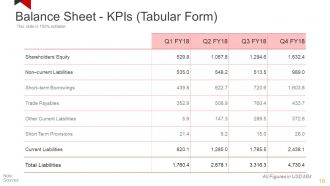
Slide 16: This slide presents Balance Sheet - KPIs in tabular form.
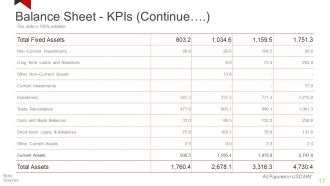
Slide 17: This slide also presents Balance Sheet - KPIs in tabular form.
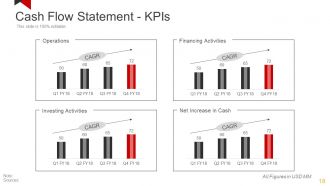
Slide 18: This slide presents Cash Flow Statement - KPIs graphs for- Financing Activities, Net Increase in Cash, Investing Activities, Operations.
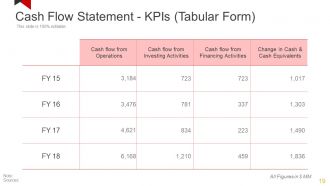
Slide 19: This slide showcases Cash Flow Statement - KPIs in tabular form.
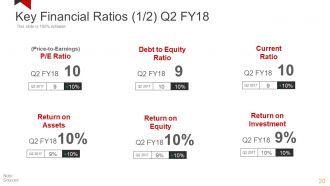
Slide 20: This slide displays Key Financial Ratios such as- Return on Equity, Return on Investment, (Price-to-Earnings) P/E Ratio, Debt to Equity Ratio, Current ratio, Return on Assets.
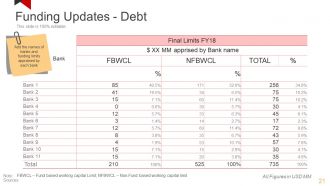
Slide 21: This slide shows Funding Updates - Debt table showcasing FBWCL – Fund based working capital Limit; NFBWCL – Non-Fund based working capital limit.
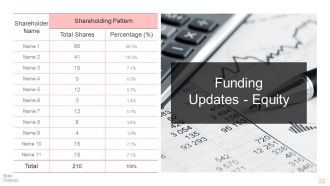
Slide 22: This slide presents Funding Updates - Equity in table form.
Slide 23: This slide showcases Table of Content of QUARTERLY Business Review focusing on- Client and Project Updates.
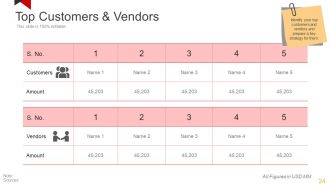
Slide 24: This slide displays Top Customers & Vendors table. Identify your top customers and vendors and prepare a key strategy for them.
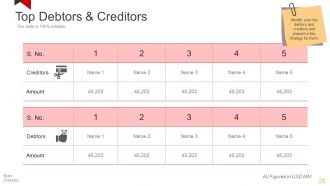
Slide 25: This slide showcases Top Debtors & Creditors table. Identify your top debtors and creditors and prepare a key strategy for them.
Slide 26: This slide presents Client Updates showcasing Major Clients Acquired, New Clients Acquired.
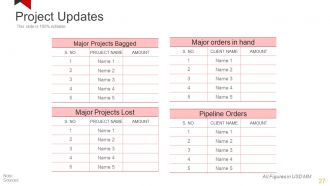
Slide 27: This is a Project Updates table slide. State major specifications etc. here.
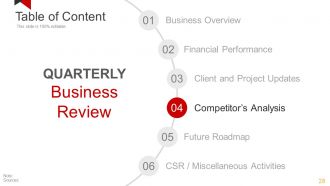
Slide 28: This slide presents Table of Content of QUARTERLY Business Review focusing on- Competitor’s Analysis
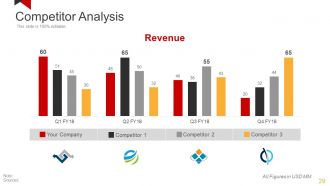
Slide 29: This is a Competitor Analysis slide in bar graph form.
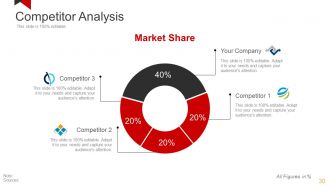
Slide 30: This is a Competitor Analysis slide in pie chart form showing market share.
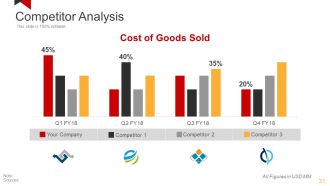
Slide 31: This slide presents Competitor Analysis with the following parameter of- Cost Of Goods Sold.
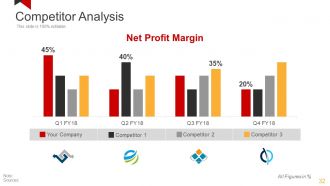
Slide 32: This slide presents Competitor Analysis with the following parameter of- Net Profit Margin.
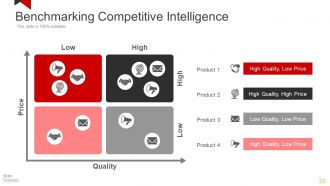
Slide 33: This slide showcases Benchmarking Competitive Intelligence matrix with parameters of- High and Low, Quality & Price.
Slide 34: This slide presents Table of Content of QUARTERLY Business Review focusing on- Future Roadmap
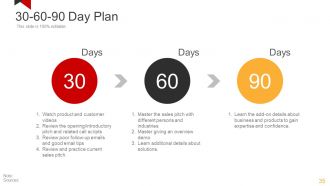
Slide 35: This slide presents a 30-60-90 Day Plan.
Slide 36: This slide showcases Light Bulb With Time Planning Ideas with bulb image and text boxes.
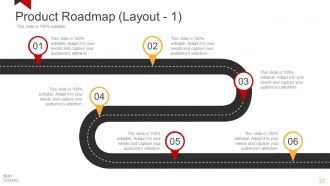
Slide 37: This slide showcases a Product Roadmap for presenting product growth, highlights, evolution etc.
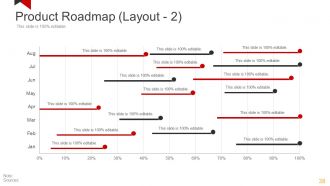
Slide 38: This slide showcases a Product Roadmap Swimlane for presenting product growth, highlights, evolution etc.
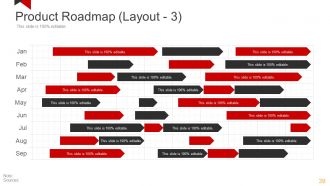
Slide 39: This slide also showcases a Product Roadmap for presenting product growth, highlights, evolution etc.
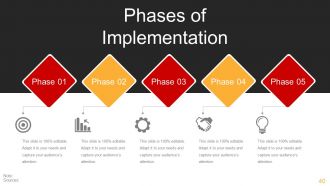
Slide 40: This slide showcases Phases of Implementation with relevant imagery and text boxes to state information etc.
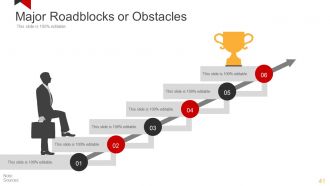
Slide 41: This slide displays Major Roadblocks or Obstacles with relevant imagery and text boxes to state information etc.
Slide 42: This slide also displays Major Roadblocks or Obstacles with relevant imagery and text boxes to state information etc.
Slide 43: This slide presents a SWOT Analysis. State analysis aspects here.
Slide 44: This slide presents Table of Content of QUARTERLY Business Review focusing on- CSR / Miscellaneous Activities
Slide 45: This slide shows Corporate Social Responsibility with imagery. State specific aspects here.
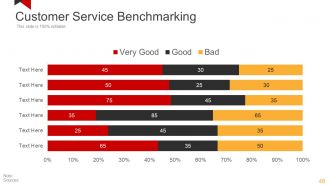
Slide 46: This slide presents Customer Service Benchmarking.
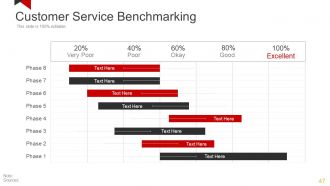
Slide 47: This slide also presents Customer Service Benchmarking in gantt chart form.
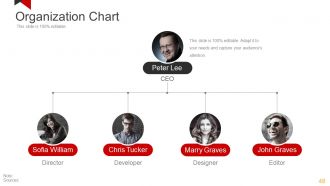
Slide 48: This is an Organization Chart slide in hierarchy form. State company/team specifications, information here.
Slide 49: This slide displays Goals and Success Metrics in in hierarchy form.
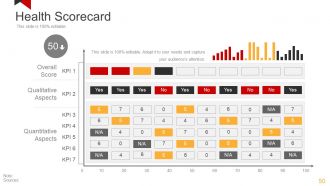
Slide 50: This slide shows a Health Scorecard covering- Overall Score, Qualitative Aspects, Quantitative Aspects.
Slide 51: This slide presents Icons for Business Performance Analysis and Planning. Use them as per requirement.
Slide 52: This slide is titled Additional Slides to move forward. You can change the slide content as per need
Slide 53: This slide showcases Our Vision. Show your company vision, mission and goals here
Slide 54: This is an About Us slide. State team/company specifications here.
Slide 55: This slide showcases Our team with name, designation and image boxes.
Slide 56: This is My Goal slide. State your goals here.
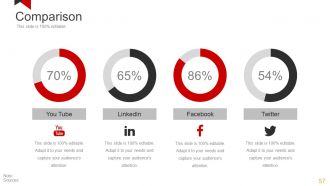
Slide 57: This slide showcases Comparison of two entities in donut chart imagery form.
Slide 58: This is a Financial score slide. State financial aspects, information etc. here.
Slide 59: This is a Quotes slide to convey company/organization message, beliefs etc. You may change the slide content as per need.
Slide 60: This is a Timeline slide to show company growth, milestones evolution etc.
Slide 61: This is an Important Notes slide to mark reminders, events or anything important.
Slide 62: This slide showcases Puzzle imagery. Present information, specifications etc. here.
Slide 63: This slide shows Target image with text boxes. Present information, specifications etc. here.
Slide 64: This is a Venn Diagram image slide. State information, specifications etc. here.
Slide 65: This is Generate an Idea brain bulb image slide to state information, innovative aspects, specifications etc.
Slide 66: This slide presents a Matrix in terms of high and low. Present information, specifications etc. here.
Slide 67: This is a Silhouettes image slide. State people related information, specifications, solutions etc. here.
Slide 68: This is a Funnel image slide to show product/entity information, funneling aspects etc.
Slide 69: This slide is titled Our Charts to move forward. You can change the content as per need.
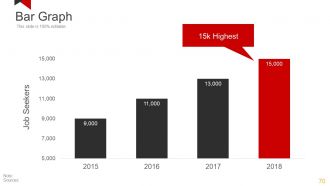
Slide 70: This is a Bar Graph slide to show product/entity comparison, specifications etc.
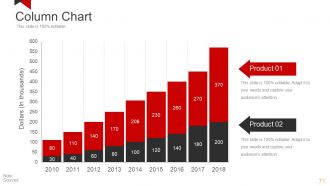
Slide 71: This is a Column Chart slide to show information, comparison specifications etc.
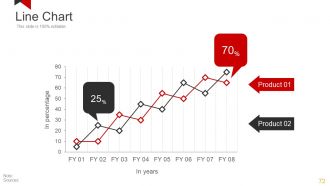
Slide 72: This is a Line Chart slide to show product/entity comparison, specifications etc.
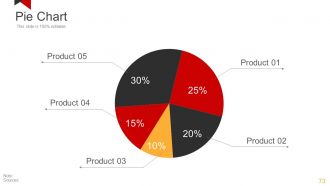
Slide 73: This is a Pie Chart slide to show product/entity comparison, specifications etc.
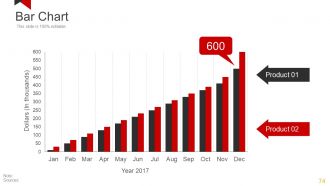
Slide 74: This is a Bar Chart slide to show product/entity comparison, specifications etc.
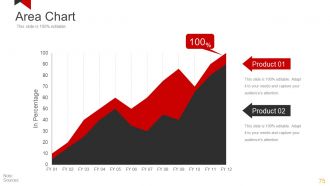
Slide 75: This is an Area Chart slide to show product/entity comparison, specifications etc.
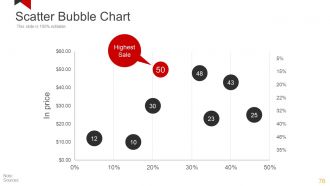
Slide 76: This is a Scatter Bubble Chart slide to show product/entity comparison, specifications etc.
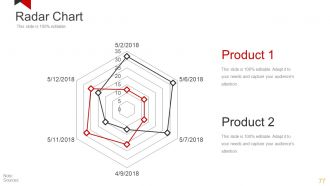
Slide 77: This is a Radar Chart slide to show product/entity comparison, specifications etc.
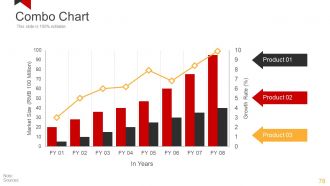
Slide 78: This is a Combo Chart slide to show information, comparison specifications etc.
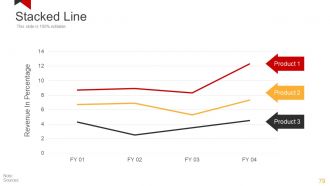
Slide 79: This is a Stacked Line graph slide to show product/entity comparison, specifications etc.
Slide 80: This is a Thank You slide with Email, Address# street number, city, state, Contact Numbers.
Business performance analysis and planning powerpoint presentation slides with all 80 slides:
Applaud the jubilant with our Business Performance Analysis And Planning Powerpoint Presentation Slides. Highlight the intelligence they have displayed.


FAQs for Business performance analysis and planning
Honestly, just stick to the basics that actually matter for your business. Revenue growth, customer acquisition cost, and profit margins - those are your bread and butter. Customer lifetime value is huge too (way more founders should pay attention to this). Retention rates will show if people actually like what you're doing. After that, throw in some operational stuff like conversion rates and cash flow. But seriously, don't track everything under the sun or you'll get lost in spreadsheets. Five to seven metrics tops. Review monthly and make sure your team gets what actually drives results.
Look, qualitative data is basically the "why" behind your numbers. Revenue charts show growth, but customer interviews tell you if people actually like your new feature or hate your checkout process. Without that context? Numbers can be super misleading tbh. Employee feedback explains if productivity drops are from burnout or just crappy tools. Survey responses and focus groups give you the real story. Even random customer chats help. Trust me - your quarterly reviews will be so much better when you can actually explain trends instead of just reading off charts.
Honestly, benchmarking is huge because otherwise you're just guessing if your numbers are any good. Like, maybe you're pumped about a 15% profit margin, but then you find out everyone else in your space is hitting 25% - ouch. It's basically like checking how you did on a test compared to everyone else in class. You'll spot where you're actually crushing it versus where you just think you are. Plus it shows you blind spots you didn't even realize existed. Trade associations usually have solid industry reports with all the key stuff, or you can check out research firms. Those are good starting points.
Honestly, try Tableau or Power BI - they'll save your sanity. Those endless Excel rows become actual visual stories you can follow. Trends jump out at you instead of hiding in cell B47 or wherever. Plus presenting to your boss gets so much easier when you're not flipping through spreadsheet tabs like some accountant from 1995. You can drill into specific numbers, compare different time periods, set up reports that update themselves. I'd start small though - pick your main KPIs and build one basic dashboard first. Don't go crazy trying to visualize everything at once.
Honestly, the worst mistake is getting obsessed with metrics that look cool but don't actually move the needle for your business. Cherry-picking timeframes is another trap - like only showing the good months, you know? Don't look at stuff in isolation either. Revenue going up sounds great until you realize you're bleeding money on customer acquisition. I've seen people get so deep in spreadsheets they forget what they're even trying to figure out. Start backwards - what decision are you making? Then pick metrics that actually help answer that question.
Look at inventory turnover first - shows how fast they're moving products. Asset turnover tells you if they're actually using resources well to make sales. Then check receivables turnover for payment collection speed. Honestly, I've watched companies with killer revenue numbers that were complete messes behind the scenes. These ratios give you the real picture beyond just sales figures. Compare them to industry standards and track changes over time - that's where you'll spot the patterns. Start with those three and you'll catch operational problems before they blow up.
Oh man, external stuff will totally mess with your business analysis if you're not careful. Like during 2020 - everyone's numbers went completely sideways! Economic crashes, supply chain issues, new regulations - all that noise makes it look like your strategy sucks when really it's just outside forces screwing things up. I always compare against industry peers now and throw some economic indicators into the mix. Honestly, the biggest question is: did we cause this change or did it just happen to us? Makes all the difference.
Look, most companies screw this up by treating HR data like it's completely separate from actual business results - which makes zero sense when you think about it. Connect your people metrics directly to what matters: revenue per employee, how productivity affects customer scores, that kind of stuff. First figure out which employee behaviors actually move the needle on your business outcomes. Then build dashboards showing both sides together. Like if your sales team's daily activities correlate with quarterly numbers, track them side-by-side. The trick is proving causation, not just correlation. Otherwise you're just guessing when it comes to talent decisions.
Set up automated checks first - catch duplicates, missing data, weird outliers that make zero sense. Cross-check against other sources too. Honestly though? Sometimes just looking at your results with fresh eyes works wonders. If revenue magically jumped 500%, you know something's wonky. Keep a simple audit trail so you can trace where numbers came from (saved my butt more than once). Monthly team reviews are clutch for spotting problems early. Oh, and don't skip regular data cleaning - I know it's boring but it prevents headaches later.
Honestly? Quarterly is your best bet for most stuff. Monthly can work but you'll drown in data - trust me on this one. Cash flow though? That needs weekly check-ins since it moves crazy fast. I'd say pick quarterly for all your big KPIs first. Way better to nail solid reviews every three months than do crappy monthly ones you rush through. Once that becomes second nature, then maybe add monthly deep-dives for whatever keeps you up at night. Consistency beats frequency every time.
Customer feedback basically gives you a cheat sheet for fixing what's broken. When people complain about slow response times, boom - you know why your satisfaction scores suck. Look for patterns in what customers keep saying, then match those issues to where your metrics are tanking. The positive stuff is gold too since it shows what's actually working. I'd start by grouping similar complaints together - it makes the problems way more obvious. Oh, and don't sleep on retention feedback because those insights usually point to your biggest revenue leaks. It's honestly the fastest way to stop guessing and start improving the right things.
So basically, these dashboards let you see all your important stuff in real-time - revenue, KPIs, whatever matters most to your business. No more waiting around for monthly reports or hunting through Excel hell. You'll catch issues way earlier and your whole team stays on the same page since everyone's looking at identical data. Game changer for moving from always putting out fires to actually getting ahead of problems. Oh, and don't go crazy at first - pick like 5-7 key metrics max. Trust me on this one, cramming everything makes it useless.
Dude, AI can totally transform how you analyze performance data. It catches patterns you'd miss completely and crunches huge amounts of info instantly. The algorithms actually learn and get better over time, which is honestly pretty wild. You'll spot problems way faster and figure out what's really causing issues. Plus it cuts out human bias - we're all guilty of seeing what we want to see sometimes. Future predictions become way more reliable too. My advice? Don't go crazy right away. Test it on something specific like sales trends first, then expand from there.
You need to turn all that data into actual tasks with real deadlines and owners. Figure out your biggest gaps first - honestly, trying to tackle everything at once is a recipe for disaster. Pick the stuff that'll actually make a difference and create specific goals for each one. Assign them to actual people with dates that aren't completely unrealistic. Set up check-ins so you can see what's working and what isn't. Oh, and don't let those insights just die in some presentation nobody looks at again. Build in ways to hold people accountable or nothing will change.
Look, if your strategy and metrics don't match up, you're basically throwing darts blindfolded. Say you want better customer retention but only track sales numbers - makes zero sense, right? Companies do this ALL the time and wonder why they're spinning their wheels. You end up chasing shiny metrics that feel good but accomplish nothing. Quick fix: compare your current KPIs to what you're actually trying to achieve. I bet you'll find some weird gaps. Focus on stuff that moves your real goals forward, not just whatever's easiest to measure.
-
Commendable slides with attractive designs. Extremely pleased with the fact that they are easy to modify. Great work!
-
The Designed Graphic are very professional and classic.