Financial analysis serves as the "beating heart" of every thriving organization, providing the pulse on managing money and fueling overall performance. It examines and interprets financial data, allowing businesses to assess their financial health, identify trends, and make informed decisions.
Companies gain insights revenue generation, profitability, cash flow, and expenditure patterns by conducting financial analysis. It helps them understand financial strengths and weaknesses, enabling strategic planning and resource allocation. With accurate financial analysis, organizations can identify areas for improvement, optimize operational efficiency, and capitalize on growth opportunities. Financial analysis facilitates effective risk management by identifying and evaluating potential financial risks and uncertainties. By analyzing financial ratios of businesses’ vital health indicators such as liquidity, solvency, and profitability, organizations can assess their financial stability and resilience across market conditions.
Business planners and owners understand the value of regular financial analysis, which helps them maximize profitability by monitoring their financial health. However, when it comes to creating financial analysis reports and proposals, they often find it daunting. If so, you may not have downloaded SlideTeam's financial analysis Templates yet.
Dive into this blog to discover SlideTeam's templates on financial analysis, valid across industries. With minimalist designs radiating professionalism, these presentation templates empower you to showcase your financial analysis services and connect with potential clients.
Take a look.
Template 1: Enterprise Financial Analysis PowerPoint Presentation Slides
This PPT Template is ideal for creating a comprehensive and professional presentation on economic forecasting. These slides give you the tools to showcase financial forecasting, planning, and budgeting aspects. The presentation design includes visually-appealing graphics and charts to present balance sheets, cash flow statements, financial projections, key financial ratios, liquidity ratios, profitability ratios, activity ratios, solvency ratios, and an overview of the income statement. These slides will enable you to deliver a detailed and insightful presentation on financial analysis with ease and clarity.
Template 2: Financial Analysis In Healthcare Industry PowerPoint Presentation Slides
These slides offer tools for conducting accounting analysis and visualizing healthcare financing models, industry key statistics, and healthcare marketing trends. Use this comprehensive financial management PPT Slideshow to highlight two prominent healthcare marketing trends: Patient generation and conversion. Additionally, leverage our healthcare analytics PowerPoint infographics to illustrate health care financing models, including social and voluntary health insurance. With these presentation slides, you can facilitate a global comparison of healthcare expenditure, providing a comprehensive view of financial analysis in the healthcare sector.
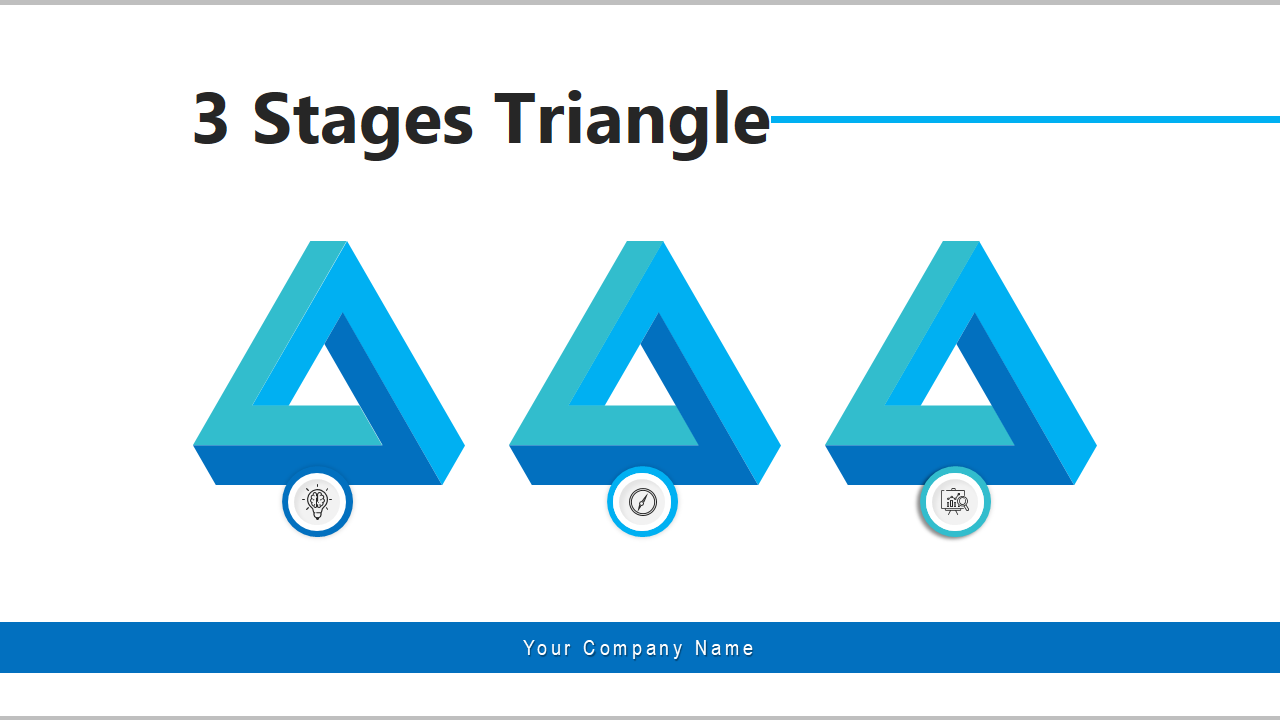
Template 3: Three-stages Triangle Individual Business Process Horizontal Triangle Financial Analysis
Conduct a detailed financial analysis of an individual business process. The template consists of three interconnected triangles, each representing a distinct analysis stage. The first stage involves gathering and organizing critical financial data, including statements and relevant information. The second stage entails data analysis using ratios, trends, and quantitative techniques. The third stage focuses on documenting and communicating findings of the analysis through clear reports and presentations. This presentation template facilitates a systematic approach, enabling users to get insights into the financial performance of a specific business process.
Template 4: Startup Company Profile Timeline Organizational Structure Financial Analysis Process
Grab this tool to showcase your startup's journey, organizational structure, and financial analysis. This PPT Template offers a comprehensive framework that captures the essence of your startup's growth over time, allowing you to highlight key milestones, achievements, and strategic initiatives. With its intuitive timeline design, you can present your startup's evolution from its inception to its current stage, demonstrating progress and significant milestones achieved. The aim is to stay true to the numbers and weave a story that helps people understand the significance of the ratios.
Template 5: Results Candidates Election Presidential Performance Appraisal Financial Analysis Business
Discover essential insights and tools you need to make informed decisions with this template. Evaluate each candidate's campaign's financial effectiveness and efficiency using the detailed performance appraisal section. Analyze return on investment and cost per vote to assess the value derived from their financial resources. Gain a comprehensive understanding of the broader business implications of presidential elections by exploring economic impacts, market trends, and potential effects on industries and sectors. Grab it now to uncover financial insights and assess candidates' performance.
Template 6: Pie Chart Business Financial Analysis Financial Performance Representation
With this template, you can effectively present critical financial data using pie-charts, enabling easy comparison and understanding of components such as revenue, expenses, profit margins, and market share. This presentation template helps you analyze and communicate financial information clearly and concisely, making it an ideal tool for business financial analysis and reporting.
Template 7: Summarize Financial Analysis Growth Business Achievements Magnifying
This PPT Template showcases your business's financial analysis findings. It highlights vital growth metrics and achievements, making it easy for stakeholders to grasp essential information quickly. You can showcase the growth trajectory of your business over time by presenting critical metrics in an understandable format. The template saves time with its ready-made framework and is customizable to suit your business needs and branding requirements.
Template 8: Telecom Business Plan Marketing Strategies Successful Assessments Financial Analysis Success
This powerful tool helps you outline your objectives, target market, and competitive analysis. Using the template structure, you can devise effective marketing strategies and develop accurate financial projections. Keep track of your business's success over time, set goals, monitor progress, and evaluate achievements. Stay ahead of the game and make necessary adjustments to secure long-term success. Download it now to pave the way to telecom triumph!
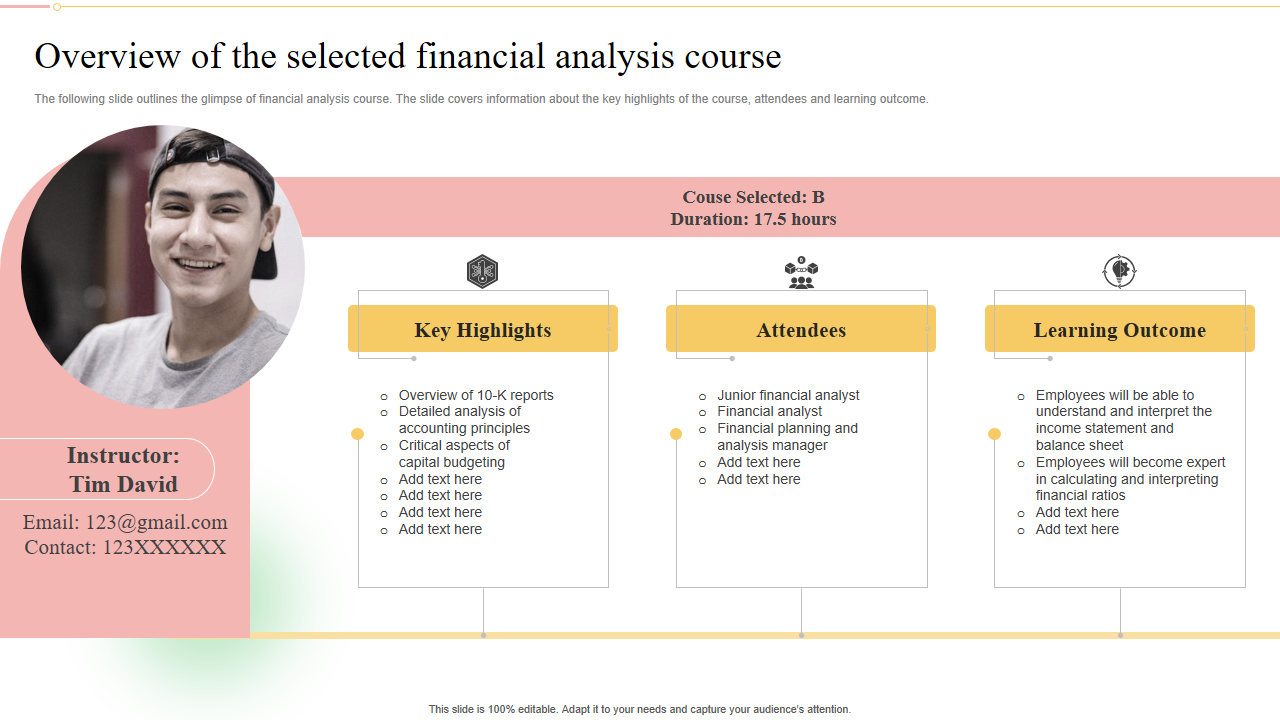
Template 9: Overview of the Selected Financial Analysis Course Ultimate Guide To Financial Planning
This PPT Slide provides a clear overview of financial analysis, equipping you with essential knowledge and skills to make informed financial decisions. From understanding financial statements to analyzing ratios and creating financial projections, it covers all aspects of financial planning. This PPT Template provides you with the knowledge and resources to flourish in finance, whether a novice or a seasoned pro. Don't pass up this priceless resource; download it now.
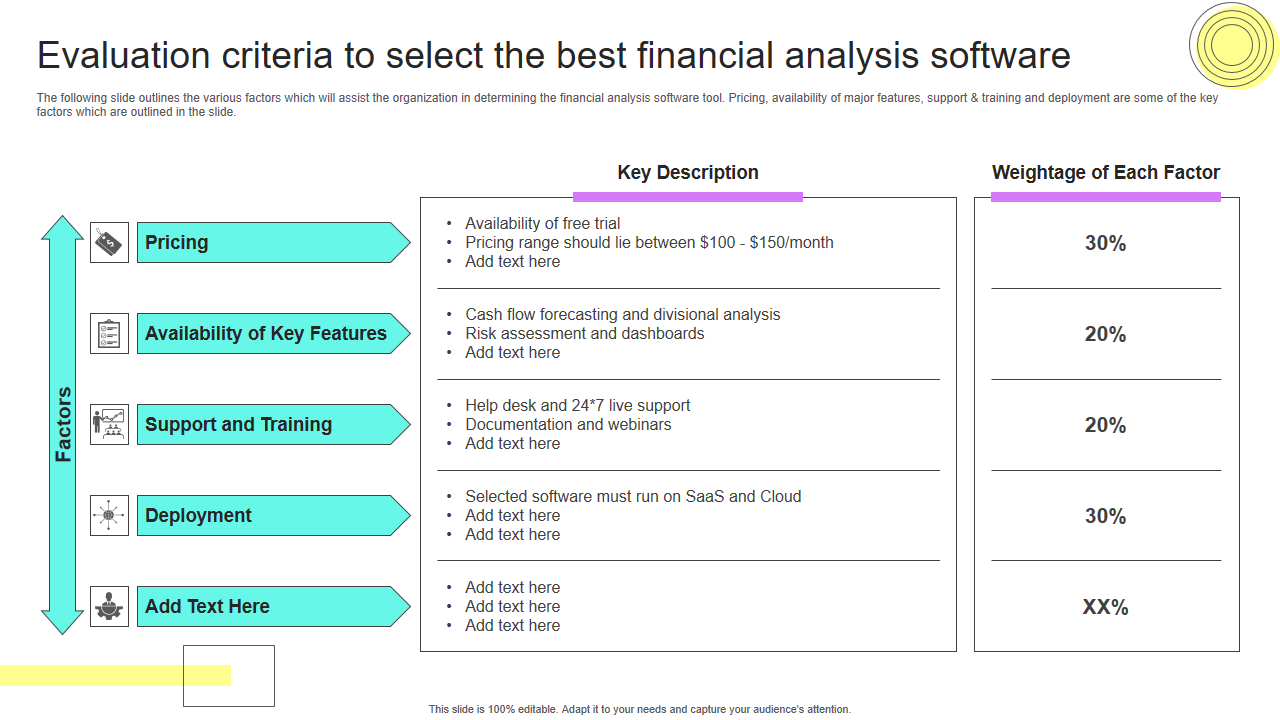
Template 10: Evaluation Criteria to Select the Best Financial Analysis Financial Planning Analysis Guide Small Large Businesses
This PPT template provides a concise and compelling framework to assess and choose the ideal resource. With this template, you can define and evaluate characteristics such as competence, comprehensiveness, practicability, and user-friendliness. It simplifies the decision-making process, helping you choose the best guide for your organization. Take the uncertainty out of selecting a financial analysis and planning guide and make an informed decision for the future of your business. We highlight the five factors as pricing, availability of key features, support and training, and deployment, with weights that you can assign in terms of their importance.
GIVE MEANING TO FINANCE!
With suitable financial analysis templates, you can streamline your analysis process, save time, and present your findings professionally and visually appealingly. So, why wait? Take advantage of our financial analysis templates today and unlock the power of data-driven insights for your business's growth and profitability. Empower your financial analysis with our templates and make smarter financial decisions.
PS: Is your business utilizing its resources to the fullest? Use our cost analysis templates to find out!
FAQs on Financial Analysis
What are the three types of financial analysis?
Financial analysis involves three main approaches: ratio analysis, trend analysis, and cash flow analysis.
- Ratio analysis calculates financial ratios to evaluate a company's performance in terms of profitability, liquidity, solvency, efficiency, and market valuation.
- Trend analysis examines financial data over time to identify patterns and trends, helping assess performance and make projections.
- Cash flow analysis assesses the inflows and outflows of cash, examining sources, uses, and the company's ability to meet financial obligations.
What are the five components of financial analysis?
The financial analysis consists of five key components:
- Financial statements: These documents, encompassing the balance sheet, income statement, and cash flow statement, capture this numbers at that particular moment in time into the financial standing, operational achievements, and cash flow engagements of a corporation.
- Ratios and Metrics: A company's ability to examine aspects of its financial health and operational effectiveness, such as its potential for profitability, liquidity, and efficiency, is aided by the computation and analysis of financial ratios and measurements.
- Comparative Analysis: By juxtaposing a company's financial information against industry standards, competitor achievements, or past periods, analysts acquire valuable insights regarding its relative position, strengths, weaknesses, and growth opportunities.
- Trend Analysis: Examining financial data over time enables identification of patterns, trends, and changes in key financial indicators. This analysis aids in assessing a company's financial performance direction, potential risks, and opportunities and making forecasts.
- Qualitative Factors: Besides quantitative data, financial analysis incorporates qualitative factors such as management quality, industry trends, competitive landscape, and economic conditions. These factors provide context and enhance the interpretation of financial data.
What are the types of financial analysis?
Financial analysis offers insights into a company's performance, position, and prospects. Ratio analysis includes calculating and interpreting financial ratios to evaluate profitability, liquidity, and market valuation. Trend analysis examines patterns and changes in critical indicators for forecasting and identifying strengths and weaknesses. Cash flow analysis assesses the company's ability to generate and manage cash. A comparative analysis compares the company's performance to industry benchmarks or competitors. The qualitative analysis considers non-financial factors for a more holistic understanding. Utilizing both sorts of analysis at once allows for a thorough assessment of a company's financial standing.
What is a financial analysis example?
In a financial analysis example, an analyst may assess a company's profitability by calculating the gross profit margin, the ratio of gross profit to sales. It helps evaluate the profitability of its core operations. Another example is analyzing liquidity by calculating the current ratio, which assesses the company's ability to fulfill short-term obligations by comparing current assets to current liabilities.


 Customer Reviews


