


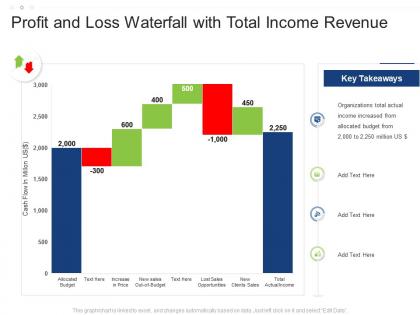
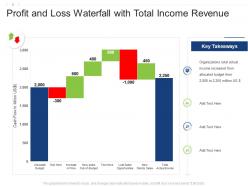
Profit and loss waterfall with total income revenue




Try Before you Buy Download Free Sample Product
 Impress Your
 Audience
 100%
100% Editable
 Save Hours
 of Time


Our Profit And Loss Waterfall With Total Income Revenue are topically designed to provide an attractive backdrop to any subject. Use them to look like a presentation pro.
People who downloaded this PowerPoint presentation also viewed the following :
Profit and loss waterfall with total income revenue with all 2 slides:
Use our Profit And Loss Waterfall With Total Income Revenue to effectively help you save your valuable time. They are readymade to fit into any presentation structure.
FAQs for Profit and loss waterfall with
A Profit and Loss Waterfall chart is a visual representation that breaks down the journey from revenue to net profit, showing how each component like costs, expenses, and taxes incrementally affects profitability. This analytical tool enables financial teams to identify profit drivers and problem areas across different business segments, with many organizations finding that waterfall charts streamline budget reviews and strategic planning by highlighting specific areas requiring operational focus or cost optimization.
A Profit and Loss Waterfall chart visually represents financial changes by displaying sequential bars that show how revenue flows through various expense categories, with each bar representing additions or subtractions from the starting revenue to reach net profit. This visualization enables finance teams to quickly identify which expense categories most significantly impact profitability, with many organizations finding that waterfall charts streamline budget reviews and strategic planning.
Key components include revenue breakdown, cost of goods sold, operating expenses, EBITDA, depreciation and amortization, interest expenses, taxes, and net income progression. These elements enable organizations to visualize financial performance through sequential flow analysis, helping stakeholders understand profit drivers and cost impacts, while facilitating strategic decision-making and performance optimization across departments.
A Profit and Loss Waterfall enables businesses to visualize sequential changes in profitability by displaying how revenue flows through various cost categories, operational expenses, and market factors over time. This approach helps organizations identify declining margins, seasonal patterns, and cost inflation trends, while pinpointing specific areas driving profitability changes, ultimately delivering actionable insights for strategic financial planning.
A Profit and Loss Waterfall chart enhances stakeholder understanding by visually breaking down revenue changes, cost variations, and profit drivers step-by-step, making complex financial movements immediately comprehensible. This approach enables executives, investors, and board members to quickly identify which business segments, product lines, or operational factors contributed most significantly to performance changes, ultimately delivering clearer accountability and more strategic decision-making during presentations.
Common mistakes include using inconsistent data sources, incorrect starting and ending values, missing intermediate steps, poor visual formatting, and failing to validate calculations. These errors undermine analytical accuracy, with many finance teams finding that standardized templates, regular data reconciliation, and clear labeling protocols streamline chart creation while ensuring reliable variance analysis for strategic decision-making.
Varying formats of Profit and Loss Waterfall templates cater to different industries by incorporating sector-specific metrics, revenue streams, and cost structures tailored to unique business models. Manufacturing templates emphasize raw materials and production costs, while service industries focus on labor and operational expenses, with retail formats highlighting inventory turnover and seasonal variations, ultimately enabling organizations to track financial performance through industry-relevant frameworks that enhance strategic decision-making.
A Profit and Loss Waterfall chart supports financial strategy decision-making by providing clear visualization of revenue drivers, cost components, and profit bridges between periods, enabling executives to identify specific performance gaps and opportunities. Through detailed variance analysis, organizations can pinpoint underperforming segments, optimize resource allocation, and develop targeted improvement strategies, ultimately delivering enhanced operational efficiency and strategic clarity for stakeholders.
**INPUT**: What software tools are best suited for creating visually compelling Profit and Loss Waterfall charts? **OUTPUT**: Leading tools for P&L waterfall charts include Microsoft Excel with advanced charting, Tableau, Power BI, Qlik Sense, and specialized financial visualization platforms like Anaplan or Adaptive Insights. These solutions streamline financial reporting by automating data connections, enabling real-time updates, and delivering interactive dashboards, with many finance teams finding that professional visualization tools significantly enhance stakeholder comprehension and decision-making speed.
Interactive elements in Profit and Loss Waterfall templates include clickable chart segments, hover-over data tooltips, animated flow transitions, collapsible variance breakdowns, and dynamic filtering options. These features enhance stakeholder engagement by enabling real-time exploration of profit drivers, variance analysis, and scenario modeling, ultimately delivering more compelling financial presentations and deeper audience understanding.
Color plays a critical role in Profit and Loss Waterfall charts by enabling instant visual interpretation, with green typically representing positive contributions, red indicating negative impacts, and neutral colors for starting/ending values. This strategic color coding streamlines financial analysis by allowing stakeholders to quickly identify profit drivers, cost drains, and overall performance trends, ultimately delivering enhanced comprehension and faster decision-making across organizations.
A clear Profit and Loss Waterfall enhances financial communication by visually breaking down revenue changes, cost variations, and profit drivers, making complex financial movements easily digestible for stakeholders. This transparency enables executives to quickly identify performance trends, facilitates more informed strategic discussions during board meetings, and ultimately delivers stronger investor confidence and stakeholder trust.
Seasonality and market fluctuations significantly impact Profit and Loss Waterfall interpretation by creating variance patterns that require contextual analysis, trend normalization, and comparative period adjustments. These external factors influence revenue cycles, cost structures, and margin fluctuations, with many financial analysts finding that incorporating seasonal baselines and market volatility metrics enhances forecasting accuracy and strategic decision-making.
Businesses leverage historical data with Profit and Loss Waterfalls by analyzing past revenue patterns, cost trends, and margin fluctuations to identify seasonal variations, growth trajectories, and expense behaviors across different periods. This strategic combination enables organizations to build more accurate forecasting models, anticipate market shifts, and optimize resource allocation, with many financial teams finding that historical waterfall analysis delivers enhanced budgeting precision and competitive advantage.
Businesses with complex revenue streams, multiple cost centers, or frequent financial fluctuations benefit most from Profit and Loss Waterfall charts, including retail chains, manufacturing companies, consulting firms, and technology startups. These organizations can streamline financial analysis by visualizing step-by-step profit changes, identifying specific impact areas, and enhancing stakeholder communication, ultimately delivering clearer insights and faster strategic decision-making.
-
Design layout is very impressive.
-
Out of the box and creative design.
-
Enough space for editing and adding your own content.