

Diapositivas de presentación de Powerpoint de descripción del proyecto






Try Before you Buy Download Free Sample Product
 Impress Your
Audience
 100%
Editable
 Save Hours
of Time


Su experiencia es reconocida con nuestras diapositivas de presentación de PowerPoint de descripción de proyecto. Tenga la seguridad de obtener contratos.
People who downloaded this PowerPoint presentation also viewed the following :
Contenido de esta presentación de Powerpoint
Diapositiva 1 : esta diapositiva presenta la descripción del proyecto. Indique el nombre de su empresa y comience.
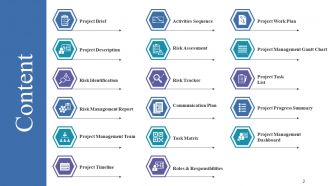
Diapositiva 2 : esta diapositiva muestra el contenido de la presentación.
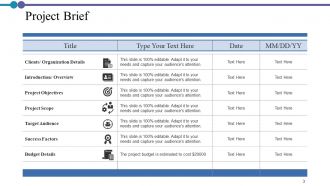
Diapositiva 3 : esta diapositiva presenta el resumen del proyecto en forma de tabla.
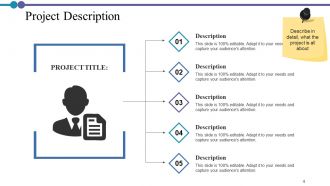
Diapositiva 4 : esta diapositiva muestra la descripción del proyecto con imágenes y cuadros de texto relacionados.
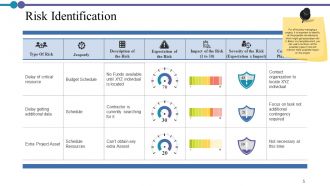
Diapositiva 5 : Esta diapositiva representa la Identificación de riesgos en forma de tabla.
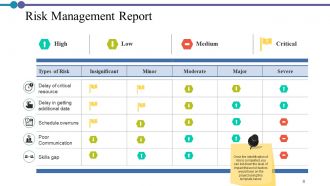
Diapositiva 6 : Esta diapositiva muestra el Informe de gestión de riesgos con los parámetros: Alto, Bajo, Medio, Crítico.
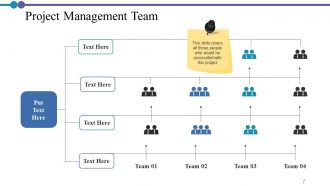
Diapositiva 7 : Esta diapositiva muestra el equipo de gestión de proyectos con nombres y designaciones.
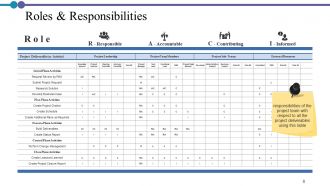
Diapositiva 8 : Esta diapositiva presenta las funciones y responsabilidades en forma de tabla.
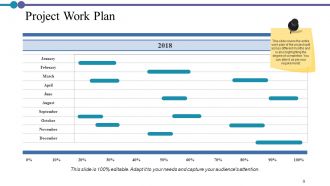
Diapositiva 9 : Esta diapositiva muestra el plan de trabajo del proyecto dividido en diferentes meses y también destaca el grado de finalización.
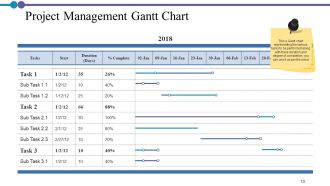
Diapositiva 10 : Esta diapositiva representa el diagrama de Gantt de gestión de proyectos.
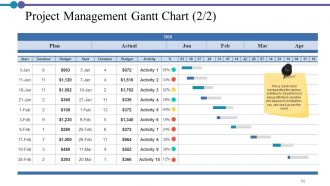
Diapositiva 11 : Esta es otra diapositiva que representa el diagrama de Gantt de gestión de proyectos.
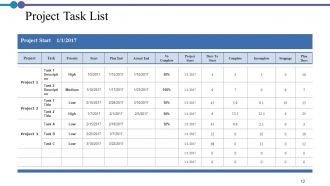
Diapositiva 12 : Esta diapositiva muestra la Lista de tareas del proyecto en forma tabular.
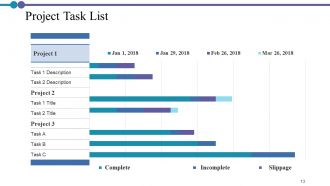
Diapositiva 13 : Esta diapositiva muestra la Lista de tareas del proyecto con parámetros como: Completo, Incompleto, Deslizamiento.
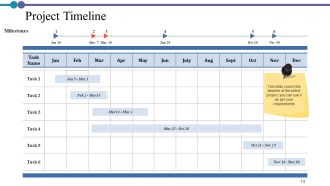
Diapositiva 14 : esta diapositiva presenta el cronograma del proyecto para todo el proyecto.
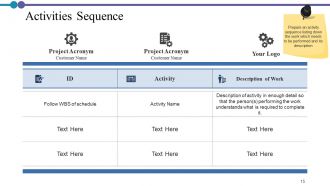
Diapositiva 15 : Esta diapositiva muestra la secuencia de actividades con: acrónimo del proyecto, nombre del cliente, etc.
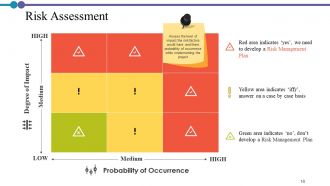
Diapositiva 16 : Esta diapositiva representa la Evaluación de riesgos para evaluar el nivel de impacto que tendrían los factores de riesgo y la probabilidad de que ocurran durante la implementación del proyecto.
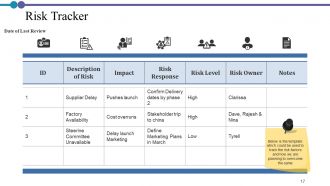
Diapositiva 17 : Esta diapositiva muestra el Rastreador de riesgos en forma de tabla.
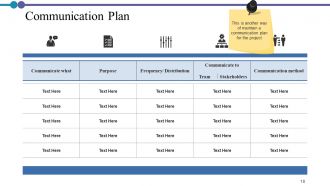
Diapositiva 18 : Esta diapositiva muestra el plan de comunicación para mantener la comunicación para el proyecto.
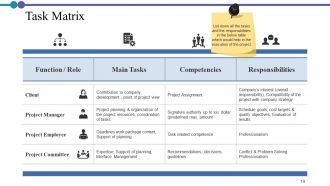
Diapositiva 19 : Esta diapositiva presenta la matriz de tareas que describe la función / rol, las principales tareas, responsabilidades, etc.
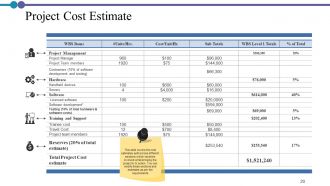
Diapositiva 20 : Esta diapositiva muestra la Estimación de costos del proyecto con los costos divididos en diferentes secciones que estarían involucradas al llevar el proyecto a la acción.
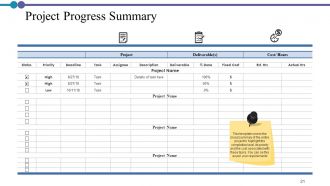
Diapositiva 21 : Esta diapositiva representa el Resumen de progreso del proyecto en forma de tabla.
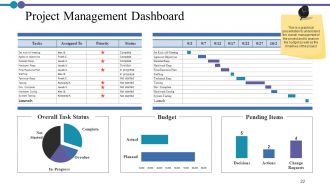
Diapositiva 22 : Esta diapositiva muestra el panel de gestión de proyectos que describe: elementos pendientes, presupuesto, estado general de la tarea, etc.
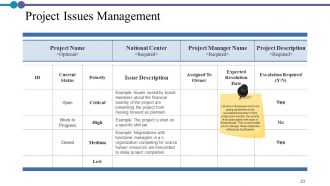
Diapositiva 23 : Esta diapositiva muestra la Gestión de problemas del proyecto enumerando los problemas que actúan como barreras en la ejecución exitosa del proyecto y menciona el nivel de prioridad asociado con cada uno de estos problemas. Esto le permitiría gestionar estos obstáculos de forma eficaz y eficiente.
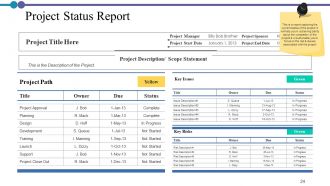
Diapositiva 24 : Esta diapositiva presenta el Informe de estado del proyecto.
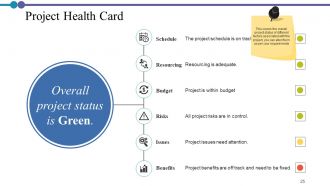
Diapositiva 25 : Esta diapositiva muestra la Tarjeta de salud del proyecto con: Programa, Recursos, Presupuesto, Riesgos, Problemas, Beneficios.
Diapositiva 26 : Esta diapositiva muestra los iconos de descripción del proyecto.
Diapositiva 27 : Esta diapositiva recuerda una pausa para el café de 30 minutos.
Diapositiva 28 : esta diapositiva se titula Cuadros y gráficos para avanzar.
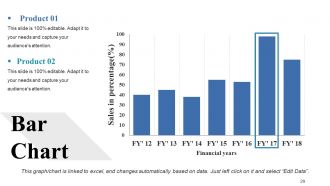
Diapositiva 29 : Esta diapositiva muestra un gráfico de barras con la comparación de dos productos.
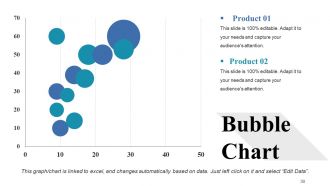
Diapositiva 30 : Esta diapositiva presenta el gráfico de burbujas con una comparación de dos productos.
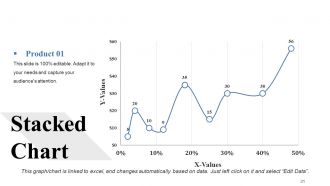
Diapositiva 31 : esta diapositiva muestra Gráfico apilado.
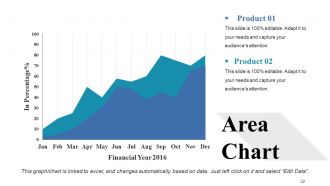
Diapositiva 32 : Esta diapositiva representa el gráfico de áreas con la comparación de dos productos.
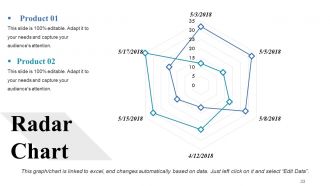
Diapositiva 33 : Esta diapositiva muestra un gráfico de radar para comparar productos.
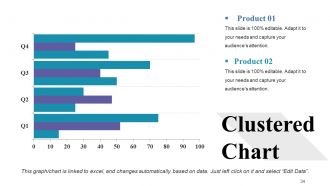
Diapositiva 34 : Esta diapositiva muestra un gráfico agrupado con una comparación de dos productos.
Diapositiva 35 : esta diapositiva se titula Diapositivas adicionales para avanzar.
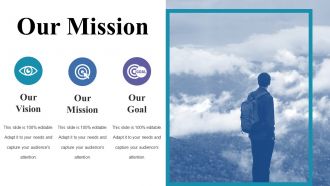
Diapositiva 36 : Esta es la diapositiva Nuestra misión con imágenes y cuadros de texto.
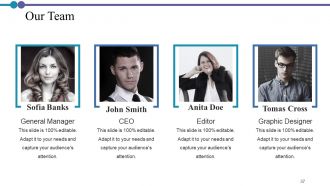
Diapositiva 37 : Esta es la diapositiva de Nuestro equipo con nombres y designaciones.
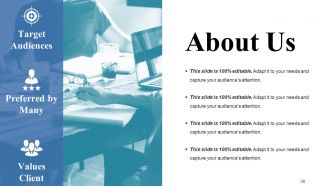
Diapositiva 38 : Esta es la diapositiva Acerca de nosotros para mostrar las especificaciones de la empresa, etc.
Diapositiva 39 : Esta es la diapositiva Nuestro objetivo principal. Muestra tus metas aquí.
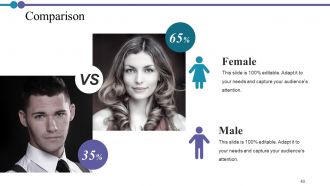
Diapositiva 40 : Esta es una diapositiva de comparación para establecer una comparación entre productos básicos, entidades, etc.
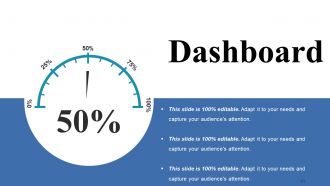
Diapositiva 41 : esta es una diapositiva del Panel de control con cuadros de texto para mostrar información.
Diapositiva 42 : Esta es una diapositiva de Ubicación con mapas para mostrar datos relacionados con diferentes ubicaciones.
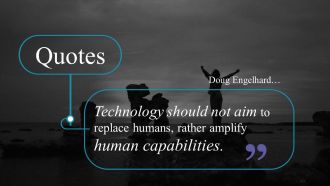
Diapositiva 43 : esta es una diapositiva de Cotizaciones para resaltar o indicar algo específico.
Diapositiva 44 : Esta es una diapositiva financiera. Muestre sus cosas relacionadas con las finanzas aquí.
Diapositiva 45 : esta es una diapositiva de la línea de tiempo. Muestra información relacionada con el período de tiempo aquí.
Diapositiva 46 : Esta es la diapositiva de Nuestro objetivo principal. Muestra tus objetivos aquí.
Diapositiva 47 : esta es una diapositiva de rompecabezas con cuadros de texto para mostrar información.
Diapositiva 48 : Esta diapositiva muestra el mapa mental para representar entidades.
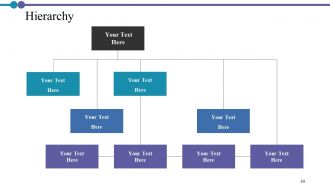
Diapositiva 49 : Esta es una diapositiva de jerarquía. Muestre los datos relevantes en consecuencia.
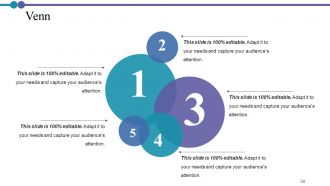
Diapositiva 50 : esta es una diapositiva de Venn con cuadros de texto.
Diapositiva 51 : Esta es una diapositiva de Siluetas para mostrar información específica de las personas, etc.
Diapositiva 52 : Esta es la diapositiva Post It. Publique sus notas importantes aquí.
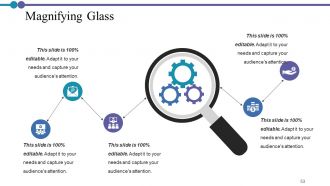
Diapositiva 53 : esta diapositiva muestra una lupa con cuadros de texto.
Diapositiva 54 : Esta es una diapositiva de Bombilla de ideas para expresar una nueva idea.
Diapositiva 55 : Esta es una diapositiva de agradecimiento con dirección, números de contacto y dirección de correo electrónico.
Descripción del proyecto Diapositivas de presentación en PowerPoint con las 55 diapositivas:
Aumente sus posibilidades con nuestras diapositivas de presentación en Powerpoint de descripción del proyecto. Sea competitivo todo el tiempo.



FAQs for Project Description
So you definitely need the basics: objectives, scope, deliverables, timeline with milestones, budget, and who's doing what. I always add background context upfront - makes everything click faster. Success criteria and assumptions are huge but people skip them constantly. Also map out dependencies and risks that could mess things up. Oh, and make your template adaptable but not so loose that you forget critical stuff. Honestly, I'd start simple and tweak it as you go based on what actually matters in practice.
Honestly, visuals are a game changer for presentations. Charts and diagrams help people actually *get* your complex stuff instead of zoning out during explanations. Plus, let's be real - nobody wants to stare at text-heavy slides. You'll keep people way more engaged with mockups or even simple flowcharts. Before/after images work great too. Visuals also make you look like you've got your act together, which doesn't hurt. I always think of it like this - if I can show it instead of saying it, why wouldn't I? Even basic diagrams beat boring descriptions every time.
Dude, you HAVE to figure out who's gonna read this first. Like, are you writing for executives who just want the big picture? Technical people who need all the nitty-gritty details? Or regular users who only care how it'll help them? Each group speaks totally different languages. Your CEO summary can't sound like developer documentation - that's just asking for confusion. I learned this the hard way on my last project, honestly. Figure out your main audience, then write in their style. Match their depth level. Short sentences work great for busy execs. Developers might want longer explanations though. Just don't write for yourself!
Honestly, just think about what each person actually cares about. Executives want the business stuff - ROI, strategic impact, the big picture wins. Technical people need all the detailed methodology and implementation specifics (they'll call you out if you're vague). End users just want to know how this changes their day-to-day work. It's basically like switching how you talk depending on who you're with. Same info, totally different angle. I always figure out their main priorities first, then write around those pain points. Works way better than trying to make one description fit everyone.
Don't be vague - that's the killer. Those generic descriptions that could fit literally any project? Skip them. Same goes for buzzwords like "revolutionary." People see that and immediately tune out. Here's what works better: nail down the exact problem you're fixing and who needs it fixed. Real examples help tons. I always think - could my mom read this and actually get what I'm building? Oh, and don't dump every feature into one messy paragraph. Pick the stuff that matters most. Your description should make someone go "oh, I see why this exists" instead of "...what?"
Definitely stick to 2-3 minutes max - that's like 300-450 words if you're reading notes. Hit the problem, your solution, what you expect to happen. Done. I've watched so many people drone on for 10 minutes about background stuff while everyone's eyes glazed over. Not pretty. Practice out loud beforehand (seriously, do this) and have a backup 1-minute version ready. Oh, and figure out what your audience actually needs to decide on - that's your north star. Don't make them sit through info they don't need.
Think of your project like you're telling a story. What's broken right now? That's your "before" scene. Then walk them through how things will change and what the end result looks like. Seriously, most project pitches are boring as hell - people zone out immediately. But add some characters (your actual users), drama (the messy problem), and a satisfying ending (your solution working), and suddenly people give a damn. Skip the jargon and use real examples instead. Like, don't just say "improved efficiency" - show them what Sarah from accounting will actually experience on Tuesday morning. Makes it stick way better.
Grammarly's pretty solid for catching weird phrasing, and Hemingway Editor helps tighten things up. Canva has some decent project brief templates if you need visuals. I usually just use Google Docs though - way easier when people need to leave comments and collaborate. Actually, here's something that sounds dumb but works: read your description out loud. You'll instantly hear the confusing parts. Oh, and Notion's good too if you're into that whole organized workspace thing. Honestly? Don't stress about fancy tools. Pick whatever you already know and focus on being clear. Most project descriptions fail because they're confusing, not because of the software.
You gotta match your audience's level, honestly. Technical people? Go ahead and use some jargon - it shows you know your stuff. But I've watched so many good projects die because nobody understood the proposal in the first place. Mixed crowds or executives need clearer language with just a sprinkle of tech terms for credibility. Define your acronyms the first time. Understanding beats showing off every time. Here's my quick test: could someone smart but outside your field follow along? If not, dial it back a bit.
Dude, focus on three things: what problem you're fixing, why your solution is actually different (not just "better"), and how big the opportunity is. Make the problem feel real and urgent - something people instantly get. Most descriptions I read are either way too techy or super vague, which kills momentum. Keep it conversational and explain why this matters right now. The market size should excite them but don't go crazy broad or you'll sound delusional. End with specific next steps. What exactly do you need from them?
So figure out your end goal first - like what you actually want to accomplish, not the steps to get there. Write 2-3 super clear outcomes with words like "reduce" or "increase." One sentence each, max. Honestly, your stakeholders will be way happier if you skip the jargon completely. Focus on business results, not technical stuff. Each goal needs a specific number or deliverable so everyone knows when you're done. Think of it like explaining your project in an elevator - what does success look like? And make sure it fits your timeline and budget, obviously.
Honestly, just lead with the problem you're solving differently than everyone else. That's your real hook. Then get super specific about your approach - skip the "innovative" and "cutting-edge" BS because literally everyone says that. What's your actual methodology? Who are you targeting that others missed? I'd throw in a solid statistic if you've got one. The thing is, people want concrete examples, not vague promises. End it by spelling out exactly what benefit someone gets from YOUR project that they can't get anywhere else. Make it clear why you exist.
Dude, infographics are a game changer for project descriptions. People scan visuals 60,000x faster than reading text - wild stat but it's true. I used to write these massive paragraphs that nobody read. Now I throw in timelines, charts, process diagrams. Way better engagement. Your stakeholders won't have to dig through walls of text to find what matters. Icons work great for highlighting features, and diagrams show how different pieces connect. Honestly, even replacing one chunky paragraph with a simple visual makes a huge difference. Your audience will actually pay attention instead of glossing over everything.
Dude, seriously - write a solid project description from the start. It stops people from guessing what they're supposed to do, which saves you SO much headache later. When goals and deliverables are crystal clear, your team isn't constantly asking "wait, what are we doing again?" Trust me, spending 30 minutes upfront beats explaining the same stuff over and over to different people. Plus you'll have something to point to when scope creep inevitably happens (and it always does). Short sentences work. Your future self will definitely thank you for not skipping this step.
Honestly, you're way too close to your own writing to catch the obvious stuff. Get 2-3 people to read your draft - they'll spot confusing jargon and missing context that seems crystal clear to you but makes zero sense to everyone else. Fresh eyes are honestly magic for this. They might completely restructure something or point out your best ideas that you buried halfway through. I always ask readers what questions they still have after finishing, because that tells you exactly where you lost them. It's kinda wild how differently other people's brains work.
-
Unique and attractive product design.
-
Very unique, user-friendly presentation interface.