


Project Activity Powerpoint Presentation Slides


Try Before you Buy Download Free Sample Product
 Impress Your
 Audience
Editable
of Time


Introducing our project schedule PowerPoint presentation slides. Deliver an outline of your new project with the help of this task assessment PowerPoint deck. This report assignment PPT theme has a slide that details the type and impact of the risk over the project. Installation of this assignment plan PPT layout will help you in displaying your project management team. This readymade task optimization PowerPoint design contains a slide that provides a detailed layout of the roles and responsibilities of the team for the project. Incorporating this particular task proposal PPT theme allows you to present your project progress summary. This activity assessment PowerPoint creative set contains a slide that has a project management dashboard. Selection of this task boosting PowerPoint template lets you showcase the project cost estimate. This activity standardization PPT deck lets you make required variations to icons and colors. Choose this project escalation PowerPoint design to display organization and assurance. Download this PPT slide to avail the benefits of perfection.
People who downloaded this PowerPoint presentation also viewed the following :
Content of this Powerpoint Presentation
Slide 1: This slide introduces Project Task. State Your Company Name and begin
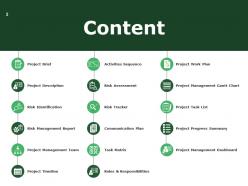
Slide 2: This slide showcases Content with these points to be consider- Project Work Plan, Project Progress Summary, Project Task List, Project Management Dashboard, Project Management Gantt Chart, Project Brief, Risk Identification, Risk Management Report, Project Management Team, Project Timeline, Project Description, Task Matrix, Risk Tracker, Activities Sequence, Communication Plan, Roles & Responsibilities, Risk Assessment.
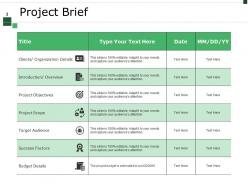
Slide 3: This slide presents Project Brief table and add the data in the table.
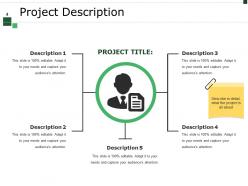
Slide 4: This slide showcases Project Description. Describe in detail, what the project is all about
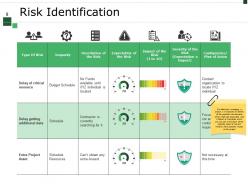
Slide 5: This slide shows Risk Identification. For effectively managing a project, it is important to identify all the possible risk elements which might get associated with it. Below is a template which you can use to list down all the possible types of risk and mention there possible impact on the project
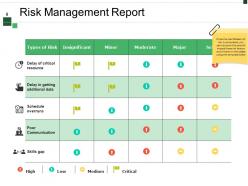
Slide 6: This slide presents Risk Management Report. Once the identification of risk is completed, you can list down the level of impact these risk factors would have on the project using this template below
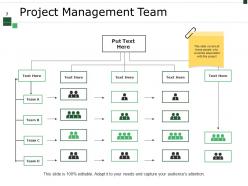
Slide 7: This slide showcases Project Management Team.
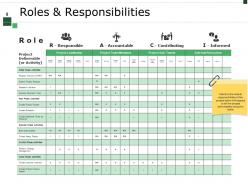
Slide 8: This slide shows Roles & Responsibilities table and use it.
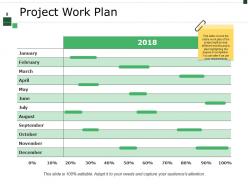
Slide 9: This slide presents Project Work Plan.
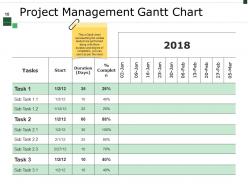
Slide 10: This slide showcases Project Management Gantt Chart. This a Gantt chart representing the various tasks to be performed along with there duration and degree of completion, you can use it as per the need
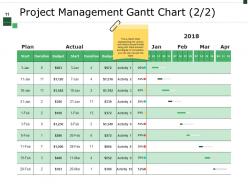
Slide 11: This slide presents Project Management Gantt Chart (2/2). This a Gantt chart representing the various activities to be performed along with there duration and degree of completion, you can use it as per the need
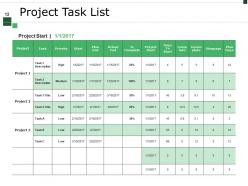
Slide 12: This slide shows Project Task List with the Project Start.
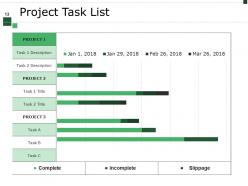
Slide 13: This slide showcases Project Task List with these three parameters- Complete, Incomplete, Slippage.
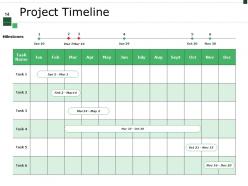
Slide 14: This slide presents Project Timeline. This slide covers the timeline of the entire project, you can use it as per your requirements
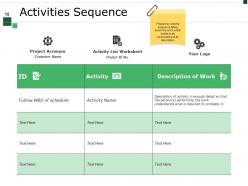
Slide 15: This slide showcases Activities Sequence with these five factors- Project Acronym, Customer Name, Activity List Worksheet, Project ID No., Your Logo, Prepare an activity sequence listing down the work which needs to be performed and its description
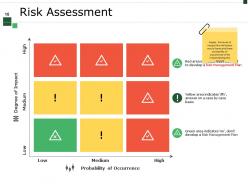
Slide 16: This slide presents Risk Assessment. Assess the level of impact the risk factors would have and there probability of occurrence while implementing the project
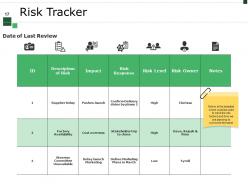
Slide 17: This slide showcases Risk Tracker with Date of Last Review. Below is the template which could be used to track the risk factors and how we are planning to overcome the same
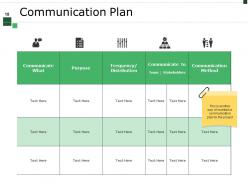
Slide 18: This slide shows with Communication Plan having further these- Communicate what, Purpose, Frequency/ Distribution, Communication method, Team, Stakeholders, This is another way of maintain a communication plan for the project
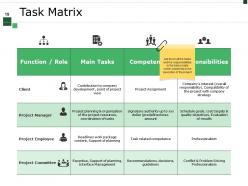
Slide 19: This slide presents Task Matrix. List down all the tasks and the responsibilities in the below table which would help in the execution of the project
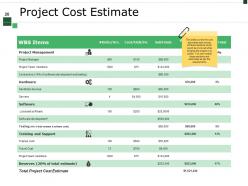
Slide 20: This slide showcases Project Cost Estimate.This slide covers the cost estimates split across different sections which would be involved while bringing the project in to action. You can modify these sections and estimates as per the requirements
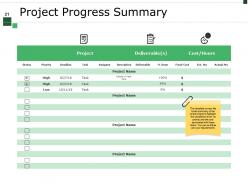
Slide 21: This slide presents Project Progress Summary. This template covers the broad summary of the entire project to highlight the completion level, its priority and the cost associated with these tasks. You can se this as per your requirements
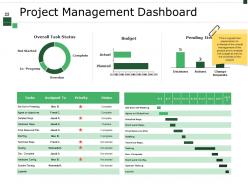
Slide 22: This slide shows Project Management Dashboard with these of the parameters- Pending Items, Budget, Overall Task Status, Complete, Overdue, In -Progress, Not Started, This is a graphical presentation to understand the overall management of the project and to analyse the budget as well as the timelines of the project
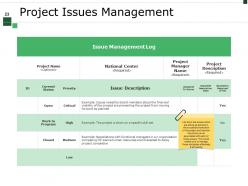
Slide 23: This slide showcases Project Issues Management. List down the issues which are acting as barriers in the successful execution of the project and mention the priority level associated with each of these issues. This would enable you to manage these obstacles effectively & efficiently
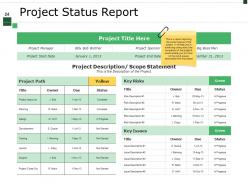
Slide 24: This slide presents Project Status Report. This is a report capturing the current status of the project. It will help you in achieving clarity about the completion of the project & would enable you to focus on the risk & issues associated with the project
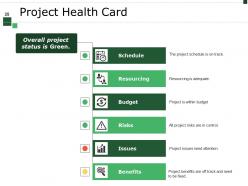
Slide 25: This slide showcases Project Health Card with these parameters- Resourcing, Budget, Risks, Issues, Benefits, Schedule.
Slide 26: This slide presents Project Activity icon slide.
Slide 27: This slide showcases Let’s have a Coffee Break.
Slide 28: This slide shows Charts & Graphs.
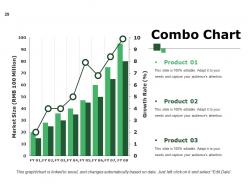
Slide 29: This slide presents Combo Chart. Add the comparison and make use of it.
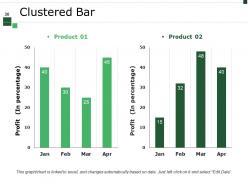
Slide 30: This slide showcases Clustered Bar with the product comparison and use it as per your requirement.
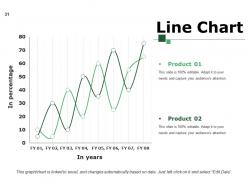
Slide 31: This slide shows a Line Chart for two product comparison.
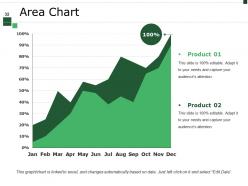
Slide 32: This is an Area Chart slide for product/entity comparison.
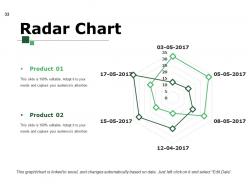
Slide 33: This is a Radar Chart slide for product/entity comparison.
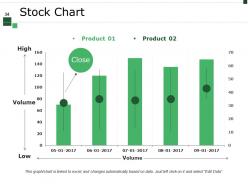
Slide 34: This slide displays a Stock Chart with volume as parameter in terms of high and low, open and close.
Slide 35: This slide is titled Additional slides.
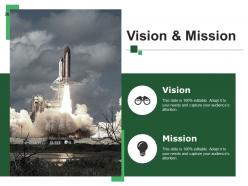
Slide 36: This is a Vision, Mission and Goals slide. State them here.
Slide 37: This is an Our Team slide with name, image&text boxes to put the required information.
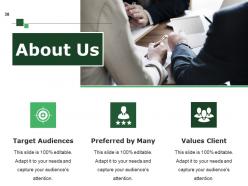
Slide 38: This is an About Us slide showing Our Company, Value Client, and Premium services as examples.
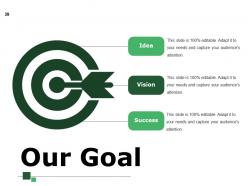
Slide 39: This is an Our Goal slide. State them here.
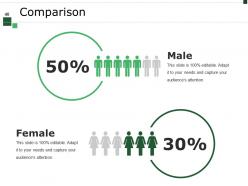
Slide 40: This slide shows Comparison of Positive Factors v/s Negative Factors with thumbsup and thumb down imagery.
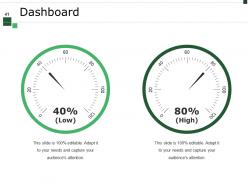
Slide 41: This is a Dashboard slide to show- Strategic System, Success, Goal Process, Sales Review, Communication Study.
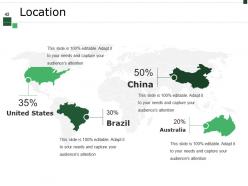
Slide 42: This is a Location slide to show global growth, presence etc. on world map.
Slide 43: This is a Quotes slide to highlight, or state anything specific.
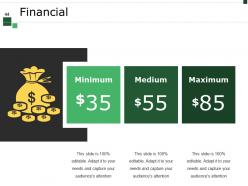
Slide 44: This slide shows Vital financial circles with percentage and text boxes.
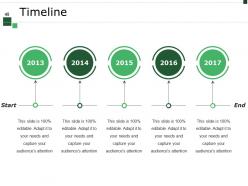
Slide 45: This is a Timeline slide to show milestones, growth or highlighting factors
Slide 46: This is a Puzzle image slide to show information, specification etc.
Slide 47: This slide displays Our Target with a background image.
Slide 48: This is a Magnifying glass image slide to show information, scoping aspects etc.
Slide 49: This slide shows a Mind map for representing entities.
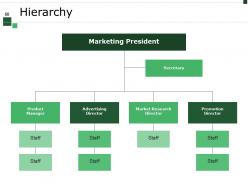
Slide 50: This is a Hierarchy slide showing- Supply Chain Manager, Supply Chain Council, Sourcing, Supplier Quality Engineer, Procurement, Logistics & Management, Supplier Management, Student, Contract Management.
Slide 51: This slide displays a Venn diagram image.
Slide 52: This is a Silhouettes slide to show people specific information etc.
Slide 53: This slide displays Critical notes on Challenge, Positive Attitude, Balanced Lifestyle.
Slide 54: This is a Bulb or Idea slide to state a new idea or highlight specifications/information etc.
Slide 55: This is a Thank You slide with Address# street number, city, state, Contact Number, Email Address.5
Project Activity Powerpoint Presentation Slides with all 55 slides:
Identify inflated accounts with our Project Activity Powerpoint Presentation Slides. Bring it down to actual dimensions.


FAQs for Project Activity
So there are five main phases you'll go through. First is initiation - basically defining what you're actually doing and getting the green light. Planning comes next, where you map out timelines, resources, all that fun stuff. Then execution happens - this is where projects usually make it or break it, honestly. While you're executing, you're also constantly monitoring and tweaking things as they go sideways (because they will). Finally there's closure - wrapping everything up, documenting what went wrong so you don't repeat mistakes, maybe grabbing drinks with the team. Oh, and don't skimp on planning. I know it's boring but trust me on this one.
Okay so first thing - write down EVERYTHING that's included in your project. And I mean everything. Also write what's NOT included because that part honestly saves your ass later. Get everyone to actually sign off on this before you touch any code. Trust me on this one. When they come back asking for "just one small change" (spoiler: it's never small), you can wave that document around. Oh and set up some kind of formal process for changes so they can't just randomly add stuff. Makes them think twice when they realize there's paperwork involved. Vague requirements are basically an invitation for scope creep to ruin your life.
Asana, Monday.com, and ClickUp are all pretty solid choices for project tracking. Honestly though, I've watched teams spend forever hunting for the "perfect" tool when plain old Excel works fine for smaller stuff. Smartsheet's great if you need fancy reporting features. But here's the thing - whatever you pick needs to play nice with what you're already using. Otherwise people just won't bother with it. The whole team has to actually want to use it consistently or you're screwed. I'd definitely test out the free versions first to see what feels right.
Honestly, don't wait until things go sideways to think about risk management. Get your team together during the planning phase and brainstorm what could tank the project - they'll catch stuff you won't even think of. Rate each risk by how likely it is and how much damage it'd cause. High-impact ones? Build extra time and budget for those upfront. I learned this the hard way on a project last year, trust me. Keep a running list and update it as you go. Oh, and do quick "what's gonna bite us" check-ins every couple weeks with the team.
Honestly, you need three things: good communication rhythm, everyone seeing the same info, and actual human connection. Daily standups work great, or weekly deep dives if that fits better. Miro and Figma are total lifesavers for brainstorming together - I can't work without them anymore. Build some kind of shared dashboard so people aren't constantly asking "wait, where are we on this?" The human stuff matters too though. Virtual coffee breaks sound cheesy but they actually help. Maybe try one new thing this week? See what sticks with your team first.
Don't just look at the basic stuff like deadlines and budgets. What really matters is whether you actually helped people - check customer satisfaction, how many users adopted it, did it fix the real problem? Quality's huge here too. Are you shipping something that genuinely works well, or just technically checking boxes? (Those are worlds apart, trust me.) Your team picking up new skills along the way is worth tracking. Oh, and processes - did anything get smoother for next time? I always send stakeholders a quick survey maybe 6-8 weeks after launch. Just ask them straight up if it met their actual needs.
Look, stakeholder engagement literally makes or breaks projects. When people feel heard, they'll actually support your decisions instead of throwing roadblocks everywhere. First thing - map out who matters and what they genuinely care about. Don't guess on this part. Then talk to them how THEY want to be talked to, not how you prefer. I made this mistake once sending executives these massive email updates when all they wanted was quick visual dashboards. Such a waste of time. Communication has to be regular though, or they'll tune out completely. Oh, and they'll spot problems you're blind to - that's honestly invaluable. Start small: grab coffee with your top three stakeholders this week.
Honestly, you don't need to go full agile to make it work in traditional places. I'd start small - maybe switch from quarterly to monthly planning cycles. Daily standups help but even weekly check-ins are better than nothing. Breaking projects into smaller chunks is huge, especially if you can get feedback more often. Works surprisingly well even in those super regulated industries where you'd think it's impossible. Pick like one or two things that actually fit your situation first. Scrums aren't mandatory - it's more about the mindset shift. Then just build on whatever's actually working for your team.
Honestly, soft skills matter way more than people think - communication and emotional intelligence will save your butt when things go sideways. Sure, you need the technical stuff like Agile and risk management, that's just basic now. But being able to talk to different people and keep everyone on the same page? That's where the magic happens. Oh, and get comfortable with chaos because everything changes constantly. I'd say figure out what you're worst at first - like, be brutally honest with yourself - then work on that. The whole "translator between stakeholders" thing is probably the biggest part of the job.
Honestly, most project disasters I've witnessed happened because people thought they were all on the same wavelength but weren't even close. Regular check-ins help catch those gaps early. Document the big decisions so there's no "wait, I thought we agreed on X" drama later. Visual stuff like diagrams really helps too - some people just process info better that way. Don't be afraid to ask questions that feel obvious. Half the time those "stupid" questions expose assumptions everyone made but nobody verified. Oh, and have people explain decisions back to you in their own words. You'll be shocked how differently they interpreted things.
Dude, you NEED project documentation - it's literally your lifeline when everything goes sideways. Start with the basics: project charter, timeline, budget, and a risk register. Meeting notes are huge too because people conveniently "forget" what they agreed to. I learned this the hard way on a project last year where we had nothing written down and it was a complete disaster. Communication plan and stakeholder matrix help too. Don't overthink it though - even throwing stuff in Google Docs beats winging it. Trust me, future you will thank present you when the client starts changing their mind about everything.
Look, I get that documenting everything after a project feels like torture when you just want to be done. But seriously - it's your best shot at not repeating the same disasters. Write down what worked, what was a complete mess, and why things went sideways. You'll start seeing patterns in your screw-ups (we all have them). Plus you'll finally know which processes actually help versus just waste time. The real trick? Make sure your whole team can actually find and use these notes later. Otherwise you're just creating fancy digital paperwork that nobody reads.
Dude, set up change control from the start - like, actually document every request that comes in. Don't just wing it. Assess timeline and budget impact before saying yes to anything. I learned this the hard way when a "quick addition" turned into three extra weeks of work. Get stakeholder sign-off first, then tell your whole team right away so nobody's working off old info. Keep a change log too because people have selective memory about why things shifted. Honestly, the biggest mistake is letting small changes slide without process - they add up fast and you'll regret it later.
Oh man, cultural stuff will totally trip you up if you're not careful. Some people are brutally direct, others dance around problems for ages - it's honestly exhausting sometimes. Time zones are whatever, but the real nightmare is when your "urgent" request sounds completely rude to your Japanese teammates. Meeting styles? Forget about it - everyone does things differently. Decision-making processes vary like crazy too. My advice? Figure out each team's weird little cultural quirks before you start. Then create communication rules that don't piss anyone off. Trust me on this one.
Dude, you've gotta bake sustainability right into the project from the start - can't just slap it on later. Get your long-term funding locked down first. Then train whoever's sticking around to actually run this thing (seriously, people always forget this step and wonder why everything falls apart). Build it into their existing workflow so it's not some extra burden they'll ditch. Set up ways to track what's happening after you're gone. Oh, and make sure there's clear decision-making structure for when issues pop up. The whole point is making it feel natural, not like added work.
-
It saves your time and decrease your efforts in half.
-
Awesomely designed templates, Easy to understand.