


Project Scoping Powerpoint Presentation Slides


Try Before you Buy Download Free Sample Product
 Impress Your
 Audience
Editable
of Time


Introducing project scoping PowerPoint presentation for the project managers. It has PPT slides on various topics highlighting all the core areas of project management. This content ready project scoping presentation deck is a part of project planning which helps in determining the project goals, objectives, features, tasks, costs involved and more. Document a list of project goals and targets with the help of project scoping PPT templates to execute the project on time. Explain project brief , description, process, risk identification and more to the team to give them a clear understanding about the project. This complete presentation on scope statement explains the ground rules to the team members and provides guidelines for making decisions during the project. It becomes necessary to pin down the scope early during the project planning so that the cost and schedule of the project can be tracked. Better the project scoping, better the project is managed during its implementation. Therefore, conduct project scoping to help team members focussed on a common goal and prevent projects from going beyond their established vision. Moreover, explore our project presentation ppt now.
People who downloaded this PowerPoint presentation also viewed the following :
Content of this Powerpoint Presentation
Slide 1: This slide showcases the Topic Project Scoping with a magnifying glass icon. Project Scoping icon displays Tasks, Features, Deadlines, Goals, Delivery, Quality and Cost with respective icon imagery.
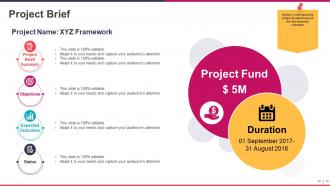
Slide 2: This slide displays Project Brief in Project Scoping. It includes Project name and the entire framework. The framework description includes Project Brief Summary, Objectives, Expected Outcomes and Status of the Project. It also showcases Project Fund and Project Duration.
Slide 3: This slide contains Project Description outline. It showcases a hand icon writing on a board on the left and the content portion on the right. Write any kind of description depending on the basis of the Project to be scoped.
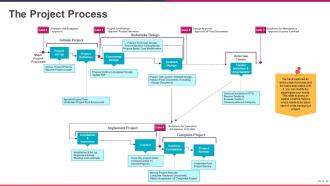
Slide 4: This slide outlines the entire Project Process formulation. Every aspect of the project is stated here. It displays the entire process in Gate and steps form with preceding arrows. Gate 0 outlines strategic and budgetary approval. It covers Project Set up and its definition under the heading Project Initiate. Gate 1 underlines Project Justification. It covers Conceptual and Detailed Design under the heading Undertake Design. Gate 2 outlines Design Approval. It covers Tender invitation and assessment under the heading Undertake Tender. Gate 3 underlines Readiness for manufacture. It covers Control, Installation & Execution under the heading Implement Project. Gate 4 outlines readiness for operation. It covers Confirm completion and Project Review under the heading Complete Project.
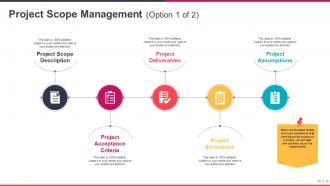
Slide 5: This slide covers Project Scope Descriptions, Deliverables, Assumptions, Acceptance Criteria, and Exclusions in project management
. It also displays cardboard, tick and document icons for the respective sub headings.
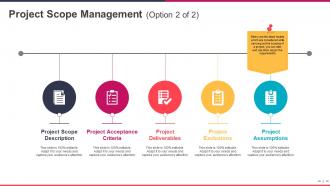
Slide 6: This slide showcases another variation of Project Scope Descriptions, Deliverables, Assumptions, Acceptance Criteria, and Exclusions in Project Management. It also displays cardboard, tick and document icons for the respective sub headings.
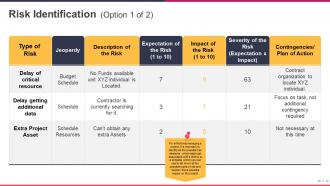
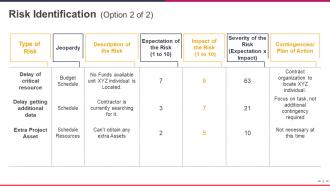
Slide 7: This slide section covers the risk type, description, impact and contingencies plan in a project. It displays the jeopardy factor, expectation and severity of the risks involved. It showcases delay of critical source, additional data and extra project assets. All the factors under the risk types, contingencies plan are covered to give a better idea and understanding of critical factors involved.
Slide 8: This slide is another variation of risk type description, impact and contingencies plan in a project. It displays the jeopardy factor, expectation and severity of the risks involved. It showcases delay of critical source, additional data and extra project assets. All the factors under the risk types, contingencies plan are covered to give a better idea and understanding of critical factors involved.
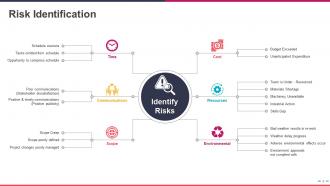
Slide 9: This slide covers Risk identification in terms of Time, Cost, Resource, Communication, Scope and Environmental factors. TIME sub-heading includes Schedule, Tasks and Opportunity. COST includes Budget exceeded and Expenditure. COMMUNICATIONS includes Poor, Positive & Timely communications RESOURCES includes factors such as Material shortage, Industrial action, Machinery unavailable, Skills gap and under resourced team. SCOPE includes scope creep, poorly defined scope and project changes. ENVIRONMENT includes bad weather, weather delay, adverse effects, and environment approvals.
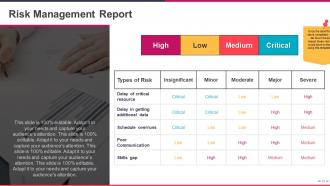
Slide 10: This slide displays types of risk with health status of High, Low, Medium, and Critical. The types of risk stated lists as- delay of critical source and additional data, schedule overruns, poor communications and skills gap. These risks can be assessed on the basis of insignificant, minor, moderate, major and severe indicator basis.
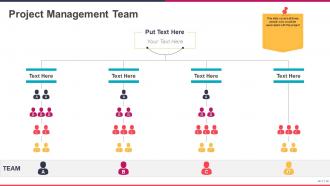
Slide 11: This slide presents Project Management Team. It shows four rows with text boxes which can be used for describing the entire team. All the people responsible for the Project can be listed down here. It also contains segmented teams on the basis of their importance or departments as Team A, B, C, D.
Slide 12: This slide contains the detailed variation of the Project Management Team. It displays Proposal/Project Manager’s function, name, phone, email and leave of absence (if any). It also displays the same for the team with an additional sub heading of Time portion allotted for the team members.
Slide 13: This slide shows the next section of Charts and Graphs to be used for the Project.
Slide 14: This slide contains the comparison for two products. It shows a Clustered Bar with two compared products A & B on the basis of four months- Jan to Apr. The profit can be calculated in terms of percentage for any two products for the required number of months.
Slide 15: This slide represents a Stacked-column for the products to compare. It shows a stacked column for two products A &B for a period of 9 fiscal years. The total growth factors in comparison can be calculated and presented clearly with this slide. The profit can be shown in monetary form for the required number of years.
Slide 16: This slide shows Area Chart as another form of representing profit in terms of percentage. Covering the financial aspect of any year, sales can be shown in terms of percentage for two products A & B. The slide displays months and sales percentage in area chart for a better representation.
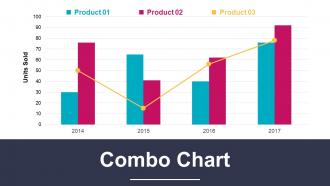
Slide 17: This slide displays a Combo chart. Any kind of product with total sold units can be shown by this chart. It shows a comparison graph of three products for four years. Any kind of product sales can be tracked by parameters of units sold v/s the total number of years of sale.
Slide 18: This slide shows Coffee break with a coffee mug icon to go with.
Slide 19: This slide displays Additional slide as introductory text heading.
Slide 20: This slide displays Vision, Mission, and Goals with respective icons and text boxes to go with. State your company agenda by these headings.
Slide 21: This slide section displays Our Team to state the team members/person responsible for the Project. Put Name, Designation for the team to be introduced.
Slide 22: This slide covers Target Audiences, Goals and reasons of Preference of your company. It also shows respective icons for the headings to go with.
Slide 23: This slide displays Comparison on the basis of gender. It shows male and female image compared in terms of percentages.
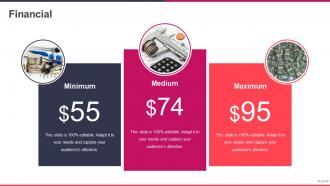
Slide 24: This slide shows three aspects of Financial with Minimum Medium, and Maximum. It displays a template with these three compared aspects.
Slide 25: This slide shows a world map under the heading- Location. Compare sales, growth or any other factor in global terms. You can show the above-mentioned factors in terms of percentage or numbers as deemed fit.
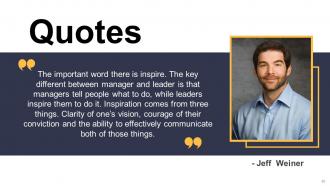
Slide 26: This slide shows a Quote by Jeff Weiner. Put a quote here or anything you want to state.
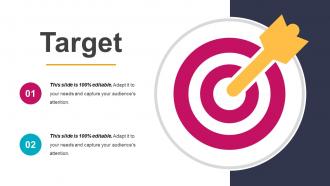
Slide 27: This slide shows Target. Write down your targets achieved or yet to achieve by this slide image with text boxes and image to go with.
Slide 28: This slide displays a Circular Puzzle image with four factors. State your agenda goals, growth factors or team specifications with the help of this slide.
Slide 29: This slide displays a Mind map with a brain image to go with. State any additional or special aspects here you want to cover. It also contains imagery of handshake, growth graph, and gears.
Slide 30: This slide shows a Funnel image with three sections. State your specifications in funnel form.
Slide 31: This slide displays Thank You slide with address, contact numbers and email address.
Project Scoping Powerpoint Presentation Slides with all 31 slides:
Arrive at a compromise formula with our Project Scoping Powerpoint Presentation Slides. Get former foes to agree to be friends.
-
Project Scoping
-
Project Brief
-
Project Description
-
The Project Process
-
Project Scope Management Option 1 of 2
-
Project Scope Management Option 2 of 2
-
Risk Identification Option 1 of 2
-
Risk Identification Option 2 of 2
-
Risk Identification
-
Risk Management Report
-
Project Management Team
-
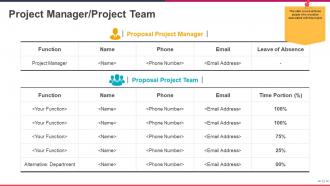
Project Manager Project Team
-

Charts And Graphs
-
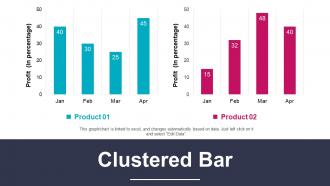
Clustered Bar
-
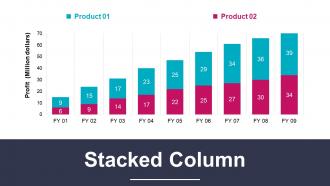
Stacked Column
-
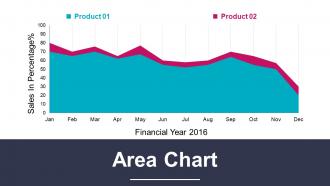
Area Chart
-
Combo Chart
-

Coffee Break
-

Additional slides
-

Our Mission
-

Our Team
-

About Us
-

Comparison
-
Financial
-

Location
-
Quotes
-
Target
-
Puzzle
-

Mind Map
-
Funnel
-

Thank You
FAQs for Project Scoping
Alright so your scope statement needs five main things. Clear objectives and deliverables first - what you're actually building and why it matters. Then set solid boundaries because trust me, scope creep will destroy your sanity if you don't. Major milestones should be in there too, plus any assumptions you're making and constraints like budget limits or crazy deadlines. Don't forget stakeholder roles either - who's doing what. Honestly, make everyone sign off on it upfront. Makes your life so much easier when people inevitably want changes later.
Honestly, the secret is giving people actual structure instead of just winging it. Run focused workshops where they can nail down requirements and success metrics - way better than those chaotic free-for-alls where everyone's talking over each other. Create ongoing feedback loops throughout the whole scoping process, not just at kickoff. Be super specific about what you need from each group and when. Oh, and give them templates to work with! Otherwise you'll get back a million different formats that are basically useless for project planning. The structure thing really makes all the difference.
Start by talking to your stakeholders and gathering requirements - that's your base. Work breakdown structures are seriously underrated for chopping big projects into bite-sized pieces. Scope statements help too, plus user story mapping if it's product work. Prototyping saves you so much headache later, especially when people don't really know what they want until they see something tangible. Oh, and don't try to use every technique at once - that's a recipe for analysis paralysis. Pick 2-3 methods that actually match your project's complexity and you'll be golden.
Okay so project scope is basically everything you need to do - like the whole work breakdown, timeline, what's in and what's NOT in. Your objectives are why you're doing it in the first place. Deliverables are the actual stuff you hand over when you're done. So like if you're building a website, maybe your objective is "boost online sales by 20%." The deliverables would be the site itself, training docs, whatever. But scope covers all the messy stuff in between - resources, constraints, the whole nine yards. Honestly, just write everything down super clearly at the start. Trust me, you'll thank yourself later when scope creep tries to destroy your life.
Ugh, scope creep will kill you every time. Those "tiny tweaks" people ask for? They're never tiny. Document what's NOT included upfront - sounds boring but it'll save your sanity later. Don't rush into anything without getting everyone aligned first, even if the client's breathing down your neck. I made that mistake once and ended up doing double the work for half the pay. Set your boundaries day one and actually stick to them. People's memories get weird when it comes to what they originally asked for.
So change management is basically how you control scope changes during your project. You definitely need formal approval and impact assessment before letting anyone modify the scope - otherwise stakeholders will hit you with endless "quick requests" that are never actually quick. Trust me on this one. Document everything too. Set up a change control board right away and make sure everyone knows the rules upfront. Without this process, your project will turn into something totally different than what you planned. Scope creep is real and it'll kill your timeline.
Dude, you HAVE to do risk assessment during scoping - I can't stress this enough. Look at technical stuff that might break, resource issues, dependencies with other teams, external factors. Honestly, I've watched so many projects completely implode because people just... didn't bother with this step? It's wild. Be brutally honest about what could go sideways and plan buffers around it. Way better to adjust your scope or timeline upfront than be running around like a headless chicken when everything hits the fan later.
First thing - figure out what your company actually wants to achieve, then work backwards. I always do this "so what?" test when looking at project stuff because honestly, half the time people can't explain why they're doing something. Get your stakeholders involved early (trust me on this one) and make sure your deliverables actually move the needle on revenue or whatever the big goal is. Write it all down in your project charter so when people start asking for random additions later, you can point back to it. Scope creep is gonna happen anyway, but at least you'll have something to fight it with.
Honestly, just get everyone on the same page from day one with a solid project charter - like your roadmap everyone can point to. Kick things off with a meeting where you actually walk through everything together (way better than hoping people read docs). Visual stuff works great too - boards, charts, whatever makes it click. I always do regular check-ins because scope creep is sneaky. Oh, and create some shared folder or space where people can find the latest details when they inevitably forget what you decided three weeks ago. Repetition is your friend here.
Set up change control on day one and actually follow it - this is where most people mess up. Write down everything in your scope doc first. When they come asking for "just one tiny thing" (spoiler: it's never tiny), run it through your process every single time. Force them to make trade-offs. Want Feature X? Cool, what gets cut or pushed back? I do weekly check-ins to catch scope creep before it spirals. You're not being mean by saying no - you're saving the project. Trust me, they'll thank you later when you actually deliver on time.
So you'll need to track a few things to see how your scope's doing. Scope creep percentage is big - basically how much extra stuff got piled on. Budget and schedule variance tell you if you stayed on track money and time-wise. Don't sleep on stakeholder satisfaction scores though, those can make or break everything. Track your deliverable completion rates too, plus quality metrics against what you originally planned. Oh, and set your baselines during planning or you'll have nothing to compare to later. That last part bit me once - learned that the hard way.
Look, solid project scoping is basically your roadmap for figuring out who you need and what it'll cost. Break everything down into actual tasks first - then you can realistically estimate time, skills, and team size. I've watched way too many projects crash because someone just winged the scope upfront. It's like... you wouldn't plan a road trip without knowing where you're going, right? Vague scoping means you're just guessing at your budget. The more detailed you get with deliverables, the better your resource planning becomes. Trust me on this one.
Honestly, just pick your MVP first and be brutal about what actually matters. I learned this the hard way on my last project - you literally can't build everything right away. Write out user stories with clear criteria, and for the love of god make sure your product owner actually shows up to meetings. Focus on what users will DO, not just what features look cool. Set up regular check-ins to pivot when needed. Oh, and organize your backlog into must-haves vs nice-to-haves. You'll probably end up changing half of it anyway once real users start giving feedback.
Dude, historical data is like having a cheat sheet for project planning. I used to just guess at timelines and budgets - terrible idea, trust me. Now I dig into past similar projects to see real patterns. Certain features always take way longer than you think, some team setups just click better. Pull your old project reports and compare what you estimated vs. what actually happened. Honestly, the scope creep analysis alone will save you headaches. Use those insights to buffer your current estimates and spot red flags early. Way better than winging it and praying.
Figure out what regulatory stuff applies to your project before you start building anything. GDPR for EU data, HIPAA if it's healthcare, SOX for financial reporting - you know the drill. Accessibility requirements are huge too and honestly such a pain if you catch them late. Security audits, legal reviews, third-party contracts... all that bureaucratic stuff needs to get scoped upfront. Get your legal and compliance people involved during initial planning sessions. Trust me on this one - I've watched projects completely blow up their budgets because nobody thought to ask about compliance requirements early enough. Those surprises aren't fun.
-
nice
-
Great PPT
-
Great PPT
-
Colors used are bright and distinctive.
-
Excellent work done on template design and graphics.
-
Good Slides with Nice efforts
-
NICE