


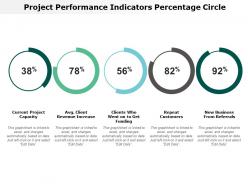
Project performance indicators percentage circle





Try Before you Buy Download Free Sample Product
 Impress Your
Audience
 100%
Editable
 Save Hours
of Time


Assimilate from different cultures with our Project Performance Indicators Percentage Circle. Set your thoughts free of any bias.
People who downloaded this PowerPoint presentation also viewed the following :
Project performance indicators percentage circle with all 6 slides:
Argue your case in a cogent fashion with our Project Performance Indicators Percentage Circle. Display a high degree of intellect.


FAQs for Project performance
You really need to watch schedule and budget performance first - basically are you on time and not bleeding money? Then track scope completion and quality stuff. I'd add stakeholder satisfaction because nobody wants angry clients, plus resource utilization (seriously, you'll be shocked how much time teams waste). Risk tracking is huge too - compare actual problems to what you expected. Oh, and don't go crazy measuring everything. Pick maybe 3-5 metrics your stakeholders actually care about, not some massive dashboard nobody looks at. Focus on your specific project type.
Look, hitting deadlines and staying on budget is great, but what if your team's miserable or clients hate working with you? Quantitative stuff won't catch that. You need the "why" behind those numbers - team morale, how stakeholders actually feel, whether your processes suck or not. I swear some of my biggest project breakthroughs came from just grabbing coffee with team members and actually listening. Try regular check-ins, quick surveys, retrospectives. Even tracking one qualitative thing alongside your usual metrics makes a huge difference. It's like having radar for problems before they blow up.
Those surveys are basically how you find out if you're actually doing a good job or just fooling yourself. Your dashboards might look perfect, but if stakeholders are annoyed, something's wrong. They'll tell you about problems you'd never catch otherwise - like when communication sucks or scope is getting weird. Plus satisfied stakeholders don't throw curveballs at you later, which honestly saves so much headache. Run them at major milestones though, not just when everything's done. Way more useful that way.
Honestly, you've gotta match your KPIs to what actually matters in your specific field. Healthcare? Patient outcomes and compliance stuff. Construction tracks safety incidents and material waste - makes sense. For software, look at deployment frequency and bug rates. Here's the thing though - every industry has totally different risks. Manufacturing obsesses over uptime and defect rates, but a marketing agency couldn't care less about that. They're measuring campaign performance and keeping clients happy instead. I'd start by figuring out what failure looks like for you, then build indicators that'll give you a heads up before things go sideways.
Pick 3-5 KPIs that your stakeholders actually care about - more isn't always better. Automate your dashboards if you can because pulling reports manually every week is honestly soul-crushing. Consistency matters too, so stick to the same format and schedule. I'd focus on trends over single data points since they tell a better story. When numbers look weird, throw in some context so people don't panic. Oh, and track leading indicators with your lagging ones - catching problems early beats scrambling to fix disasters later. That's probably the most important thing, honestly.
Look at what actually matters to your client first - speed? Quality? Cost cuts? User adoption? I always start there instead of grabbing whatever metrics are easiest to track (guilty as charged though). Map your indicators back to real project goals. The best ones? They scream at you early when something's going sideways. Stick to 3-5 max because honestly, tracking more just becomes noise. You want actionable insights about whether you're winning or losing, not a spreadsheet that makes your eyes glaze over.
Honestly, the worst part is when your dashboard looks perfect but you're actually screwed because you're tracking the wrong stuff. Bad data will destroy you - classic garbage in, garbage out situation. Plus everyone on your team will look at the same numbers and see completely different things depending on what they care about. I learned this the hard way at my last job, btw. Don't just glance at the surface metrics. Ask yourself what the data's really saying. Sometimes those green lights are lying to you, especially if you're missing outside factors that could tank everything.
Dude, real-time data is such a lifesaver for tracking project KPIs. You'll catch problems the moment they pop up instead of finding out weeks later when everything's already gone sideways. Budget burning too fast? Timeline slipping? You know immediately, not at some awkward status meeting where everyone's pretending they saw it coming. I swear, the instant visibility into resource usage alone makes it worth it. Just set up alerts for your critical numbers so you're not glued to screens all day - trust me on that one. Course-correcting early beats scrambling later every single time.
Look, variance analysis is like your project's health checkup - it catches problems before they blow up. You'll see exactly where things are going off track with schedule, budget, whatever. I learned this the hard way watching projects tank because nobody paid attention to the warning signs. Run these checks weekly or every two weeks, not just at big milestones. That way you can actually fix stuff when it starts going wrong. Don't wait for monthly reviews - by then you're already behind the eight ball and scrambling to catch up.
Look at your old projects that were similar size and complexity - grab the budget numbers, how long they actually took, staffing levels, that kind of stuff. I usually check 3-5 projects so one weird outlier doesn't mess up my baseline. Calculate the averages and you've got realistic targets instead of pulling numbers out of thin air. Honestly, timeline adherence is probably the most useful metric I track. Short version: if you're not already saving this data, start now. You'll hate yourself later if you don't have it when planning the next big thing.
Yeah, outside stuff can really screw up your project metrics in ways you can't predict. Supply chain problems, new regulations, weather disasters - suddenly your timeline's toast and your budget's blown. What sucks is your KPIs will look awful even when you're crushing it otherwise. I watched one team get roasted over delays that were 100% due to a supplier going bankrupt (like, how do you plan for that?). Build in some buffer time and document everything external that hits you. That way when stakeholders freak out about the numbers, you've got the receipts showing what actually happened versus what your team controlled.
Ugh, red numbers are the worst but don't freak out yet. First thing - dig into what's actually going wrong. Scope creep? Not enough people? Or did someone just completely botch the initial timeline? (We've all been there.) Figure out the real problem, then loop in your stakeholders ASAP. Be straight with them about what happened and give them options. Maybe you need more time, maybe you shuffle resources around, or honestly? Sometimes you just have to cut scope. The faster you move on this stuff, the better. Nobody likes surprises later.
So many good options out there! Asana, Monday.com, and Jira are solid if you want full project management with dashboards built in. Microsoft Project's still the heavyweight champ for serious scheduling stuff. But honestly? Sometimes a smart Excel setup with pivot tables does the trick for smaller projects - I know that sounds boring but it works. Trello and Notion are way more user-friendly for team collaboration. My advice: figure out which metrics actually matter to you first, then find whatever tool makes tracking those dead simple. Don't overcomplicate it.
Honestly, just grab a whiteboard and literally draw lines connecting your project metrics to what the company actually wants to achieve. Get people from different departments involved early - not just your usual crew. I've watched so many teams build these gorgeous dashboards that tracked absolutely nothing the bosses cared about lol. Have regular check-ins with leadership to make sure you're still measuring stuff that matters to them. Their priorities change constantly, so quarterly reviews work well. Oh and don't assume what mattered last quarter still matters now.
First things first - figure out what's actually causing the poor performance. Resource problems? Unrealistic goals? Scope creep driving everyone crazy? Once you know the real issue, you can fix it properly. Maybe reallocate people, adjust deadlines, or chop up those massive deliverables into bite-sized pieces. Honestly, half the time the indicators are just trash to begin with - they don't even measure anything useful. Check if yours actually make sense. Also, start doing weekly check-ins instead of waiting for monthly reports. Catching problems early beats scrambling later.
No Reviews