


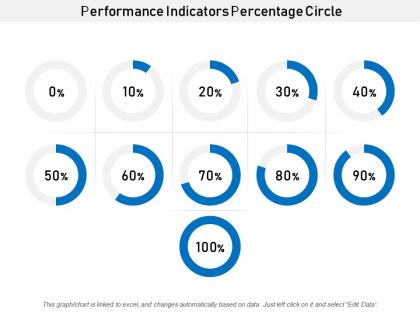
Performance indicators percentage circle





Try Before you Buy Download Free Sample Product
 Impress Your
 Audience
 100%
100% Editable
 Save Hours
 of Time


Our Performance Indicators Percentage Circle give you that extra zing. Add your views and make your audience sing.
People who downloaded this PowerPoint presentation also viewed the following :
Performance indicators percentage circle with all 6 slides:
Get that Friday feeling with our Performance Indicators Percentage Circle. They allow you to take it easy.
FAQs for Performance
Honestly, I'd focus on just a few key things. Velocity shows how much work you're actually getting done each sprint. Cycle time tells you how long stuff takes from start to finish. Quality metrics like defect rates are huge too - nobody wants to ship broken code, right? Team satisfaction is underrated but super important. Miserable developers don't do their best work. Also track whether your deliverables actually move the needle on business goals, not just output for the sake of it. Don't go metric-crazy though. Pick 3-4 that actually matter for your situation and review them regularly with the team.
Get your team involved in setting their own goals instead of just dictating from above. People buy in way more when they help define what success looks like. I've watched too many companies use metrics as "gotcha" weapons - total morale killer. Share why each number matters so everyone sees how their work fits the bigger picture. Mix some forward-looking stuff with results you've already hit. Honestly, celebrating progress beats waiting for perfect outcomes every time. Oh, and use these numbers to start real conversations during check-ins, not as some final judgment call.
Dude, you really need to visualize that performance data. Spreadsheets are just brutal - your eyes glaze over and you miss everything important. Charts and graphs make patterns pop out instantly. I swear, stakeholders tune out the second you show them a table, but they'll actually look at a decent bar chart or line graph. Start simple with basic charts for your main metrics. Heat maps are great too if you've got the time to set them up. Once you get the hang of it, you can get fancier with the visualizations. Trust me, it's way easier to spot trends and weird outliers this way.
Honestly, just match metrics to what each department actually cares about day-to-day. Sales wants revenue numbers, conversion rates, pipeline stuff. IT's all about uptime and security incidents - makes sense. Marketing gets obsessed with leads and engagement (good luck with attribution though, that's always a mess). HR tracks retention and how long it takes to hire people. But here's the thing - don't just pick metrics for them. Actually sit down with department heads and ask what success looks like for their team. Generic company-wide dashboards are pretty useless most of the time. Build KPIs around what they tell you matters.
You'll want to focus on three main metrics: NPS, CSAT, and CES. NPS shows how likely people are to recommend you - most companies use this one. CSAT measures satisfaction right after interactions. CES tracks how easy you made things, which honestly might be the most important since nobody has patience anymore. Also track retention rates and repeat purchases for the bigger picture. Oh, and if you're just starting out? Go with NPS first - you can actually compare it across different industries to see how you stack up.
Real-time metrics are game-changers because you can catch problems while they're still fixable. Instead of discovering something went wrong three weeks ago, you'll know immediately when your numbers dip or spike. It's honestly like finally getting glasses after squinting at everything for years. Set up alerts for your biggest metrics so you're not glued to dashboards 24/7. Then you can actually pivot fast when needed, move resources around, and stop small issues from turning into complete disasters. Way better than that whole "pray and hope" approach most people use.
I'd go with like 70% hard numbers, 30% softer stuff, but it really depends what you're tracking. Start with the quantitative metrics - revenue, time saved, whatever - since those are way easier to measure consistently. Then add some qualitative pieces like employee surveys or customer stories to explain what's actually going on behind the numbers. Honestly, I've seen teams get totally buried under too much data, so maybe stick to 3-5 key metrics max? The numbers show you what's happening, but you need the human insights to understand why. Review monthly and you'll be good.
Honestly, the worst thing you can do is chase vanity metrics - like page views or follower counts that look cool but tell you nothing useful. Don't measure everything under the sun either, you'll just confuse yourself. Pick stuff your team can actually control. I learned this the hard way at my last job lol. Revenue's great but you need leading indicators too, not just the final numbers. Here's my test: if a metric jumps 20% tomorrow, would you know what to do about it? If you're sitting there like "uhh..." then find better metrics.
Honestly, metrics work way better when you show people their actual impact instead of just grading them. Make everything transparent - connect their work to real outcomes like helping customers or hitting team goals. I've noticed the best managers talk about progress, not perfection. Regular check-ins are huge too, but use metrics to start conversations about growth and recognition. Maybe I'm biased, but treating metrics like coaching tools instead of report cards? That's when people actually stick around. They see their value and where they're headed career-wise.
Think of performance metrics like GPS for your company - they show if you're actually moving toward your goals or just driving in circles. Good metrics get teams focused on stuff that matters instead of random busy work. You want to connect the big strategy down to what each person does daily, so everyone gets how their job fits in. Honestly, most companies are terrible at this part. Without solid metrics? Your strategic goals are basically just fancy wishes. Short version: measure outcomes, not just activities, and make sure it all flows from top to bottom.
Look at your performance data - it'll show you exactly where people are falling short versus crushing it. Missing sales targets consistently? Low customer satisfaction scores? Those are your red flags right there. Don't get caught up in one bad month though, focus on the actual trends over time. That's where you'll spot if it's a skills thing, process issue, or maybe they just need better resources. Honestly, most companies do those boring generic training sessions that nobody wants to sit through. Way better to use this info to create focused programs that actually address what's broken.
Honestly, start with Google Analytics for your website stuff - it's free and does the job. Tableau or Power BI are where it's at for visualizing everything else, though Power BI's cheaper if that matters. HubSpot's analytics are pretty solid if you're already using it for marketing. Real-time monitoring? Datadog and New Relic are worth the money, especially for system performance (learned that the hard way). Don't go crazy adding a bunch of tools right away though. Pick one main platform that plays nice with what you're already using, then build from there. Data silos are a nightmare to untangle later.
Honestly, monthly is ideal but quarterly works too if you're swamped. Markets move so damn fast now - something that mattered last quarter could be totally useless today. I made this mistake once where we tracked this one metric for like 8 months after it stopped being relevant lol. When you do review, ask yourself: does this still connect to our actual business goals? Is it making people behave the right way? Do stakeholders even care anymore? Just throw it on your calendar as a recurring thing. Don't feel bad about ditching metrics that aren't helping - it's actually freeing.
Just be upfront with your team about what you're tracking and why. Nobody wants to feel like they're being watched constantly. Pick metrics that actually help people improve their work, not just random surveillance stuff. Watch out for measurements that might unfairly hit certain team members harder than others - that's always messy to deal with later. Don't micromanage every tiny detail either. Your goal is helping people succeed, not playing gotcha when they mess up. Honestly? Start by asking what metrics would genuinely help them do their jobs better.
Yeah, culture totally changes how people react to performance stuff. Some teams love individual rankings and competition - others think it's super awkward or divisive. Direct cultures want the raw numbers, but indirect ones need you to present things more carefully. Also time perspective is wild - some focus on quarterly goals while others care way more about long-term relationships than hitting short-term numbers. Honestly? Just ask your team what they prefer. Then tweak both what you measure and how you show it to them.
No Reviews