


Profit and expenses percentage circle






Try Before you Buy Download Free Sample Product
 Impress Your
Audience
 100%
Editable
 Save Hours
of Time


Don't allow arrogance to blind you with our Profit And Expenses Percentage Circle. They ensure you are always grounded.
People who downloaded this PowerPoint presentation also viewed the following :
Content of this Powerpoint Presentation
Description:
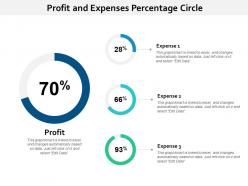
The image displays a presentation slide titled "Profit and Expenses Percentage Circle." The slide contains four donut charts, each chart representing a percentage value. The largest chart in the center represents 'Profit' annotated with a significant 70%. Around it are three smaller charts indicating 'Expense 1' at 28%, 'Expense 2' at 66%, and 'Expense 3' at 93%. Below each donut chart, there is a text box explaining that the graph or chart is linked to Excel and can be dynamically updated by clicking on it and selecting "Edit Data." This functionality allows real-time data synchronization and an easier update process for the presenter, reflecting changes in the underlying dataset without manually adjusting the chart.
Use Cases:
Now, let's explore seven potential industries where this type of presentation slide could be utilized:
1. Financial Services:
Use: Visualizing financial performance and expense management
Presenter: Financial analyst
Audience: Investors and company management
2. Retail:
Use: Showcasing profit margins and categorizing different operational costs
Presenter: Store manager or retail operations analyst
Audience: Retail executives and stakeholders
3. Healthcare:
Use: Illustrating cost breakdown of healthcare services and profit ratios
Presenter: Hospital administrator or financial officer
Audience: Hospital board members and department heads
4. Real Estate:
Use: Representing profit on sales and various expenses involved in property management
Presenter: Real estate developer or financial consultant
Audience: Investors and real estate business owners
5. Education:
Use: Demonstrating financial ratios between educational institution earnings and expenditures such as facilities, staff, and materials
Presenter: School financial officer
Audience: School board and educational committee
6. Manufacturing:
Use: Detailing contribution to profits from manufacturing processes and expenses across different departments or processes
Presenter: Operations manager
Audience: Company executives and department managers
7. Information Technology:
Use: Displaying profit from software or service sales and associated expenses like R&D, marketing, and support
Presenter: Chief Financial Officer or financial analyst
Audience: Shareholders and senior management team
Profit and expenses percentage circle with all 6 slides:
Formulate a contract that is to your advantage with our Profit And Expenses Percentage Circle. Be able to extract a favorable deal.
FAQs for Profit and
Honestly, start with gross profit margin - that's revenue minus your direct costs, shows if the business model even makes sense. Net profit and operating margins are obvious ones to track. Customer acquisition cost vs lifetime value is huge too, probably more important than people realize. Cash conversion cycle is another good one if you're not already on it. The thing that really helped me was breaking down contribution margin by each product line - you'll be surprised which ones are actually making money. Pull these weekly and patterns jump out that you'd never catch just staring at revenue numbers.
So profitability analytics breaks down your revenue and costs for each product or service. That way you can see what's actually making money versus what's just draining your wallet. You'll catch weird stuff like products selling tons but with garbage margins, or services that seemed profitable until you realized how much customer support they need. Honestly, running these numbers for the first time is kind of a reality check - I remember being shocked at some of our "bestsellers." Don't just look at revenue though. Track customer acquisition costs, support expenses, all that fun stuff. Then you can decide whether to fix the losers or just dump them.
So customer segmentation is basically figuring out which groups actually make you money vs. the ones that are expensive headaches. You can break them down by how they behave, demographics, value - whatever makes sense. Like maybe your enterprise clients have way better margins than those bargain hunters who bounce after three months. Different regions might have totally different cost structures too. Honestly, once you stop thinking all revenue is the same, you'll see exactly where to focus your energy and where to maybe... not waste time.
Honestly, predictive analytics is way better than just staring at last quarter's numbers and hoping for the best. It digs into your historical data, customer patterns, and market trends to actually figure out what's driving your margins. The cool part? It catches stuff you'd totally miss - like how different customer types react during economic weirdness or those seasonal cost patterns that sneak up on you. You'll spot profit changes before they wreck your P&L. Just start by running your current financial data through a predictive model and see how it stacks up against whatever method you're using now. Give it a few months to prove itself.
Honestly, the worst mistake is messing up your overhead allocation - garbage in, garbage out, you know? A lot of people obsess over revenue numbers but totally miss what's actually driving profit. Customer acquisition costs are another blind spot - like, how can you calculate lifetime value if you're ignoring what it costs to get customers in the first place? Don't fall into the trap of tracking literally everything either. Pick the metrics that actually help you make decisions. Clean data matters way more than fancy analysis, and you gotta define what "profitable" means for YOUR business first.
Honestly, you've gotta bake this stuff right into how your teams already work. Put those margin numbers on dashboards people actually look at - customer profits, product performance, all that. Too many places just let finance hoard the data in some random spreadsheet nobody checks. Make it part of weekly meetings and pricing calls. Seriously, checking profitability should be as automatic as checking your phone. Pick your top 3 decisions that mess with margins and set up simple alerts for those. Oh, and make sure it's not a pain to find - if people have to dig for numbers, they won't.
Start with Excel or Google Sheets - seriously, pivot tables will take you way further than you think. Most people jump to fancy tools too quickly. Power BI and Tableau are solid next steps when you need better visuals for different segments or products. Python with SQL gets you into the really detailed stuff like customer profitability analysis, but honestly? That's overkill unless you're drowning in data. Match whatever tool to your team's actual skills first. I've seen too many companies buy expensive software that just sits there unused. Build up from what you already know.
Dude, those external economic factors will absolutely wreck your profit models if you ignore them. Inflation hits material costs hard - way harder than your old data shows. I learned this the painful way last quarter, honestly. Interest rates and market swings? They'll throw off your forecasts too. Currency stuff, recession fears, supply chain mess - it all adds up fast. You've gotta bake these variables right into your analytics framework. Don't rely on outdated assumptions. Run stress tests against different scenarios regularly so you can adjust quick when everything goes sideways.
So instead of staring at those nightmare spreadsheets, visual stuff like charts and dashboards actually make sense of your profit data. You'll spot trends way faster and see which products or regions are killing it vs. dragging you down. Heat maps are honestly my favorite for this - patterns just jump out immediately. Interactive dashboards let you zoom in on specifics without drowning in numbers. Though here's the thing: pick your visualization based on what you're actually trying to figure out first, otherwise you'll just make pretty charts that don't help.
Think of it like investing - you can't put everything into either safe bets or risky stuff. I'd do maybe 70% on what's already making you money, then gamble the rest on R&D or expanding into new markets. Track your quarterly numbers obviously, but also watch the future stuff - how long customers stick around, whether you're gaining market share, that kind of thing. Most people get obsessed with one side and either run out of cash or never grow. Honestly? Just look at where your money's going right now and see what needs fixing.
Honestly, I'd go with activity-based costing (ABC) first - it's way more accurate since it actually tracks what resources each unit uses. Direct costing is easier but kinda meh for precision. If you need something fast for the executives, contribution margin analysis works great because it focuses on variable costs and helps with decisions. Oh, and if departments are doing internal transactions, transfer pricing models exist but they're honestly a pain to set up. Balanced scorecards are cool too since they mix financial stuff with operational metrics. ABC if you want the real numbers, contribution margin if you're in a hurry.
Profitability analytics will blow your mind - it shows which products and customers actually make you money at different price points. Goes way beyond basic costs too, factoring in stuff like customer acquisition and support expenses per sale. I've seen people realize their "VIP" customers were actually bleeding them dry. Break down your data by customer type and product line first. You'll spot where you can bump prices without losing sales, or discover you're basically giving away profit on certain items. Sometimes the patterns are totally backwards from what you'd expect.
Look, when you make your operations run smoother, you're basically cutting costs without losing any sales - which is honestly the easiest way to boost profits. Think about it: less waste, better processes, smarter use of what you've got. All that drops straight to your bottom line. Your cost of goods goes down, overhead shrinks, and you get more out of your equipment and people. The cool thing is these improvements keep paying off month after month, not just once. I'd start by figuring out where you're bleeding the most money operationally - that's usually where you'll see the biggest profit jump when you fix it.
Honestly, profitability analytics will blow your mind - most companies think they know who their best customers are but they're dead wrong. You'll spot which products and channels actually make money versus the ones that just create a lot of noise. Focus on your winners and either fix the losers or cut them loose. The real advantage? Better pricing decisions and putting resources where margins are highest. Oh, and understanding your costs better than competitors do - that's huge. Start by breaking down your profitability data into segments. Look for patterns you can jump on right away.
So predictive analytics with AI is becoming standard now - it's not just reporting what happened but actually forecasting profit scenarios. Real-time tracking is everywhere too. You can catch margin problems instantly instead of waiting weeks for reports. The customer analytics are getting crazy sophisticated (like, almost creepy how well they predict lifetime value). Everything's shifting from "what went wrong last month" to "what's coming and how do we get ahead of it." Honestly, you should probably start looking at these AI tools soon. Your competition definitely is.
No Reviews