Proven Ways To Increase Your Service Value Powerpoint Presentation Slides
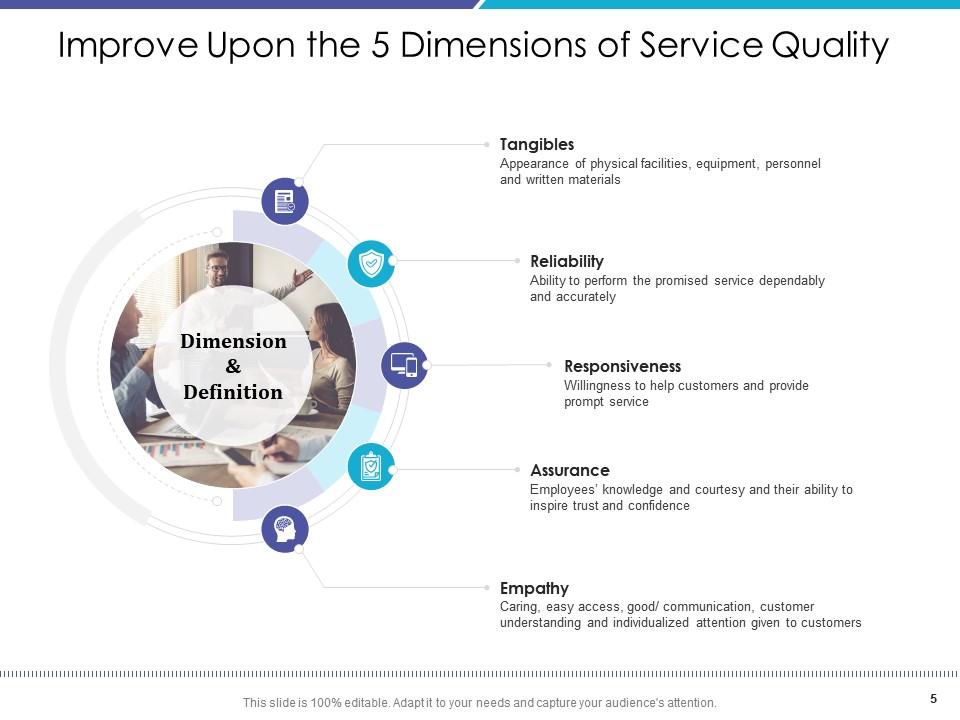
Create bedrock for your business to shine distinctively among your competitors by using our Proven Ways To Increase Your Service Value PowerPoint Presentation Slides. Explain the need for a service system and the factors important to fulfil it using our service metrics PPT template. The competitor analysis PowerPoint presentation explains that in order to achieve an edge over your competitors you have to focus on greater service value. The Porter analysis PowerPoint template covers 5 dimensions of service quality including tangibles, reliability, responsiveness, assurance, and empathy. Our service strategy PPT slides help you to increase the value of your service by reducing the operation costs, pricing and increasing the offerings. Create your own service strategy using the steps mentioned in this market share PowerPoint layout starting from gathering the insights with SWOT analysis, exploring new service ideas, prioritizing ideas, to building a service roadmap. The PPT design also outlines certain service development plans like sales strategy, digital marketing plan, operations plan, initiatives, and deadlines.
- Google Slides is a new FREE Presentation software from Google.
- All our content is 100% compatible with Google Slides.
- Just download our designs, and upload them to Google Slides and they will work automatically.
- Amaze your audience with SlideTeam and Google Slides.
-
Want Changes to This PPT Slide? Check out our Presentation Design Services
- WideScreen Aspect ratio is becoming a very popular format. When you download this product, the downloaded ZIP will contain this product in both standard and widescreen format.
-

- Some older products that we have may only be in standard format, but they can easily be converted to widescreen.
- To do this, please open the SlideTeam product in Powerpoint, and go to
- Design ( On the top bar) -> Page Setup -> and select "On-screen Show (16:9)” in the drop down for "Slides Sized for".
- The slide or theme will change to widescreen, and all graphics will adjust automatically. You can similarly convert our content to any other desired screen aspect ratio.
Compatible With Google Slides

Get This In WideScreen
You must be logged in to download this presentation.
PowerPoint presentation slides
Grab our professionally designed Proven Ways to Increase Your Service Value PowerPoint Presentation Slides that are sure to impress executives, inspire team members, and other audience. You can pick strategies mentioned in the PowerPoint design according to your company’s service domain. This PPT is the most comprehensive presentation of prioritizing techniques you have asked for your business. We have used beautiful PowerPoint graphics, templates, icons, and diagrams. The content has been well researched by our excellent team of researchers. You can change the colour, fonts, texts, images without any hassle to suit your business needs. Download the presentation, enter your content in the placeholders, and present it with confidence!
People who downloaded this PowerPoint presentation also viewed the following :
Content of this Powerpoint Presentation
Slide 1: This title slide introduces Proven Ways to Increase Your Service Value. Add the name of your company here.
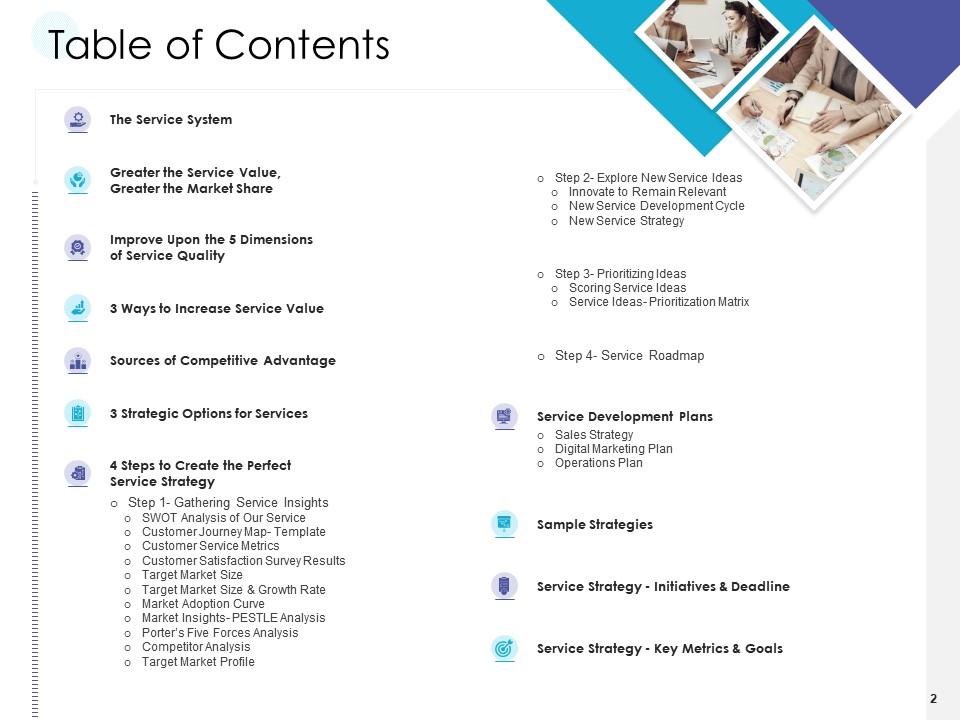
Slide 2: This slide contains a Table of Contents. This includes: The Service System, Greater the Service Value, Greater the Market Share, Improve Upon the 5 Dimensions of Service Quality, 3 Ways to Increase Service Value, Sources of Competitive Advantage, 3 Strategic Options for Services, Service Development Plans, Sample Strategies, Service Strategy - Initiatives & Deadline, and Service Strategy - Key Metrics & Goals.
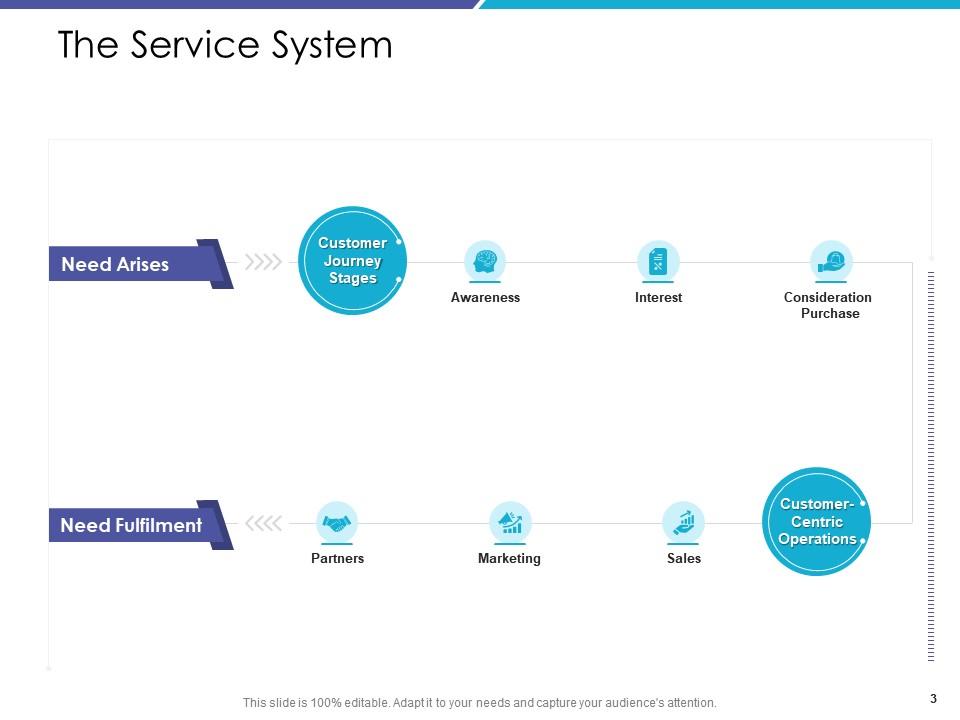
Slide 3: This is a table of content slide showing The Service System. It shows the pathway the need arising to its fulfillment.
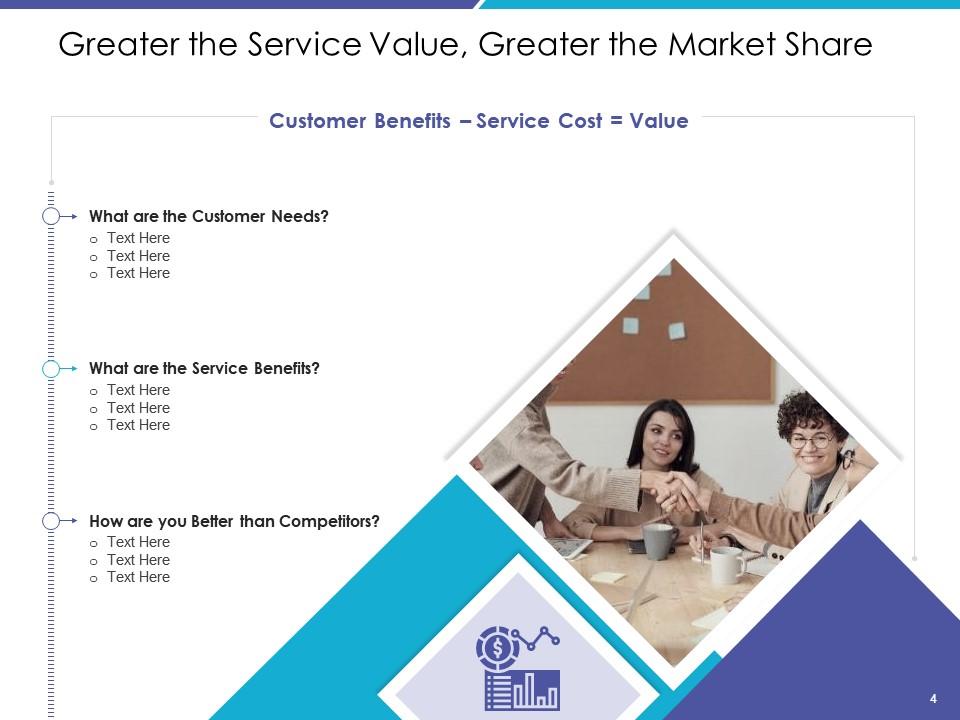
Slide 4: This is a table of content slide showing Greater the Service Value, Greater the Market Share. It asks the question What are the Customer Needs? What are the Service Benefits? and How are you Better than Competitors?
Slide 5: This is a table of content slide showing Improve Upon the 5 Dimensions of Service Quality. It includes: Tangibles, Reliability, Responsiveness, Assurance, and Empathy.
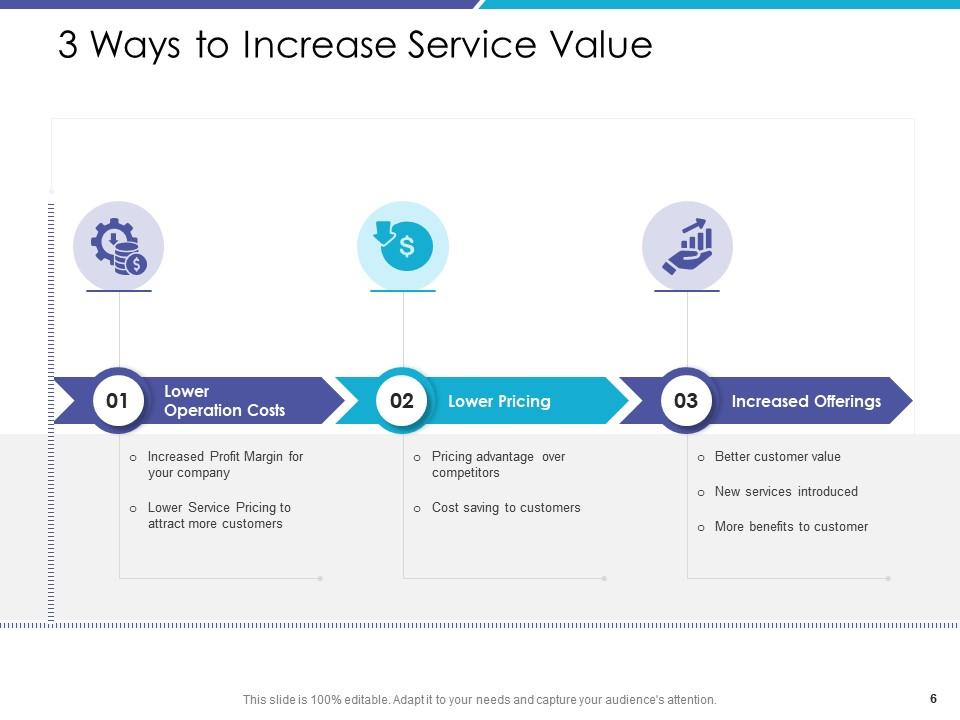
Slide 6: This is a table of content slide showing 3 Ways to Increase Service Value. It includes: Lower Operation Costs, Lower Pricing, and Increased Offerings.
Slide 7: This is a table of content slide showing the Sources of Competitive Advantage. It includes: Strategic Location, Customer Loyalty, Best Customer Service, Strong R&D, Barriers to Entry & Exit, Buying Power with Vendors, Legal Advantage, Innovative, Flexible Solutions, and Speed.
Slide 8: This is a table of content slide showing the 3 Strategic Options for Services. This includes: Do away with Unsuccessful Services, Improve Existing, Successful Services, and Launch New Services.
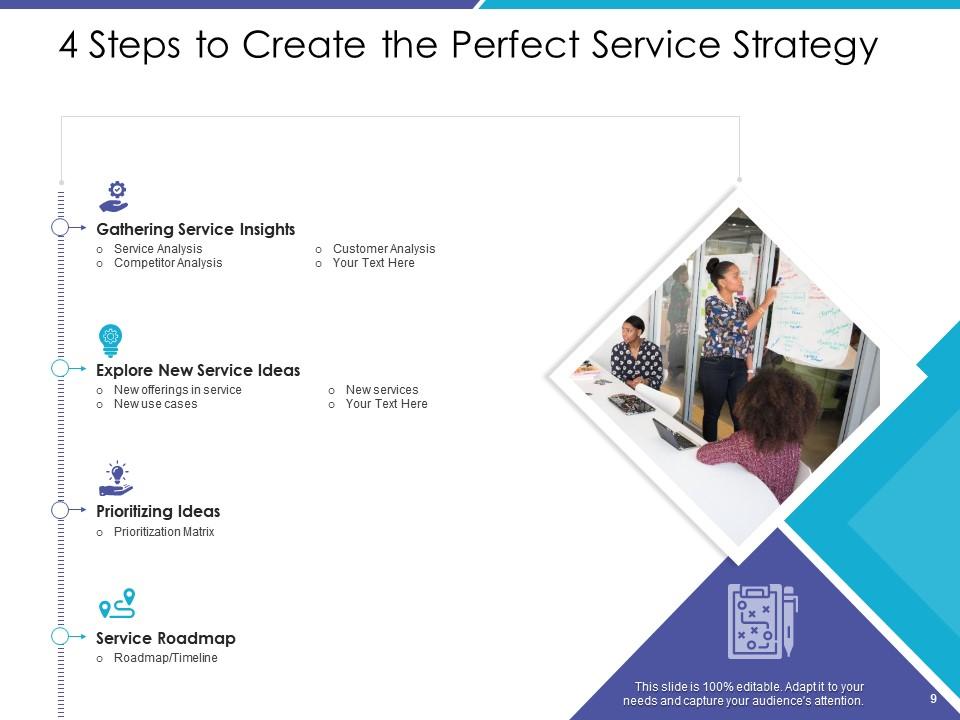
Slide 9: This is a table of content slide showing the 4 Steps to Create the Perfect Service Strategy. This includes: Gathering Service Insights, Explore New Service Ideas, Prioritizing Ideas, and Service Roadmap.
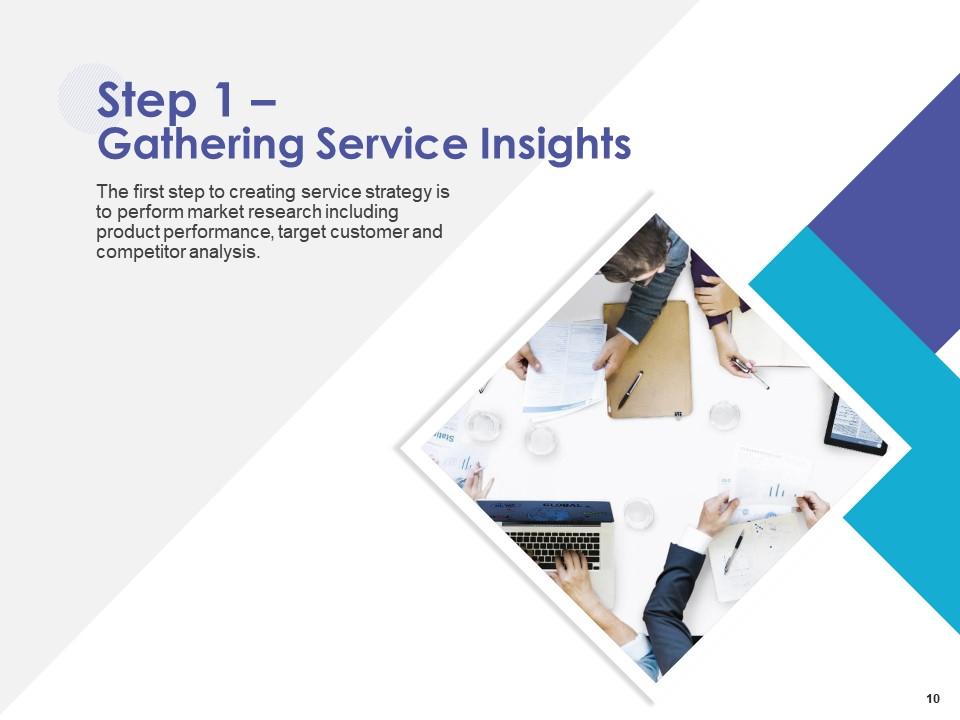
Slide 10: This slide presents Step 1 – Gathering Service Insights. The first step to creating a service strategy is to perform market research including product performance, target customer, and competitor analysis.
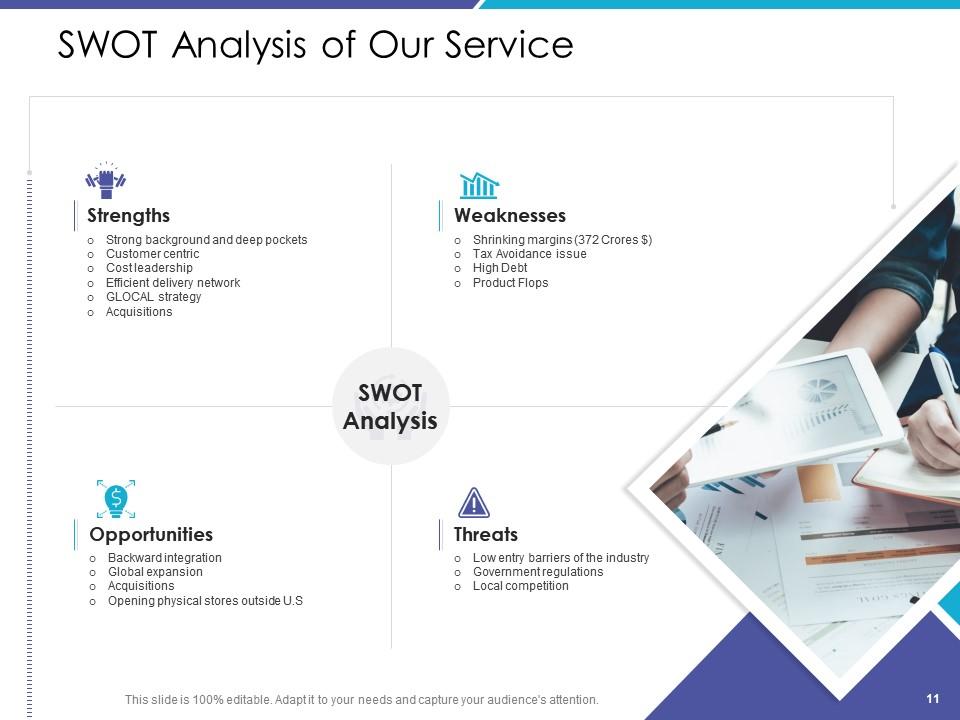
Slide 11: This slide presents the SWOT Analysis of Our Service. This includes: Strengths, Weaknesses, Opportunities, and Threats.
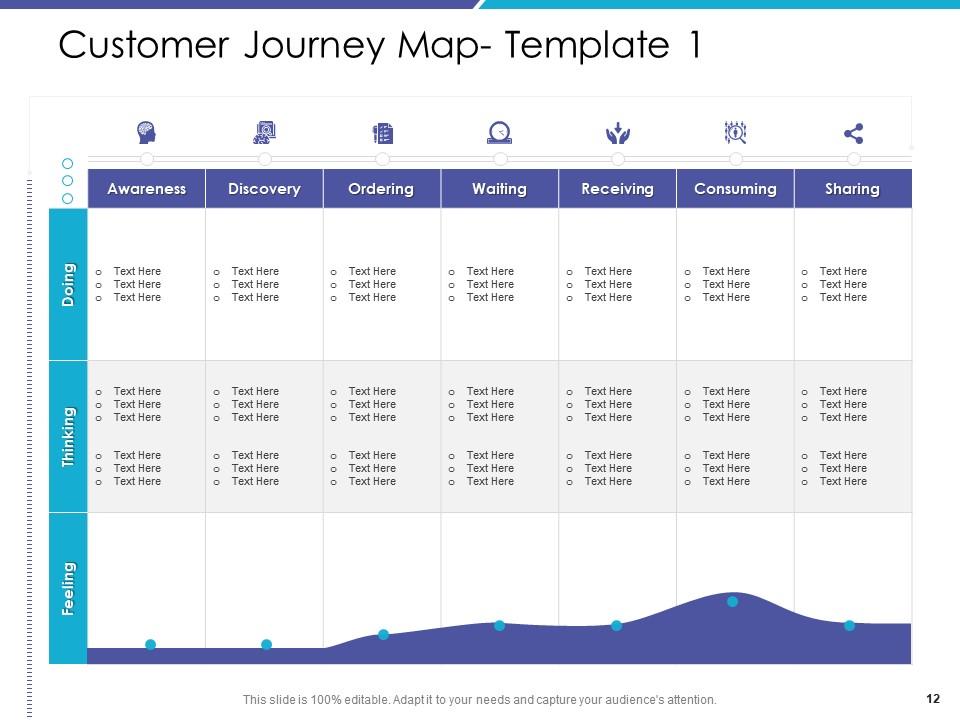
Slide 12: This slide presents the Customer Journey Map- Template 1. It tabulates the feeling, thinking, and doing against awareness, discovery, ordering, etc.
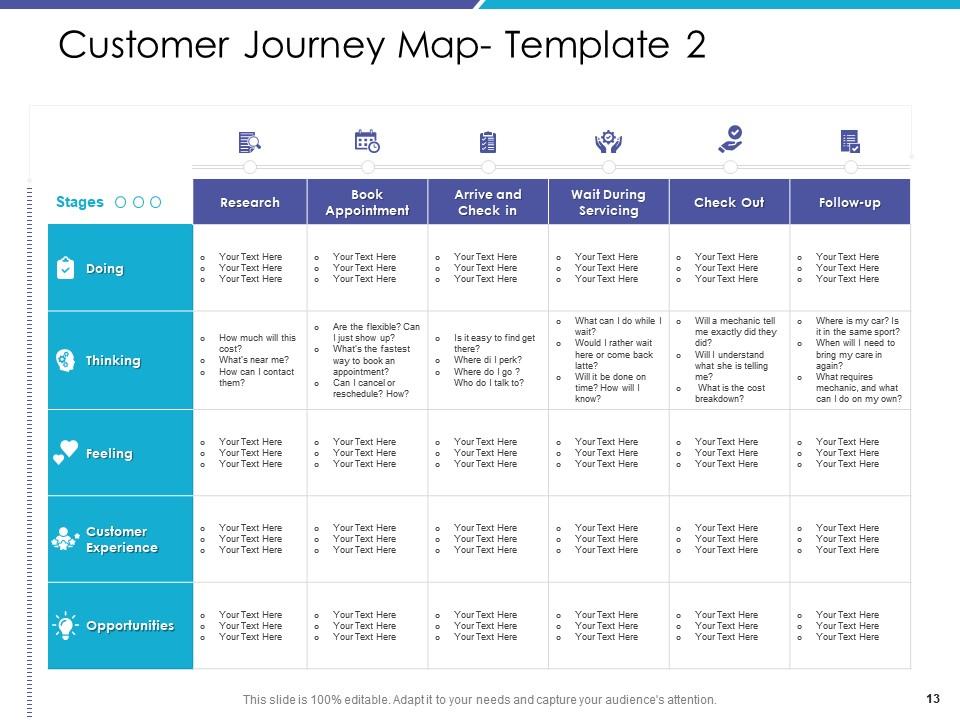
Slide 13: This slide presents the Customer Journey Map- Template 2. It tabulates the feeling, thinking, doing, etc. against research, book appointment, follow-up, etc.
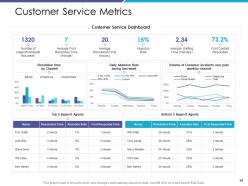
Slide 14: This slide presents the Customer Service Metrics such as Number of support incidents this week, Average First Response Time (minute), Average Resolution Time (hours), etc.
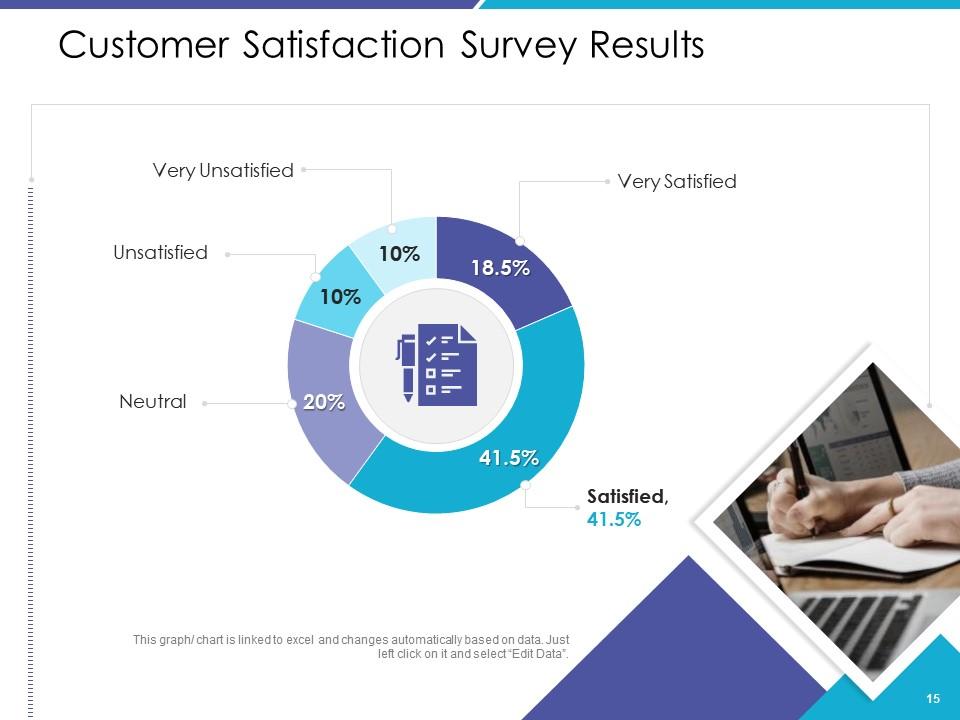
Slide 15: This slide presents the Customer Satisfaction Survey Results. The results range from very unsatisfied to very satisfied.
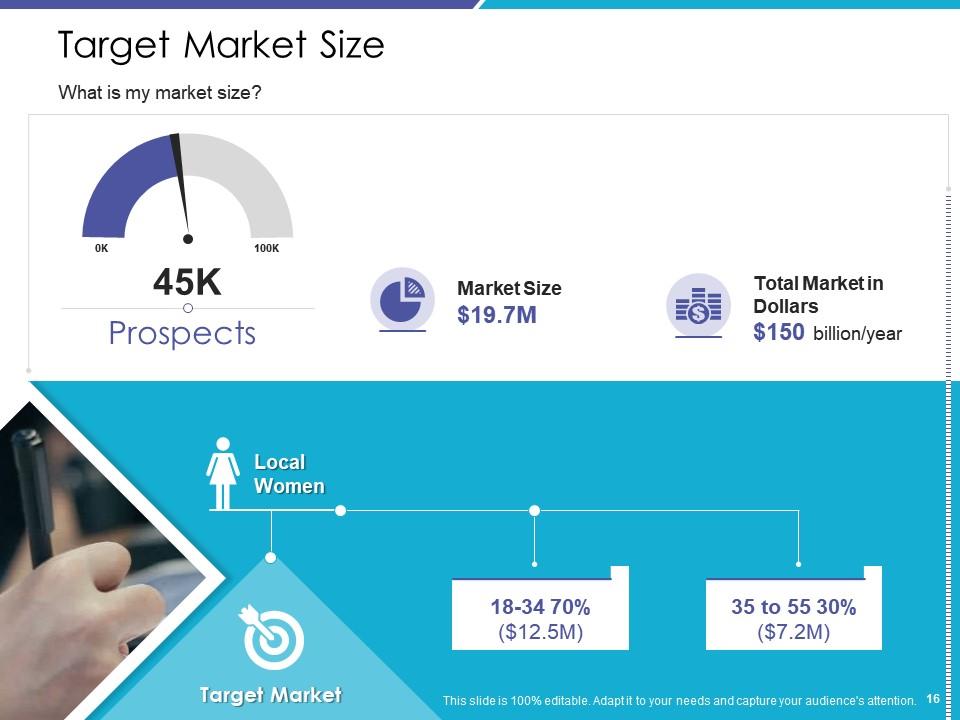
Slide 16: This slide presents the Target Market and asks the question: What is my market size for a given demographic such as local women.
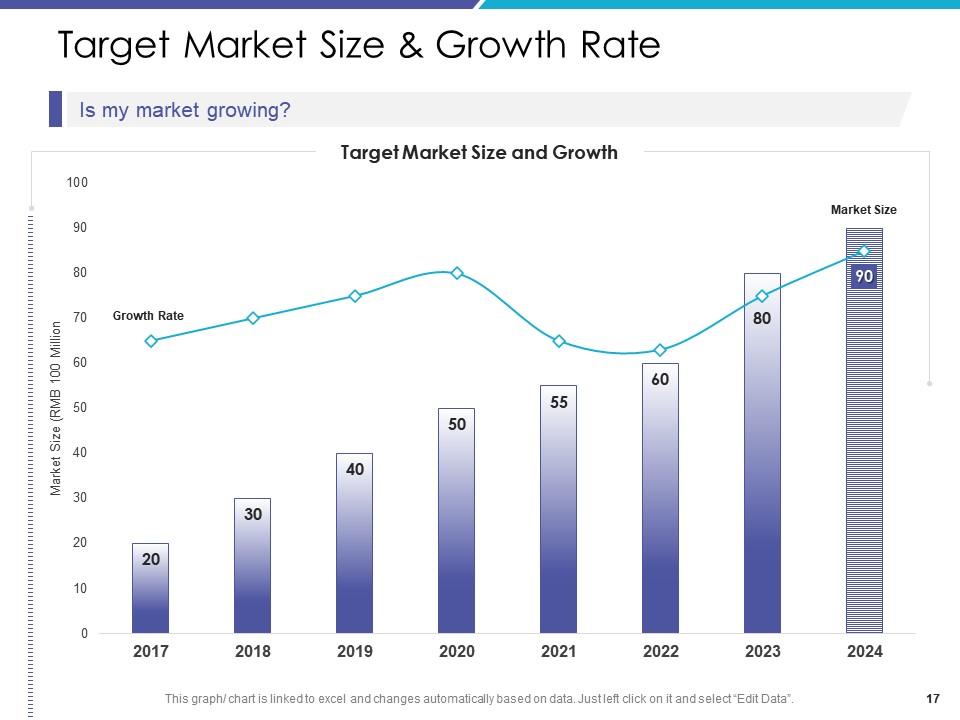
Slide 17: This slide presents the Target Market Size & Growth Rate. It graphically asks the question: Is my market growing?
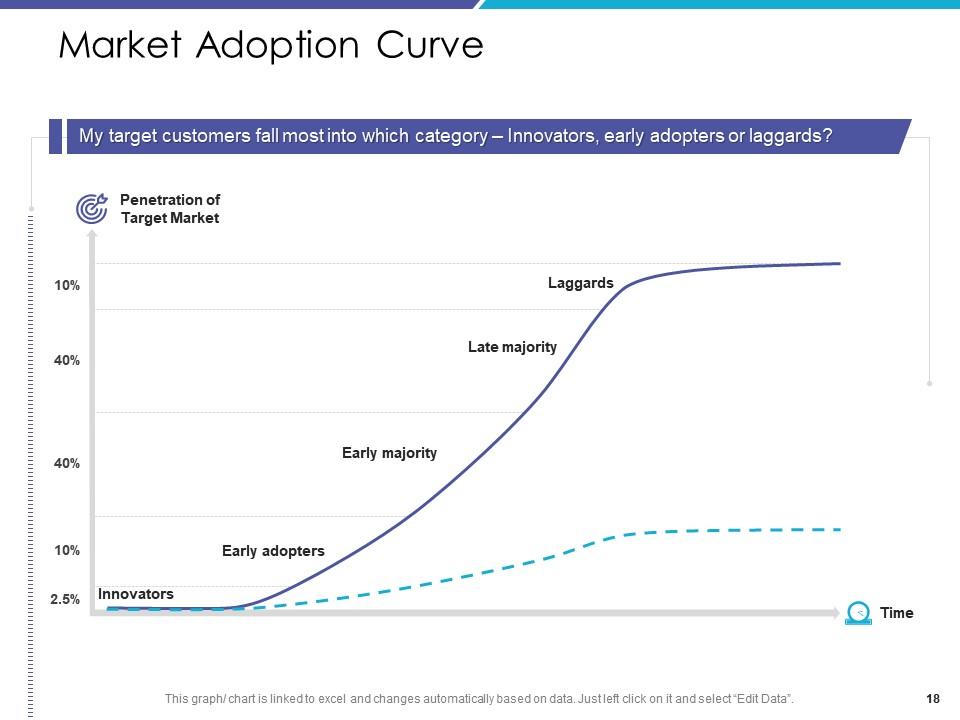
Slide 18: This slide presents the Market Adoption Curve. It asks the question: My target customers fall most into which category – Innovators, early adopters, or laggards?
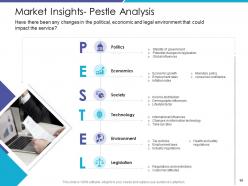
Slide 19: This slide presents the Market Insights- Pestle Analysis. It represents POLITICS, ECONOMICS, SOCIETY, TECHNOLOGY, ENVIRONMENT, and LEGISLATION.
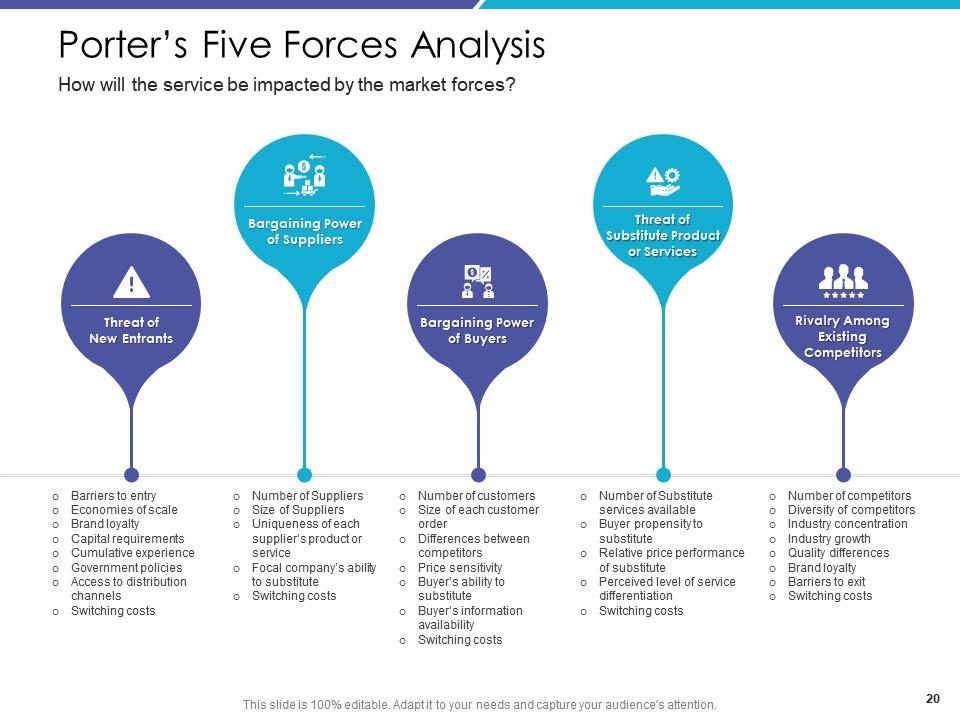
Slide 20: This slide presents Porter’s Five Forces Analysis. It includes: Threat of new entrants, Bargaining power of suppliers, Bargaining power of buyers, the threat of substitute product or services, and Rivalry among existing competitors.
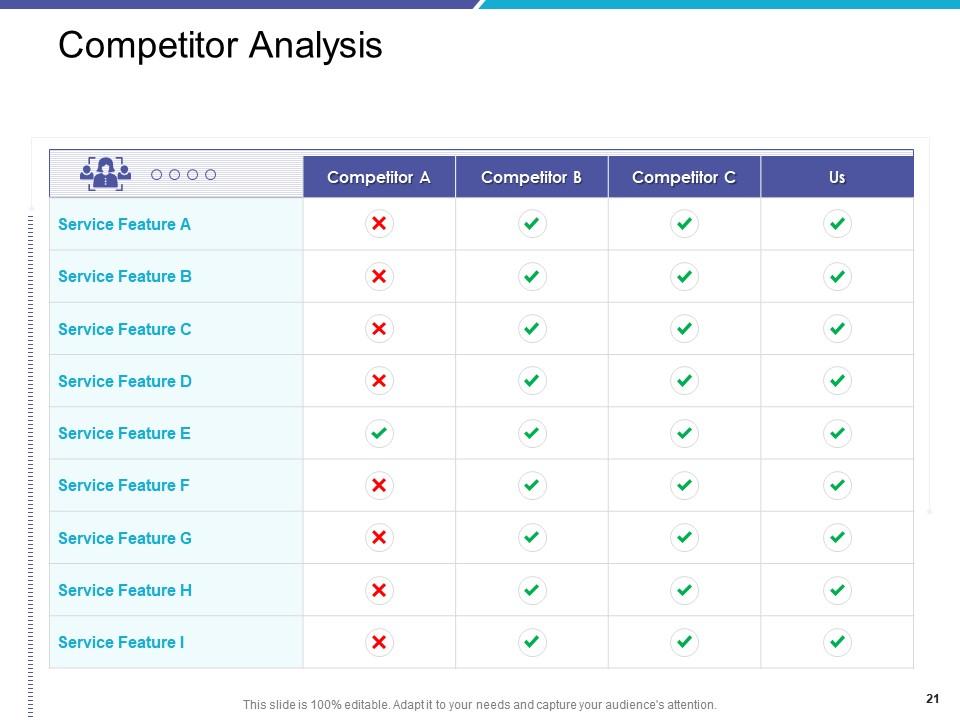
Slide 21: This slide presents the Competitor Analysis which tabulates service features against competitors.
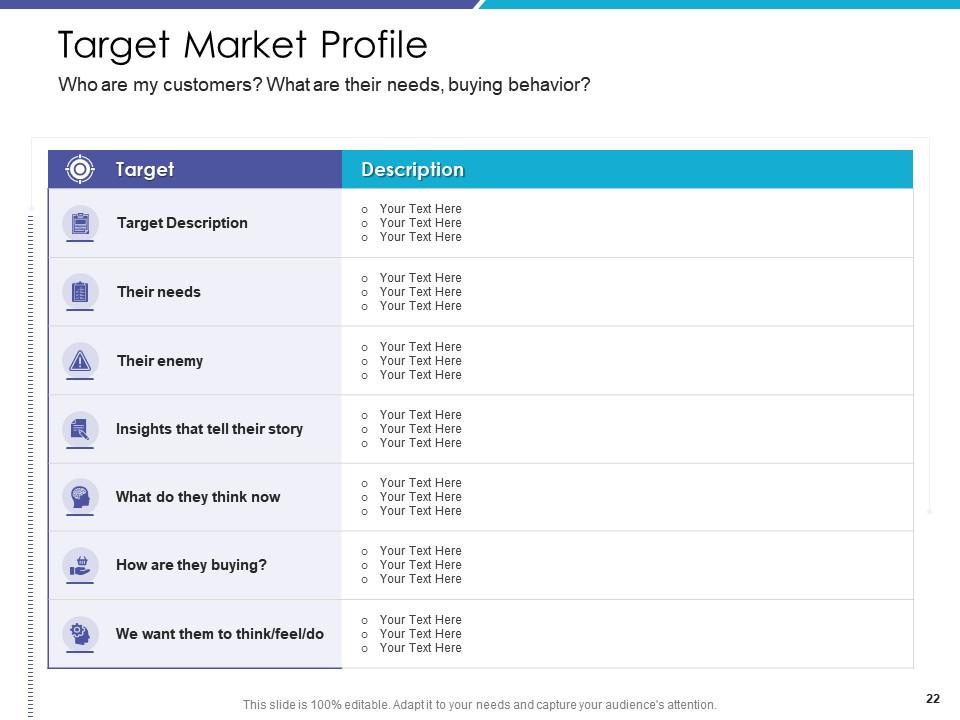
Slide 22: This slide presents the Target Market Profile. It asks the question: Who are my customers? What are their needs, buying behavior?
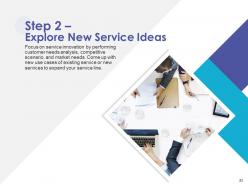
Slide 23: This is a table of content slide showing Step 2 – Explore New Service Ideas. Focus on service innovation by performing customer needs analysis, competitive scenario, and market needs. Come up with new use cases of existing services or new services to expand your service line.
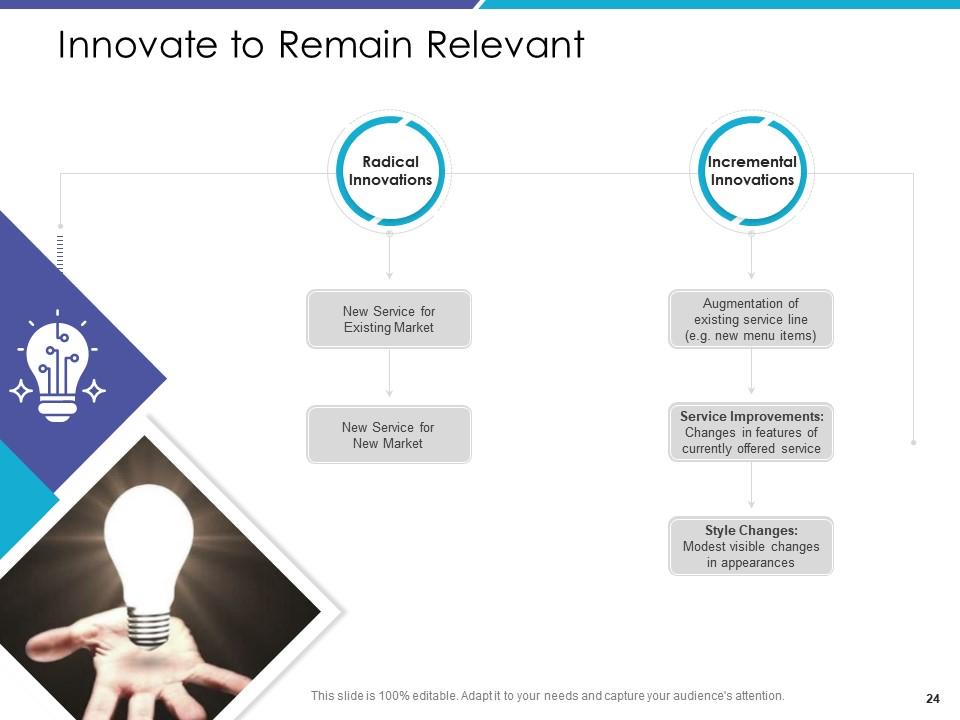
Slide 24: This slide presents Innovate to Remain Relevant. It includes Radical Innovations and Incremental Innovations.
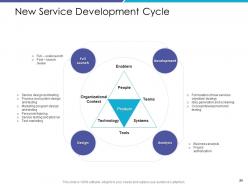
Slide 25: This slide presents the New Service Development Cycle. The cycle includes: Development, Design, Analysis, and Full Launch.
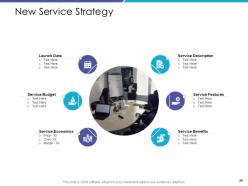
Slide 26: This slide presents the New Service Strategy. It includes: Service Description, Service Features, Service Benefits, Service Economics, Service Budget, and Launch Date.
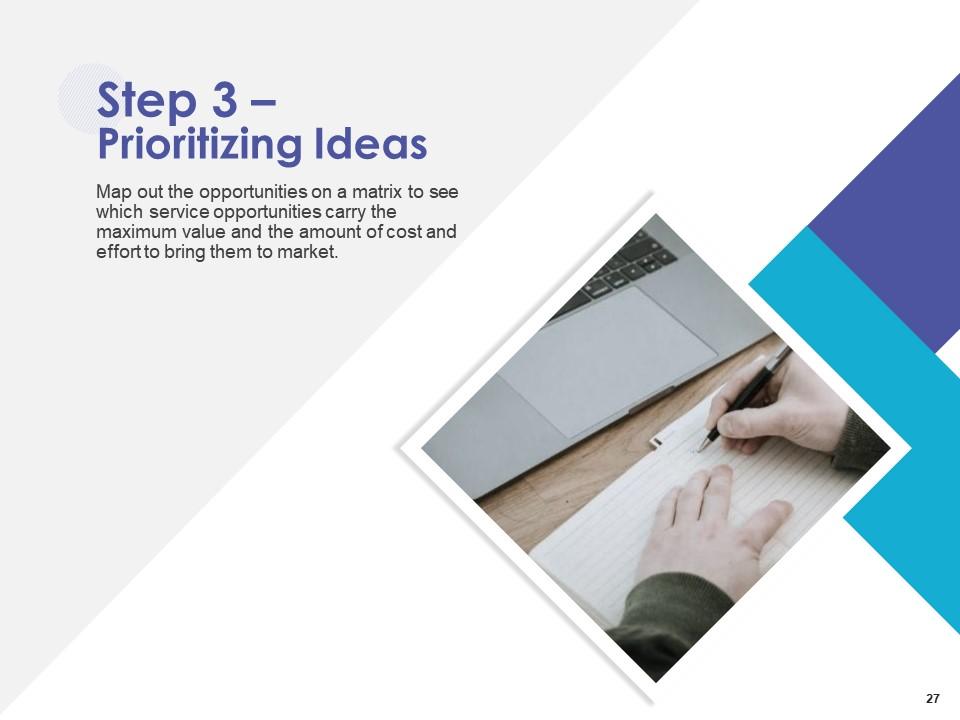
Slide 27: This is a table of content slide showing Step 3 – Prioritizing Ideas. Map out the opportunities on a matrix to see which service opportunities carry the maximum value and the amount of cost and effort to bring them to market.
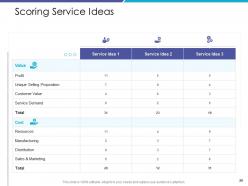
Slide 28: This slide presents the Scoring Service Ideas. It compares service ideas against their value, profit, cost, etc.
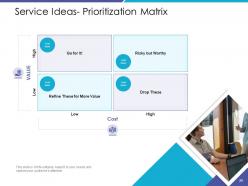
Slide 29: This slide presents the Service Ideas- Prioritization Matrix. This compares COST and VALUE.
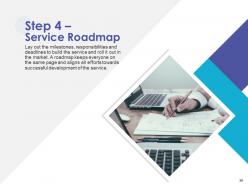
Slide 30: This is a table of content slide showing Step 4 – Service Roadmap. Layout the milestones, responsibilities, and deadlines to build the service and roll it out in the market. A roadmap keeps everyone on the same page and aligns all efforts towards the successful development of the service.
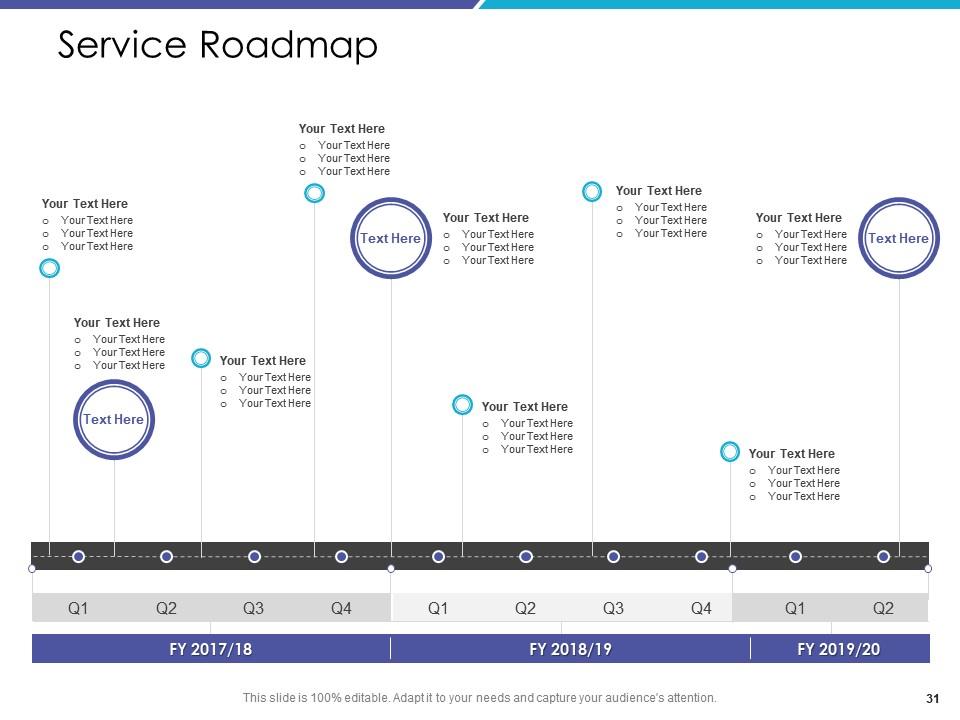
Slide 31: This slide presents the Service Roadmap. This slide is a Roadmap template to showcase the stages of a project, for example.
Slide 32: This is a table of content slide showing Service Development Plans.
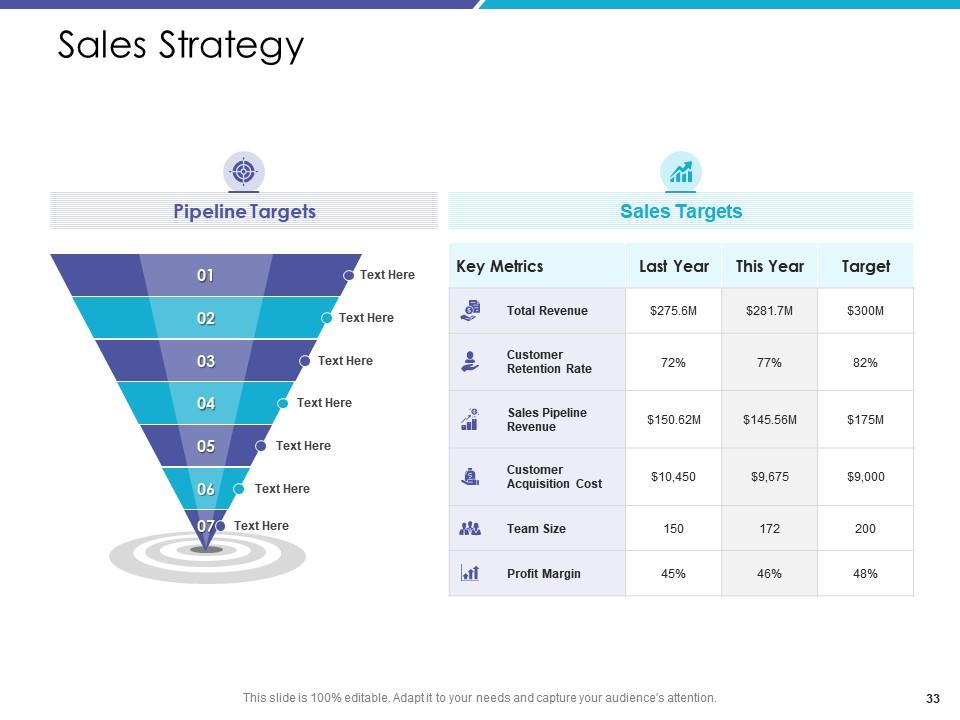
Slide 33: This slide presents the Sales Strategy. This includes SALES TARGETS and PIPELINE TARGETS.
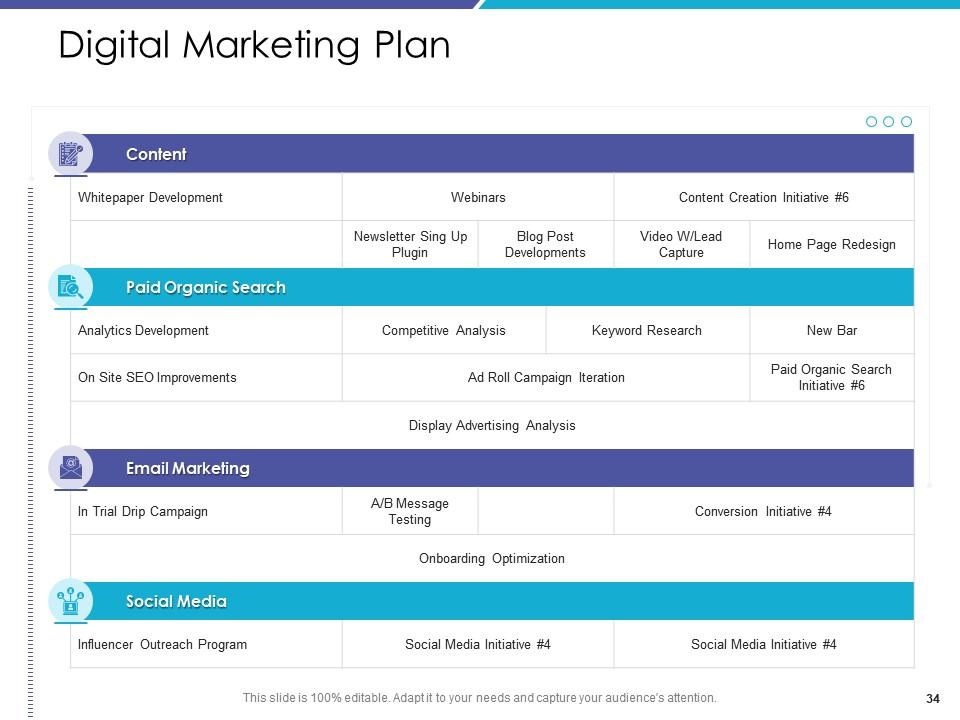
Slide 34: This slide presents the Digital Marketing Plan. It includes: Content, Paid Organic Search, Email Marketing, and Social Media.
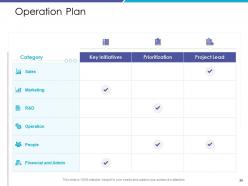
Slide 35: This slide presents the Operation Plan. It tabulates sales, marketing, operation, etc. Against key initiatives, prioritization, and project lead.
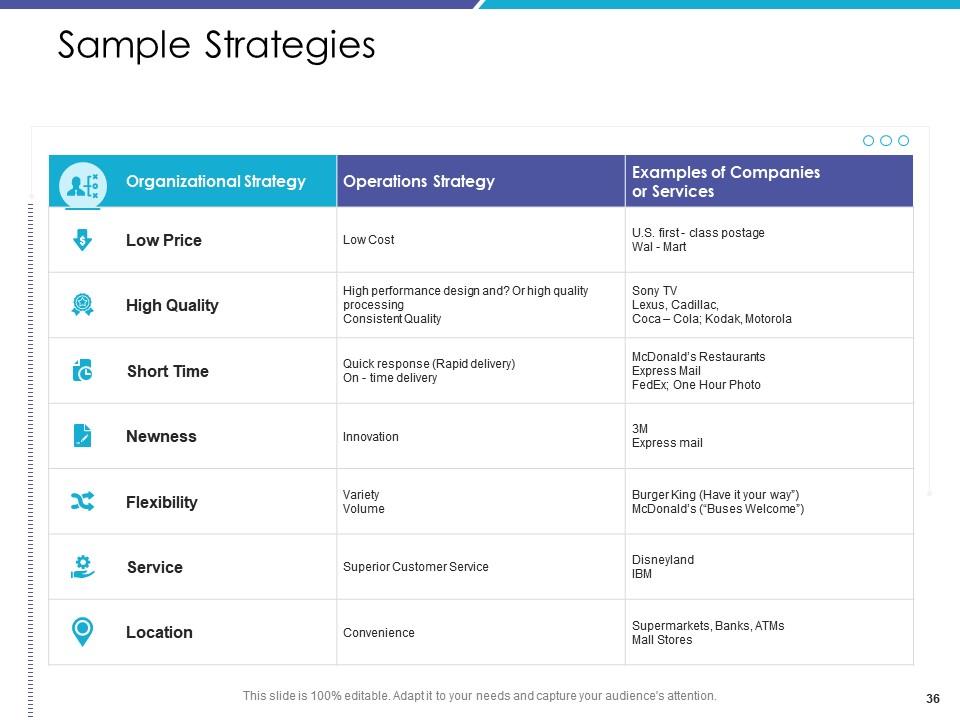
Slide 36: This slide presents the Sample Strategies such as low price, high quality, short time, etc.
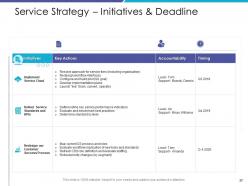
Slide 37: This slide presents the Service Strategy – Initiatives & Deadline. It talks about the initiatives and their key actions, accountability, and timing.
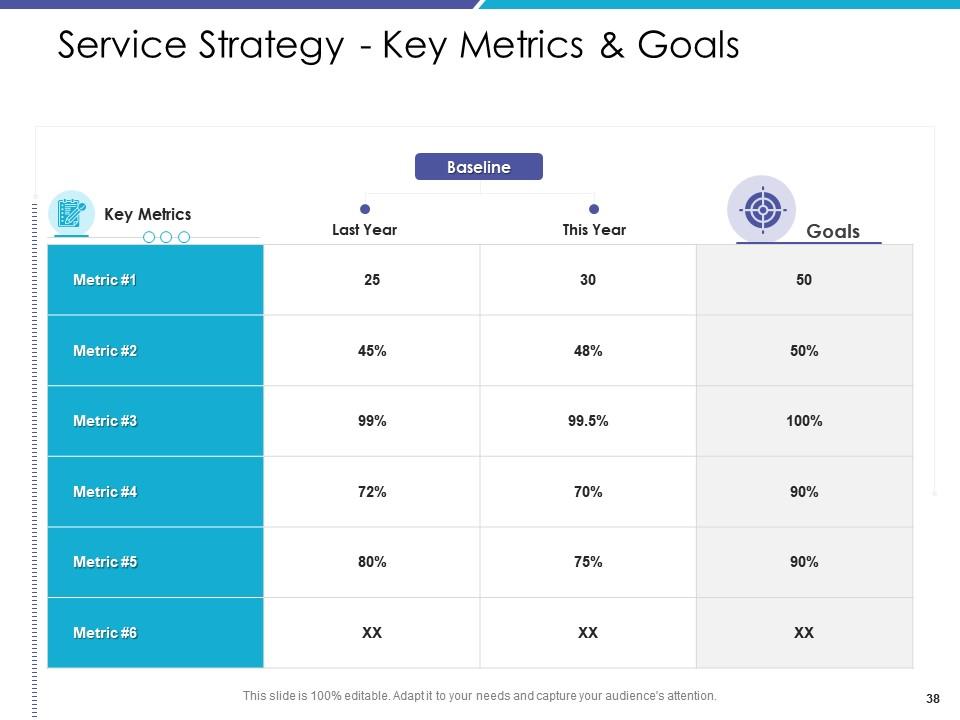
Slide 38: This slide presents the Service Strategy - Key Metrics & Goals.
Slide 39: This is the Icons Slide for Proven Ways to Increase Your Service Value.
Slide 40: This slide introduces the Additional Slides.
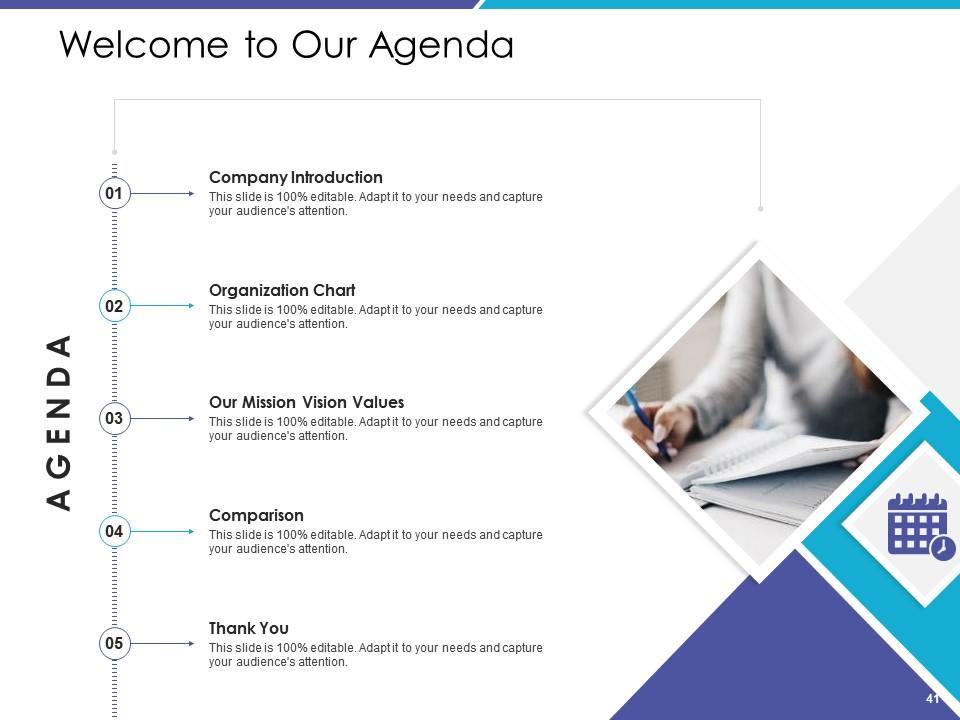
Slide 41: This slide presents the Welcome to Our Agenda. Add your daily agendas here.
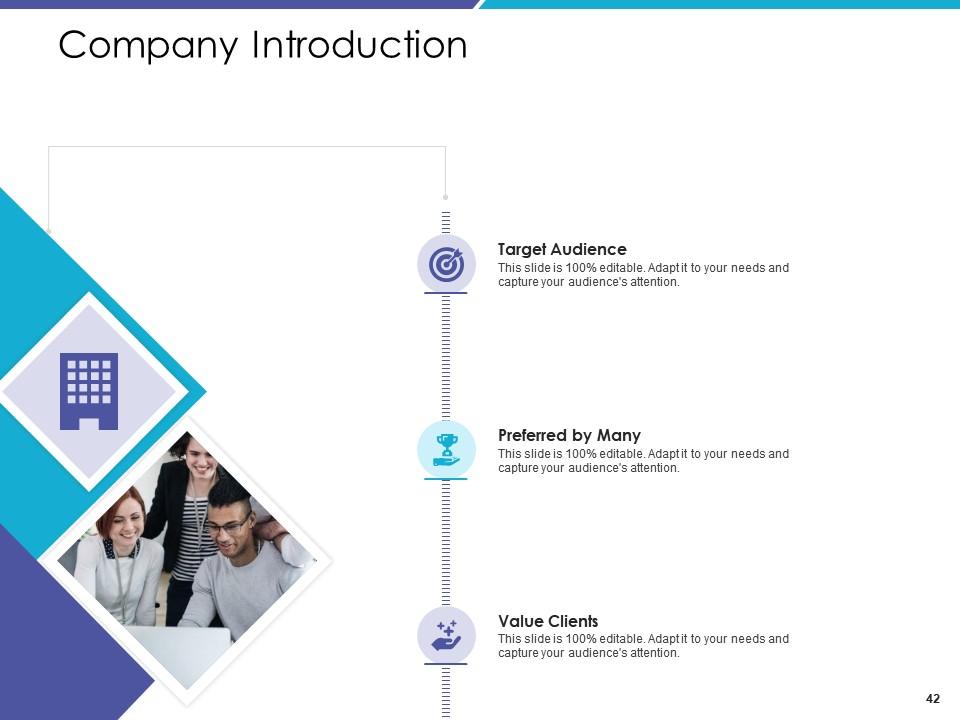
Slide 42: This slide contains the information about the company aka the ‘About Us’ section. This includes the Value Clients, the Target Audience, and Preferred by Many.
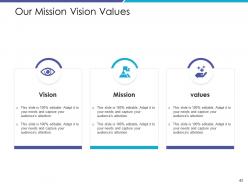
Slide 43: This slide provides the Mission for the entire company. This includes the vision, the mission, and the goal.
Slide 44: This slide presents Our Main Goal of the company as well as smaller goals within that main goal.
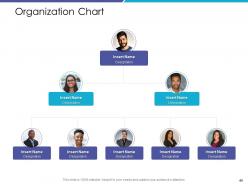
Slide 45: This slide shows the Organization Chart with members of the company with their name, designation, and photo.
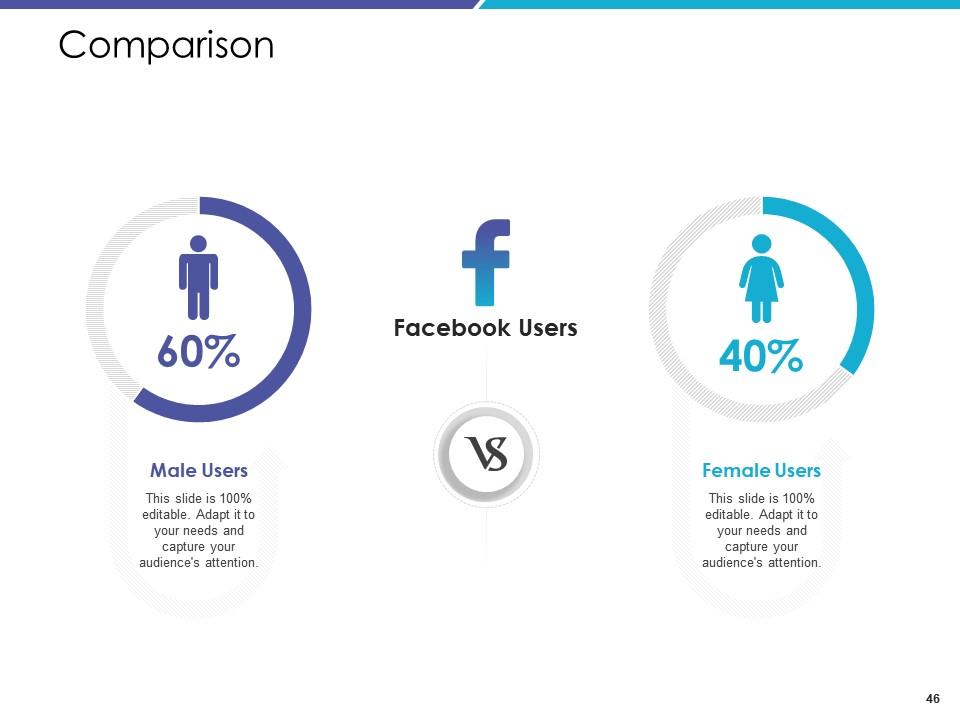
Slide 46: This slide presents a comparison between the percentage of male and female Facebook users.
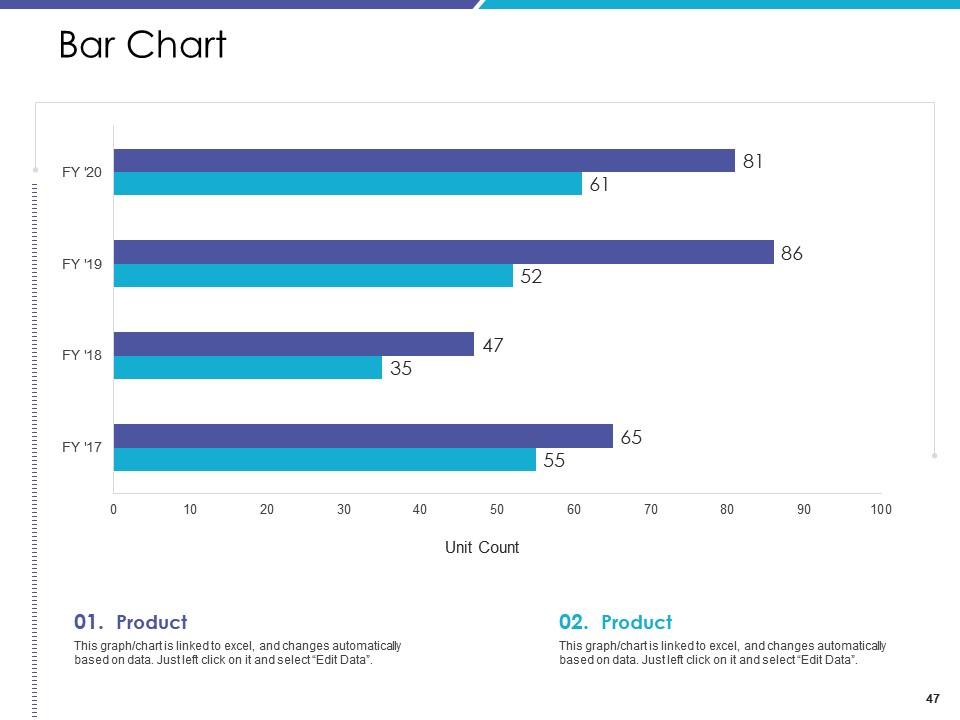
Slide 47: This slide shows a Bar Chart that compares 2 products’ unit count over a timeline of financial years.
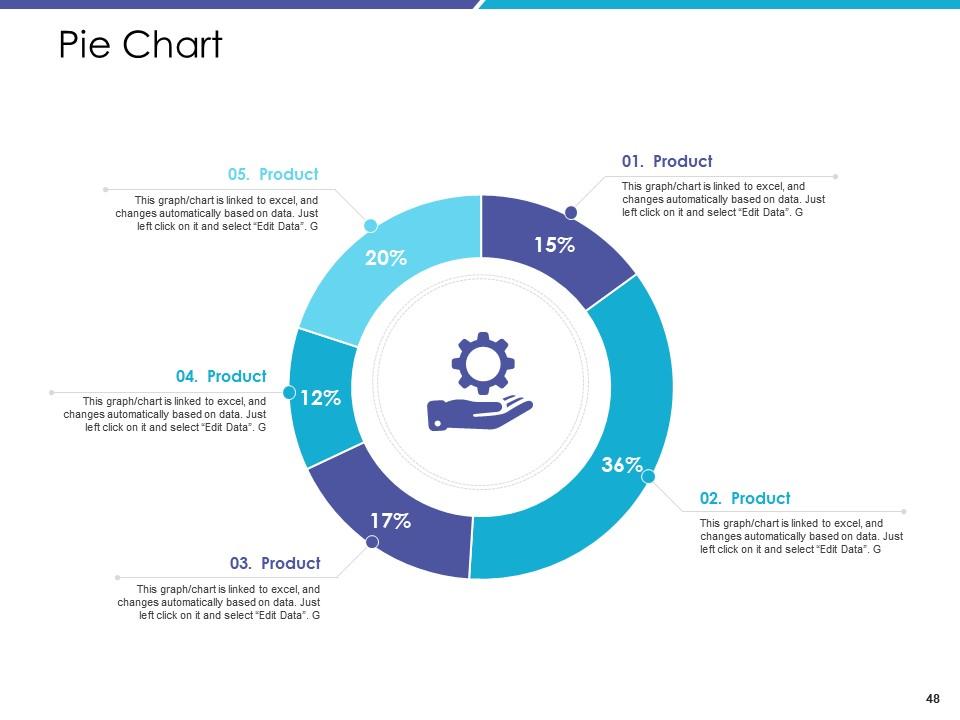
Slide 48: This slide shows a Pie Chart.
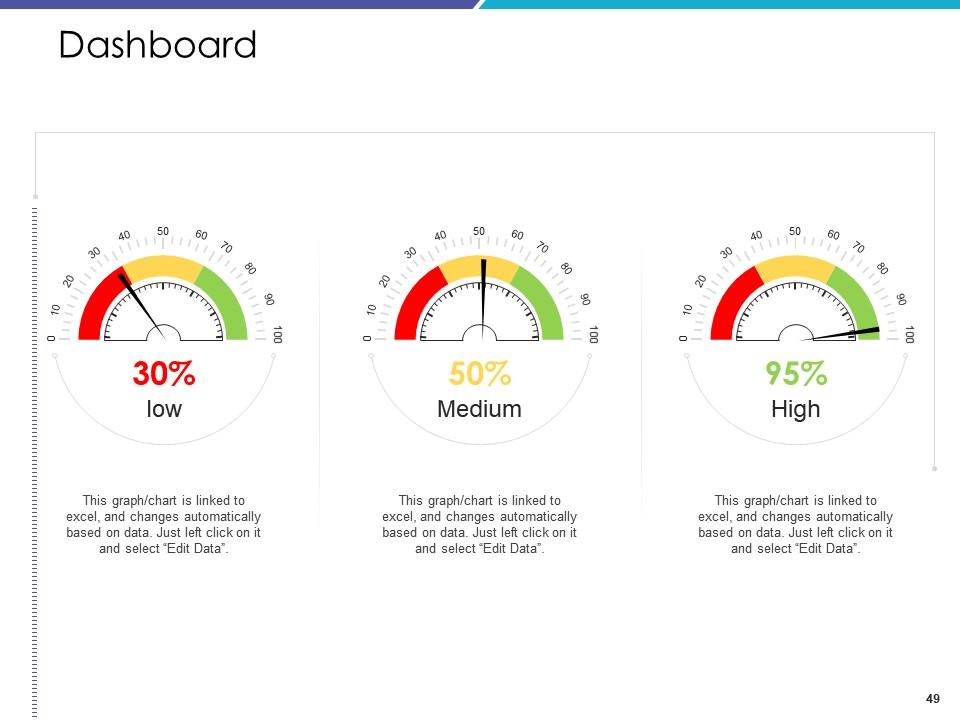
Slide 49: This slide presents the Dashboard with the data’s numbers at Low, Medium, and High.
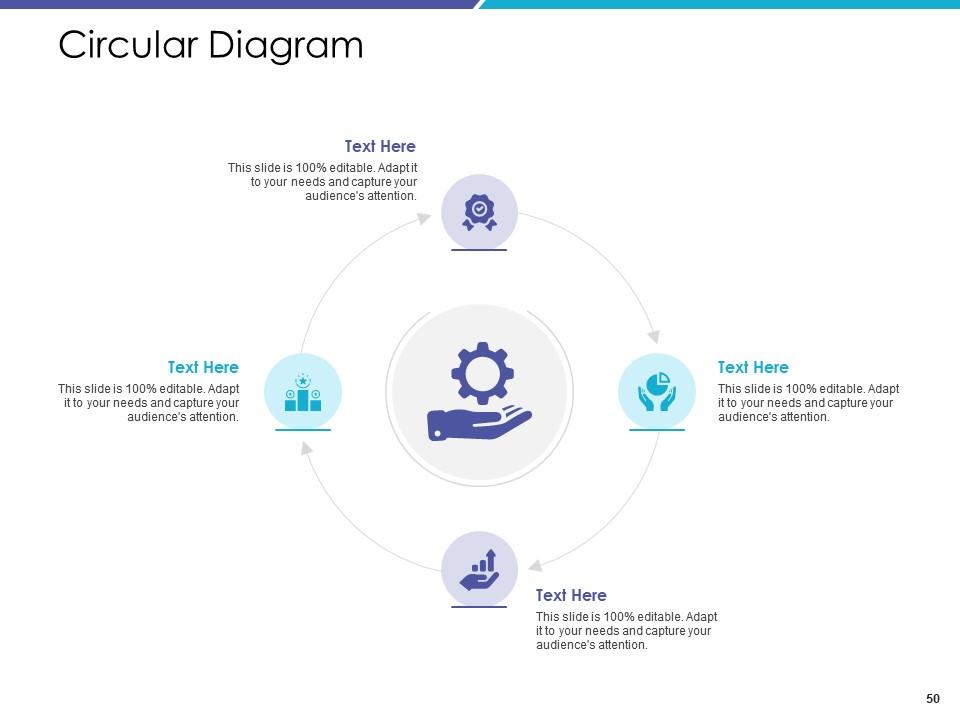
Slide 50: This slide presents a Circular Diagram and the components that make up a project or concept.
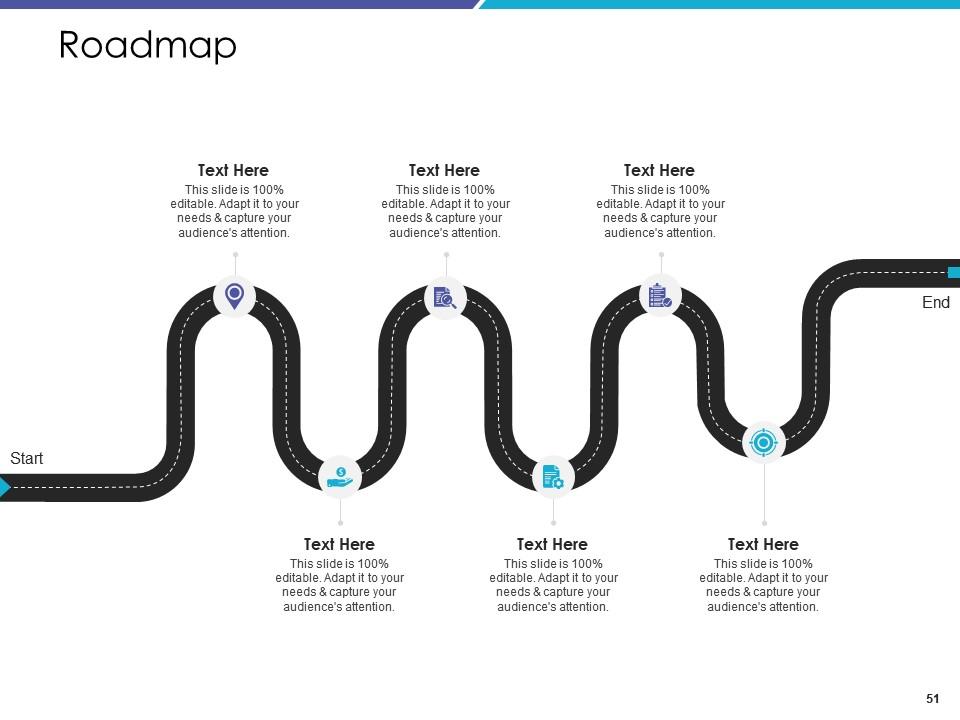
Slide 51: This slide is a Roadmap template to showcase the stages of a project, for example.
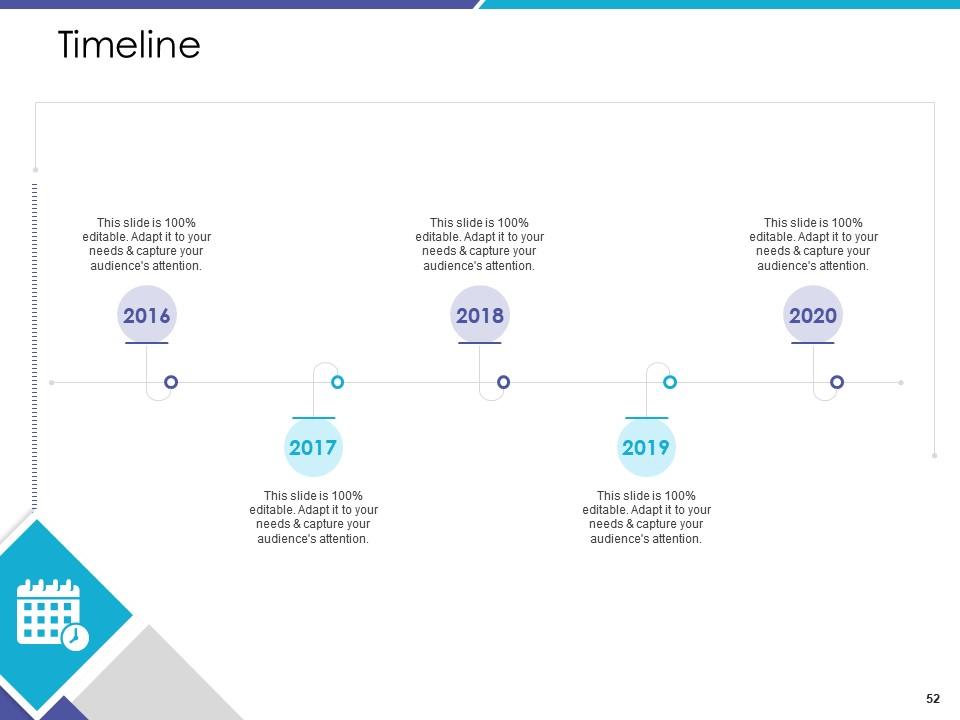
Slide 52: This slide is a Timeline template to showcase the progress of the steps of a project with time.
Slide 53: This is a Thank You slide where details such as the address, contact number, email address are added.
Proven Ways To Increase Your Service Value Powerpoint Presentation Slides with all 53 slides:
Use our Proven Ways To Increase Your Service Value Powerpoint Presentation Slides to effectively help you save your valuable time. They are readymade to fit into any presentation structure.
-
Very well designed and informative templates.
-
Qualitative and comprehensive slides.
-
Excellent template with unique design.
-
Very unique and reliable designs.
-
Use of different colors is good. It's simple and attractive.
-
Visually stunning presentation, love the content.
-
Very unique and reliable designs.
-
Design layout is very impressive.


