


Quantitative investment strategies and portfolio management powerpoint presentation slides


Try Before you Buy Download Free Sample Product
 Impress Your
 Audience
Editable
of Time


Making a QIS presentation is a big hassle. So to make your life hassle free we are presenting our 79 slides ready-made Quantitative Investment Strategies And Portfolio Management Powerpoint Presentation Slides. This quantitative investment management PPT templates example file will guide your financial team to regulate the cost of assets in a portfolio. Using our quantitative investment strategies presentation diagrams and designs like portfolio management process, investment objectives, risk tolerance analysis and matrix, risk reward matrix, asset allocation, risk return plot, target modelling, key driver analytics etc will help the presenter figure out the profit, liabilities, and asset of your business. The slides in this QIS portfolio management PowerPoint presentation are asset allocation, target modelling, parento optimal portfolio, investment approaches, portfolio return and performance, performance attribution, security analysis, current portfolio vs new portfolio. These quantitative portfolio management presentation visuals are suitable for those who want to create a presentation on related topics such as investing, financial planning, security analysis, management, strategic management, finance. Downloading this PPT deck will save you time. Just download this pectoral presentation design sample presentation, add your content and present. Remove any discomfort you may feel. A dose of our Quantitative Investment Strategies And Portfolio Management Powerpoint Presentation Slides will put you at ease.
People who downloaded this PowerPoint presentation also viewed the following :
Content of this Powerpoint Presentation
Slide 1: This is an introductory slide to Quantitative Investment Strategies and Portfolio management. State your company name and begin.
Slide 2: This is an Agenda slide. Use it to showcase your company agendas.
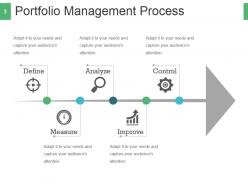
Slide 3: This slide presents Portfolio Management Process with the following steps- Define, Measure, Analyze, Improve, Control.
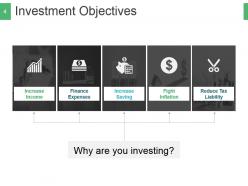
Slide 4: This is an Investment Objectives slide showing- Increase Income, Finance Expenses, Increase Saving, Fight Inflation, Reduce Tax Liability, Why are you investing?.
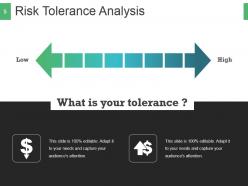
Slide 5: This slide showcases Risk Tolerance Analysis with High and Low parameters-
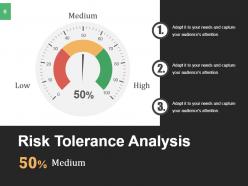
Slide 6: This is another slide showing Risk Tolerance Analysis with High, Medium and Low parameters.
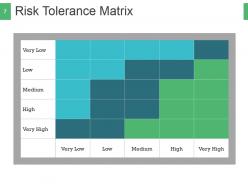
Slide 7: This slide showcases Risk Tolerance Matrix with Very Low, Low, Medium, High and Very High parameters.
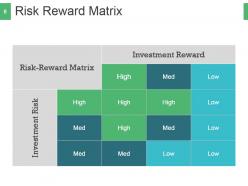
Slide 8: This is also a Risk Reward Matrix slide showing Investment Reward, Investment Risk.
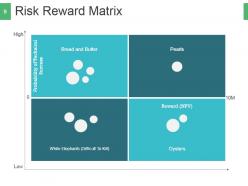
Slide 9: This is another Risk Reward Matrix slide with- Bread and Butter, White Elephants (Difficult To Kill), Pearls, Oysters.
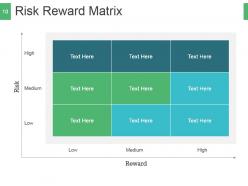
Slide 10: This slide also showcases Risk Reward Matrix with High, Medium and Low parameters.
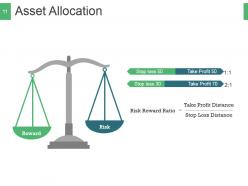
Slide 11: This is an Asset Allocation slide with balancing scale imagery. Present your Risk and Rewards here.
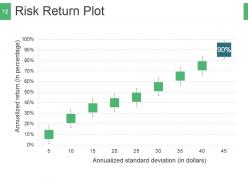
Slide 12: This slide showcases Risk Return Plot with the following 2 parameters- Annualized standard deviation (in dollars), Annualized return (in percentage).
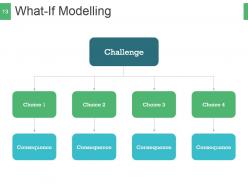
Slide 13: This is What-If Modelling slide in a flow chart form.
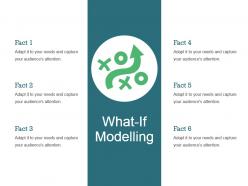
Slide 14: This is also What-If Modelling slide. Use it to state your facts.
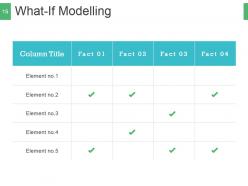
Slide 15: This slide showcases What-If Modelling table.
Slide 16: This is Target Modelling slide to state your targets etc.
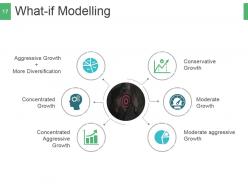
Slide 17: This slide also showcases What-if Modelling.
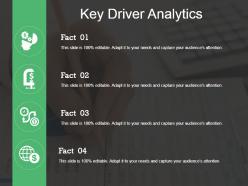
Slide 18: This slide states Key Driver Analytics with icon imagery.
Slide 19: This is another Key Driver Analytics slide with Facts.
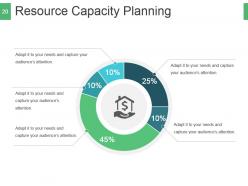
Slide 20: This slide showcases Resource Capacity Planning in a circular form.
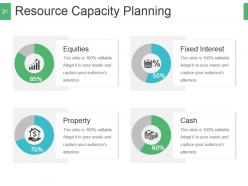
Slide 21: This is also a Resource Capacity Planning slide showing- Equities, Property, Cash, Fixed Interest.
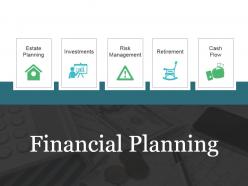
Slide 22: This slide states Financial Planning with the following components- Estate Planning, Investments, Risk Management, Retirement, Cash Flow.
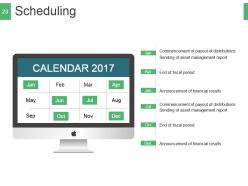
Slide 23: This is a Scheduling slide with imagery. Use it to present your schedule etc.
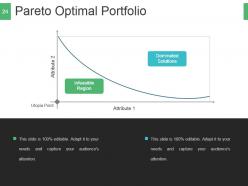
Slide 24: This slide presents Pareto Optimal Portfolio.
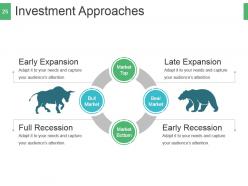
Slide 25: This slide presents Investment Approaches showcasing- Early Expansion, Early Recession, Late Expansion, Full Recession, Market Top, Bull Market, Market Bottom, Bear Market.
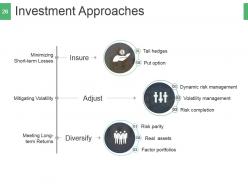
Slide 26: This slide also presents Investment Approaches showing- Minimizing Short-term Losses, Mitigating Volatility, Meeting Long-term Returns, Insure, Adjust, Diversify, Factor portfolios, Risk parity, Real assets, Volatility management, Dynamic risk management, Risk completion, Put option, Tail hedges.
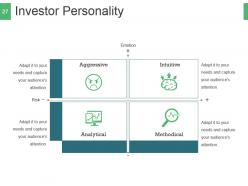
Slide 27: This slide showcases Investor Personality quadrant with Risk and Emotion parameters.
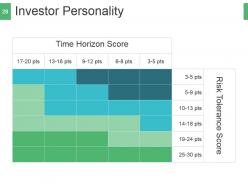
Slide 28: This is also Investor Personality slide showing- Time Horizon Score, Risk Tolerance Score.
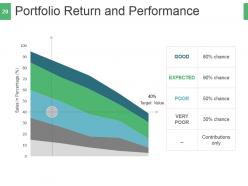
Slide 29: This slide presents Portfolio Return and Performance in a graphical form.
Slide 30: This slide also presents Portfolio Return and Performance in a graphical form.
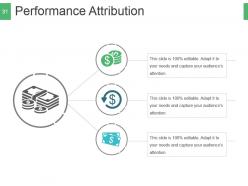
Slide 31: This is Performance Attribution slide with text boxes. State them here.
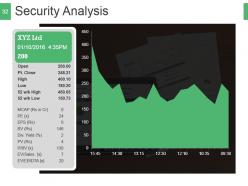
Slide 32: This slide presents Security Analysis graph.
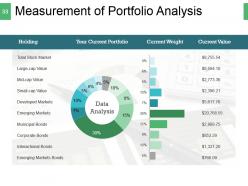
Slide 33: This is Measurement of Portfolio Analysis slide in charts and graphs.
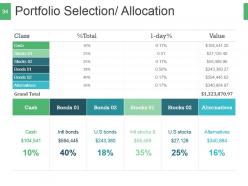
Slide 34: This slide presents Portfolio Selection/ Allocation in a tabular form.
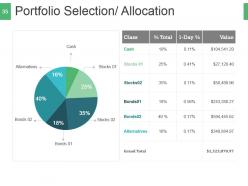
Slide 35: This is another slide showing Portfolio Selection/ Allocation in a graphical form.
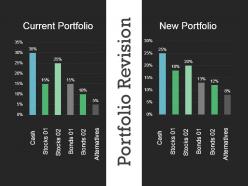
Slide 36: This is Portfolio Revision graph slide showing- Current Portfolio, New Portfolio.
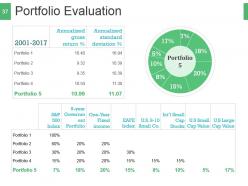
Slide 37: This slide states Portfolio Evaluation. Present data in a graphical form here.
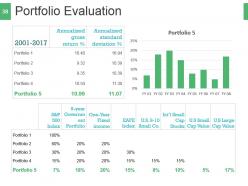
Slide 38: This is also Portfolio Evaluation slide. Present data in a graphical form here.
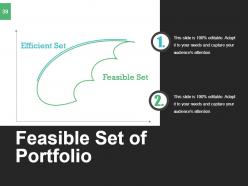
Slide 39: This slide showcases Feasible Set of Portfolio graph.
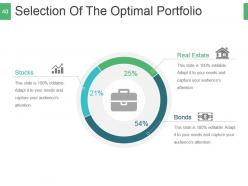
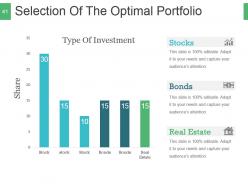
Slide 40: This is Selection Of The Optimal Portfolio slide showing- Stocks, Real Estate, Bonds.
Slide 41: This slide also presents Selection Of The Optimal Portfolio in a bar graph/ chart form.
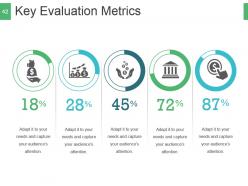
Slide 42: This slide states Key Evaluation Metrics with metric imagery.
Slide 43: This is Icons Slide. Use/ modify as per need.
Slide 44: This slide is titled Additional Slides to move forward. You can change the slide content as per need.
Slide 45: This is Mission & Vision slide to state your Mission, Vision and Goal.
Slide 46: This slide showcases Our Team with name and designation to fill.
Slide 47: This is an About Us slide showing Our Mission, Valued Clients, Premium Services and Preferred by many as examples.
Slide 48: This is Our Main Goals slide. State your important goals etc. here.
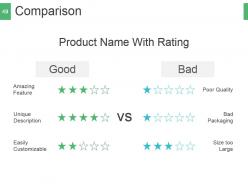
Slide 49: This is a Comparison slide to show product/ entity comparison etc.
Slide 50: This is a Financial score slide. State financial aspects etc. here.
Slide 51: This is a Quotes slide to convey messages, beliefs etc. You can change the slide content as per need.
Slide 52: This is a Dashboard slide to show growth factors in terms of High, Low, Medium.
Slide 53: This is a Location slide of world map image to show global presence, growth etc.
Slide 54: This is a Timeline slide to show evolution, growth, milestones etc.
Slide 55: This is a Coffee Time slide . Can be altered as per requirement.
Slide 56: This is a Post It slide to mark events, important information etc.
Slide 57: This slide presents a Newspaper image with text boxes to flash company news, position etc.
Slide 58: This is Puzzle Pieces slide to show information, specifications etc.
Slide 59: This is Target image slide to show information, specifications etc.
Slide 60: This is a Circular image slide to show information, specifications etc.
Slide 61: This is Venn diagram image slide to show information, specifications etc.
Slide 62: This is a Mind Map image slide to show information, specifications etc.
Slide 63: This is a Matrix slide ranging from High to Low.
Slide 64: This is a Lego blocks creative slide to present information, specifications etc.
Slide 65: This is creative Silhouettes image slide to present people specific information, specifications etc.
Slide 66: This is a Bulb & Idea image slide to show ideas, innovative information etc.
Slide 67: This is a Magnifying Glass image slide to show information, specifications etc.
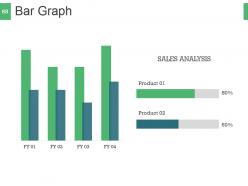
Slide 68: This is a Bar Graph slide to show product/ entity comparison, specifications etc.
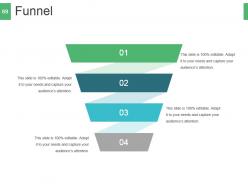
Slide 69: This is a Funnel image slide to show information, funneling aspects, specifications etc.
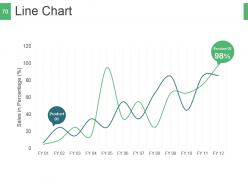
Slide 70: This slide presents a Line Chart for showcasing product/ company growth, comparison etc.
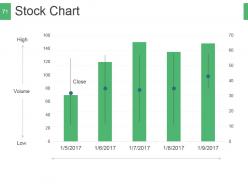
Slide 71: This is a Stock Chart slide to present product/ entity comparison, specifications etc.
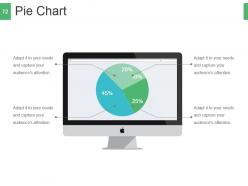
Slide 72: This is a Pie Chart slide to present product/ entity comparison, specifications etc.
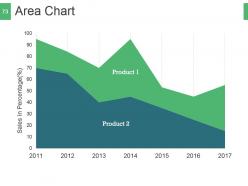
Slide 73: This is an Area Chart slide to present product/ entity comparison, information etc.
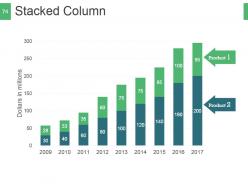
Slide 74: This is a Stacked Column graph slide to show product/ entity comparison, specifications etc.
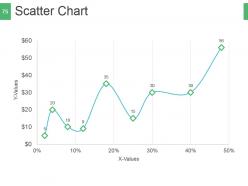
Slide 75: This is a Scatter Chart slide to present product/ entity comparison, specifications etc.
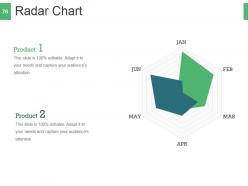
Slide 76: This is a Radar Chart slide to present product/ entity comparison, specifications etc.
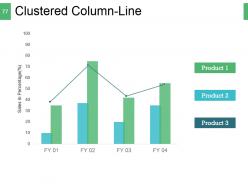
Slide 77: This is a Clustered Column - Line slide to present product/ entity comparison, specifications etc.
Slide 78: This is a Contact Us slide with Email, Address# street number, city, state, Contact Numbers.
Slide 79: This is a Thank You slide for acknowledgement.
Quantitative investment strategies and portfolio management powerpoint presentation slides with all 79 slides:
Brief journalists with our Quantitative Investment Strategies And Portfolio Management Powerpoint Presentation Slides. Insist on them adhering to facts.


FAQs for Quantitative investment strategies and portfolio management
Three things you can't mess around with: clean data, proper backtesting, and solid risk management. Your data needs to be spotless - none of that survivorship bias garbage that makes everything look rosier than reality. Test your strategy across different market conditions, not just the good times. I've watched so many "genius" strategies blow up because they only worked during bull runs. Position sizing and drawdown limits will save your butt when things go sideways (and they will). Oh, and keep it simple enough that you can actually explain why it should work beyond "the numbers looked good."
Look for stuff that actually repeats across different time periods and market conditions - real signals stick around while noise just bounces randomly. Backtest on out-of-sample data first. Honestly, I get sketched out when patterns look too perfect right away because that usually screams overfitting. Try cross-validation and walk-forward testing to see if it holds up. The real test? Change your parameters slightly or throw it at different assets. Does it still work or completely fall apart? Bootstrap sampling helps too. If tweaking small things breaks your signal, you're probably just chasing random market hiccups instead of actual alpha.
Machine learning is absolutely crushing it for finding patterns in trading strategies right now. Random forests and neural networks can spot those weird non-linear relationships that basic models totally miss. The amount of data you can process is insane - like, completely different from just a few years back. Here's the thing though: don't just dump algorithms everywhere and hope for the best. You still need actual market sense behind it. I'd honestly start with tweaking your current signals first, maybe some feature engineering stuff. Save the deep learning rabbit hole for later - trust me, you'll pick things up way faster that route.
Dude, backtesting is like your safety net before you blow up your account. Test your strategy against old market data to see where it would've crashed and burned - especially during those crazy volatile periods or market meltdowns. Honestly, it's the closest thing to time travel you'll get with trading. Try running it through different market conditions and timeframes to see if your edge is actually real. Don't forget about trading fees and slippage though (learned that one the hard way). Grab at least 5-10 years of data if you can swing it.
Biggest issue is overfitting to historical data - your model thinks it's genius but it's just memorizing the past. Don't forget transaction costs either, they'll eat profits fast. Past patterns won't repeat forever, and regime changes are brutal (remember the 2018 vol crush? Ouch). Data problems mess you up too, especially survivorship bias making your backtests look way too good. Market structure keeps evolving so what worked before might be dead now. I'd stress-test everything with fresh data and build risk controls early - saves headaches later.
Bad data will absolutely destroy your quant strategy - I've watched solid algorithms turn into money pits because of garbage inputs. You'll get false signals and models that backtest beautifully but crash hard when live. Survivorship bias alone can make strategies look way better than they actually are. Missing data is just as bad since you can't model what you don't have. Creates these blind spots that'll bite you later. My buddy learned this the expensive way last year - ouch. Quality data feeds cost more upfront but they're worth it. Way better than finding out your edge was actually a data error.
Look at the Sharpe ratio first - way more useful than raw returns since it factors in risk. Maximum drawdown tells you how brutal the worst periods were. Win rates sound cool but honestly they're overrated if you don't know the avg win/loss size. Check if it's actually diversified or just mimicking the S&P in disguise. Volatility matters too so you know what roller coaster you're getting on. Most importantly? Don't let them show you cherry-picked timeframes. Make sure you're seeing performance across different market cycles.
Honestly, start by looking at correlation matrices - they show you which assets don't move together. That's gold right there. Mean-variance optimization and risk parity models help figure out the actual weightings, though the math can get pretty intense. Modern portfolio theory does most of the heavy lifting for balancing returns vs risk. I'd also look into factor models that spread risk across things like value and momentum, not just different asset types. Oh, and definitely backtest whatever rules you come up with before going live. Map out correlations first, then build your strategy from there. Systematic rebalancing keeps everything on track.
Data privacy is the big one - don't grab personal info without asking. Your models can bake in all sorts of bias from training data, which honestly happens more than people admit. Test for that stuff regularly. Market manipulation is another headache if your algo moves prices weird. Regulators are watching this space way closer now too. Document where your data comes from and have clear policies around how you use it. Oh, and transparency matters - you'll want to explain how your models actually work. Basically just don't be shady about any of it.
Macro indicators are your bread and butter data - GDP growth, inflation, employment stats, interest rates. Most quant models use these to predict market moves or figure out which sectors to bet on. Some funds build whole factor models around different macro environments, like high vol versus low vol periods. Here's the thing though - markets usually price this stuff in way before the actual data drops. So you've gotta be clever about timing and understanding those lead/lag relationships. Honestly, I'd backtest how your models handle different macro cycles first. That'll show you which indicators actually matter versus which ones are just adding noise to your system.
Honestly, HFT is brutal. Latency kills you - microseconds matter and co-location fees are insane, like hundreds of thousands per year. All that market noise at ultra-high frequencies will mess with your models too. Regulatory stuff is a total headache across different exchanges. Your edge disappears fast since everyone's hunting the same opportunities. I actually think you should mess around with mid-frequency first - way less infrastructure headache and you can figure out your risk management without burning through cash. The HFT game is just so capital intensive from day one.
So basically start by picking alt data that actually makes sense for what you're predicting - satellite pics for foot traffic, social sentiment for earnings, that kind of thing. The hard part is cleaning all that messy data into something your models can digest. Don't go overboard at first, just try one or two sources. Pick stuff that updates regularly and has solid economic logic behind it. Oh and backtest the hell out of it because alt data can be super noisy and costs a fortune. You'll want proof it's adding real value before you dump serious cash into it.
Look, algorithmic trading is pretty much how everything works in quant finance now. You literally can't compete without it - opportunities disappear in milliseconds while you're still thinking about placing a trade. The whole point is removing your emotions from decisions and letting math do the work instead. These algorithms can handle tons of data across different markets simultaneously, running strategies 24/7 that would be impossible to execute manually. Honestly, if you're getting into this space, you need to learn Python and understand execution algorithms. There's really no way around it anymore - manual trading just doesn't cut it at scale.
Market anomalies are where you'll find your bread and butter for quant strategies. Think momentum, mean reversion, seasonal patterns - stuff that shouldn't exist if markets were truly efficient but does anyway. Take momentum anomalies - they spawned all those trend-following algos that everyone's still running (though honestly, returns aren't what they used to be). Your goal is spotting these inefficiencies before they disappear. Why do they happen? Sometimes it's behavioral biases, sometimes structural issues. Start with the classics that are well-documented, then hunt for similar patterns in other markets or timeframes you haven't explored yet.
AI stuff is getting insane - they're pulling sentiment from Twitter in real-time now, using satellite pics to predict markets. ESG data is everywhere too, algorithms actually care about sustainability scores alongside the usual metrics. Retail traders are finally getting tools that were hedge fund exclusive, which honestly feels overdue. Credit card transactions, weather data, you name it - everything's fair game for analysis now. Oh and retail quant tools are becoming super accessible. Follow some fintech newsletters or hit up a conference if you can swing it.
-
Best way of representation of the topic.
-
Innovative and Colorful designs.