

Quantitative Research Method Powerpoint Ppt Template Bundles




Try Before you Buy Download Free Sample Product
 Impress Your
 Audience
 100%
100% Editable
 Save Hours
 of Time


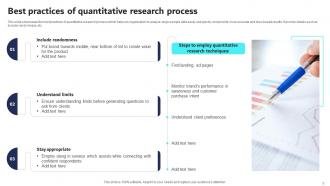
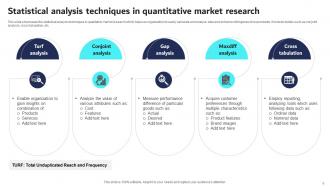
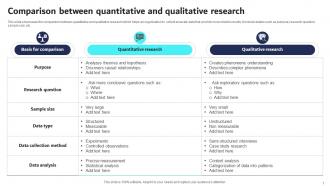
Introducing our comprehensive PowerPoint presentation PPT on Quantitative Research Quantitative Research Method. Dive into the world of data driven decision making with this meticulously crafted resource. Our PPT elucidates the distinction between qualitative and quantitative research, offering a clear understanding of their divergent methodologies. Discover the intricacies of quantitative research design, exploring its various phases and strategies for robust data collection and analysis. Delve into a diverse array of quantitative research methods, from surveys and experiments to content analysis, all backed by the latest insights and best practices. Uncover the rich tapestry of types of quantitative research, including descriptive, correlational, and experimental research designs, among others. Equip yourself with the knowledge and tools necessary to conduct rigorous quantitative research projects. Elevate your research acumen with this indispensable presentation that empowers you to make informed, data driven decisions.
People who downloaded this PowerPoint presentation also viewed the following :
Quantitative Research Method Powerpoint Ppt Template Bundles with all 18 slides:
Use our Quantitative Research Method Powerpoint Ppt Template Bundles to effectively help you save your valuable time. They are readymade to fit into any presentation structure.










FAQs for Quantitative Research Method Powerpoint
So basically quantitative research is all about the numbers - stuff you can actually count and measure. You're doing surveys, experiments, collecting tons of data from big groups of people. Then you run statistics on it to test your theories or find patterns. It's pretty much the opposite of qualitative research where you'd sit down and interview people for hours (which honestly sounds exhausting). The whole point is being objective and replicable. Like, another researcher should be able to do your exact study and get similar results. Start by figuring out what variables you want to measure and how you'll collect everything systematically.
Okay so first thing - pilot test everything because you'll catch issues early. Your sample size doesn't have to be massive, just adequate for whatever analysis you're planning. Use validated instruments if they exist (saves you so much headache honestly). Keep your procedures consistent throughout and document like crazy so someone else could replicate it. Double-check data entry - seriously, one stupid typo ruins everything. For validity, make sure you're actually measuring what you think you are through content validation. Test-retest reliability or Cronbach's alpha work great for checking consistency. Oh and construct validation too if you're developing new measures.
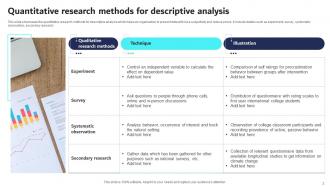
So there are basically three main types: experimental, quasi-experimental, and non-experimental. With experimental, you're actually manipulating variables and doing random assignment - gives you the most control. Quasi-experimental is pretty similar but you can't randomly assign people, so you're comparing existing groups instead. Non-experimental is just observing and measuring stuff without changing anything - surveys, correlational studies, whatever. Most research I come across is actually this third type since true experiments can be a pain to set up ethically. Really depends on what you're trying to figure out and how much control you need.
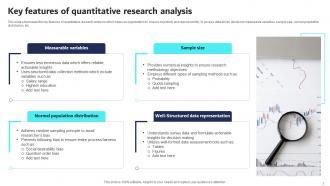
Look, sampling can totally make or break your research. Get a bad sample and your data's basically useless - it won't represent your actual population at all. Size matters here too. Too small? No statistical power. Too big? You're just burning money for no reason. Random sampling helps cut down bias, though honestly, true randomness is way harder than it sounds in real life. I always tell people to be upfront about sampling limitations when presenting results. Document everything so others can judge if your conclusions actually make sense. Trust me, reviewers will pick apart weak sampling faster than anything else.
Honestly, it depends what you're trying to analyze, but I always recommend SPSS and R. SPSS is great if coding isn't your thing - super straightforward interface. R's more flexible though, and free which is clutch when you're broke lol. Excel works fine for basic stuff like means and correlations, but anything complex? You'll want the real deal. Regression, factor analysis - that's where SPSS and R shine. I'd probably start with SPSS first since it's easier to wrap your head around, then move to R later when you want more control.
So you'd start by figuring out what your abstract concept actually looks like in real life - like breaking "job satisfaction" into things you can actually measure. Retention rates, survey scores, specific behaviors. The hard part is making sure your proxies actually capture what you're studying (honestly, this trips people up all the time). Most researchers use established scales or create coding schemes that turn observations into numbers. You've got to be really clear about your process though, so other people can do the same thing. Otherwise you're just making stuff up.
Your hypothesis is basically your educated guess about what'll happen - but way more scientific than actual guessing, obviously. Write it before you collect any data and make sure it clearly states what relationship you expect between variables. It's like your research GPS, keeping you focused instead of just wandering around your dataset hoping something interesting pops up (which honestly happens more than researchers like to admit). Without one, you're basically doing bad science. Plus it helps you pick the right statistical tests later on.
Honestly, it's all about knowing your crowd. Executives want the big picture - clean charts, no jargon, just tell them what matters. Academics? They're gonna want all the methodology details and statistical stuff. For regular people, turn your data into stories they actually care about. I've watched so many smart people completely bomb presentations because they jumped straight into technical details. Big mistake! Always start with why it matters, then explain how you got there. Dashboards work great when people want to dig around themselves. Infographics are perfect for quick hits. And yeah, throw detailed appendices at the end for data nerds. Just ask yourself: what do they need to decide?
Honestly, the biggest issue is you'll get all these numbers but zero clue about the "why" behind them. Your survey might show 70% of people do X, but you won't know their actual motivations. Plus everything gets shoved into these preset categories which - let's be real - rarely captures how messy human behavior actually is. Oh and if something interesting pops up mid-study? Too bad, you can't really pivot like you would with interviews. Bias creeps in through your questions too, sometimes without you noticing. Quantitative's great for proving stuff at scale, but pair it with some qualitative work if you want the full picture.
Look, ethics isn't just some box to check - you gotta bake it into your whole research plan from day one. Think about consent forms, how you're protecting people's info, making sure you're not taking advantage of anyone vulnerable. The IRB will review everything anyway, but trust me, it's so much less painful if you consider this stuff early instead of scrambling to fix things later. Even your data collection method gets affected - like whether you go anonymous or not, how long your survey is. Oh, and definitely check your school's ethics guidelines before you lock anything down. Saves headaches.
Honestly, tech makes quantitative research so much easier. Online platforms like Qualtrics let you survey way more people without the headache of paper forms. Statistical software (R, SPSS) does all those crazy calculations - trust me, you don't want to do that math manually. Data viz tools are great for spotting trends and making charts that actually look professional. Oh, and cloud storage means your whole team can access everything from anywhere, which is clutch. I'd say pick one tool that fixes your biggest problem first, then build from there. Don't try to learn everything at once or you'll go insane.
Look, whatever tools you use to measure stuff literally becomes your entire view of the data. Bad instruments = garbage results that don't mean anything in the real world. It's honestly like using a warped ruler and expecting accurate measurements. Even tiny tweaks to survey wording or how you set up equipment can completely change what you find out. I learned this the hard way in my stats class actually. Test everything first! Check if your instruments actually work properly before you start collecting all that data.
So for minimizing bias - randomization is huge, honestly your best bet. Random sampling, random assignment, all that. Also blind your data collectors if you can so they're not unconsciously pushing results one way. Oh and standardize literally everything - data collection, analysis protocols, the works. I'd probably use validated instruments too instead of making your own (saves headaches later). Map out where bias could sneak into your design first. Then build walls around those spots. Removing human judgment wherever possible is the name of the game here.
Good researchers use random sampling from different groups - not just whoever's easiest to find. Sample size matters, but bigger doesn't always mean better. It just needs to be right for what they're studying. A lot of studies get replicated across different populations to see if the results actually hold up (which honestly makes me trust them way more). When you're reading research, definitely check the limitations section - that's where authors admit who their findings don't apply to. It's usually pretty telling.
Numbers speak louder than stories when it comes to policy work. Policymakers trust hard data because they can actually defend their decisions with it. Your stats help spot trends, show if programs work, and predict what might happen next - super valuable for government folks. Honestly, it's way harder for people to argue with solid research than random examples. Plus your findings can shape where money goes and how programs get designed. Quick tip though - don't just dump spreadsheets on them. Make it digestible with clear takeaways.
-
“As you have innovative ideas and they are all customizable, this saves a huge chunk of your time to prepare well-read presentations.”
-
Thank you for showering me with discounts every time I was reluctant to make the purchase.