


Quarterly business performance sample of ppt


Try Before you Buy Download Free Sample Product
 Impress Your
 Audience
Editable
of Time


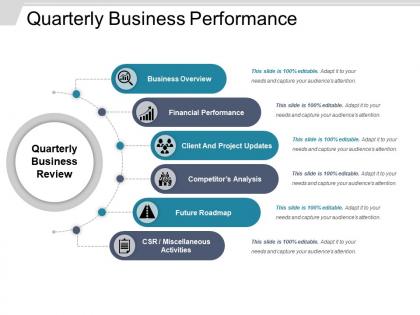
Here is our professionally created quarterly business performance sample of PPT. From the CEO to staff members, this PPT template is versatile enough to be useful for all the phases of business management and performance analysis. PPT acts as an essential guide to quarterly business reviews. Demonstrate and communicate quarterly business performance to alert your managers about the potential opportunities and problems coming in the business. With the help of this quarterly business review presentation slide, you can keep a track of business performance against previously set strategic goals and initiatives and provide future opportunities for real-time analysis and adjustment. Our professional business review presentation template gives you everything that you need to set up for a professional and detailed presentation on business strategies and plans. Communicate business performance directly, whether it is data, sales, HR, risk management or communications. PPT template is highly useful for business review meetings. So, download this business performance presentation template and track your goals and measure results in a clear format. Get across all hurdles that emerge with our Quarterly Business Performance Sample Of Ppt. They allow you to make good headway.
People who downloaded this PowerPoint presentation also viewed the following :
Quarterly business performance sample of ppt with all 5 slides:
Give delinquents a better chance with our Quarterly Business Performance Sample Of Ppt. Enhance their ability to amend their habits.


FAQs for Quarterly business performance
Start with the big three: revenue growth, profit margins, and cash flow. Those tell you if you're actually healthy financially. Customer acquisition cost vs lifetime value is critical too, especially when you're trying to scale up. Employee turnover and customer satisfaction scores matter way more than people think - seriously, I see companies ignore these all the time. Conversion rates and market share help you understand where you stand against competitors. But here's the thing - stick to maybe 5-7 KPIs max. I've watched teams get completely overwhelmed tracking every possible metric. Pick ones that'll actually change how you make decisions, not just ones that look impressive in meetings.
Compare your quarterly numbers to the same quarters from past years - that's what most people screw up. Don't just look at Q3 vs Q2, look at this Q3 vs last year's Q3. Pull like 3-5 years of data if you have it and map it out visually (trust me on this one). Different product lines might have totally different patterns too, so break those out separately. Also track stuff that happens before the revenue hit - website traffic, pipeline changes, whatever gives you a heads up. Retail's obvious with the Q4 holiday bump, but your industry probably has its own weird cycles.
Honestly, your quarterly numbers are tied way more to engagement than most people realize. Engaged employees hit their targets and actually solve problems instead of just showing up. They don't bail mid-quarter either – and you know how brutal hiring costs get when you're trying to close strong. Disengaged teams? Total revenue killers. They miss deadlines, half-ass client work, and create this domino effect that hits your bottom line hard. I'd start watching engagement metrics like you do financial ones. Spotting those trends early can save your quarter before things go sideways.
Honestly, data analytics completely changes how you do quarterly reports. Raw numbers just tell you what happened - analytics shows you *why* and what's probably coming next. Teams get obsessed with making pretty dashboards (guilty of this myself) but miss the actual story. Focus on metrics that actually move the needle and set up alerts for the important stuff. Predictive models help you forecast next quarter's performance, plus cohort analysis breaks down how customer behavior shifts over time. Don't try to do everything at once though - pick one key metric and build from there.
Lead with the big stuff - revenue, growth, major wins right off the bat. People zone out fast, so keep slides clean with minimal text. Honestly, two colors max or it looks like a rainbow threw up. Your charts need to actually tell a story, not just dump numbers everywhere. Oh, and definitely add context for any weird spikes or dips so nobody's sitting there confused. I learned that one the hard way last quarter when everyone kept asking about our July numbers. Wrap up each section with what's next - makes you look like you've got your act together.
Okay so first - you gotta actually dig into what went wrong, not just stare at the bad numbers. Is it an ops thing? Market stuff? Not enough people/resources? I swear, most teams I've worked with just start pointing fingers instead of doing the real detective work. Once you figure out the actual problems, build specific action plans with clear owners and deadlines. Oh and track the stuff that predicts problems, not just the aftermath - that way you can fix things faster next time. Bottom line: be honest about what's broken, then actually do something about it.
Start with the big three: revenue growth, profit margins, and cash flow. Cash flow's honestly my favorite because who cares about revenue if you can't collect it, right? Then check your operating expenses as a percentage of revenue - shows if you're getting more efficient over time. Customer acquisition costs matter too if that's how your business works. Oh, and I'd probably track whatever weird industry-specific stuff applies to you. But yeah, nail those basics first before getting fancy with other metrics.
Look at your last 6-8 quarters first. Find the patterns - growth rates, seasonal stuff, what metrics actually mattered. Don't just focus on revenue either. Check leading indicators like pipeline health or customer acquisition costs. Here's what kills me - so many teams look at their best quarter ever and think "let's do that again!" That's just asking for disappointment. Use your median performance instead. Way more realistic. Factor in what resources you actually have and current market conditions. Then set stretch targets that'll push people but won't make them want to quit. You want challenging, not impossible.
Honestly, ditch the whole departments-working-separately thing and get cross-functional teams doing assessments together. Set up KPIs that actually force people to collaborate - can't hit the numbers unless everyone's working as a team. Don't wait until quarter-end when everyone's panicking; do regular check-ins throughout. One thing that's worked really well is having a rotating "collaboration champion" from each dept who basically owns keeping everyone connected. Shared dashboards are clutch so people can see what's happening in real time. Oh, and definitely do a pre-quarter session where all the departments map out how they depend on each other - sounds boring but it's actually super helpful.
Start collecting feedback way before your quarterly deadline - like 2-3 weeks early. Honestly, surveys and one-on-ones work way better than trying to chase people down last minute. Ask specific stuff tied to your actual goals, not the usual "how's everything going" questions that tell you nothing. I learned this the hard way after a few disaster quarters where I was scrambling. Make it part of your regular routine instead of something you remember at 11pm before the report's due. Then actually show in your quarterly report how you're dealing with what people told you. Sounds obvious but most people skip that part.
So market analysis is basically your cheat sheet for figuring out what's actually going on before you adjust your quarterly plans. You'll catch trends early, see where competitors are making moves, and find new customer groups. Honestly, it beats guessing what'll work next quarter. Monthly reviews work pretty well - gives you enough data to reallocate budget, tweak pricing, or just scrap stuff that isn't working. Without it, you're kinda shooting in the dark when quarterly planning rolls around again.
Yeah, competitor stuff can totally mess with your quarterly numbers. Like if a big player drops prices or launches something huge, your revenue might tank even if you're doing everything right. But sometimes they screw up - supply issues, bad PR, whatever - and suddenly you look amazing. Honestly, the hardest part is explaining to investors what's actually your success versus just lucky timing. I'd definitely call out any major competitive moves in your quarterly review. Shows you're not clueless about what's happening around you. Plus stakeholders always want to know what growth is "real" anyway.
Look, the main problem is historical data basically assumes tomorrow looks like yesterday - and that's just not how business works. You'll completely miss new competitors or when customers suddenly change what they want. Honestly, I've seen too many companies get burned because their models fell apart the second something unexpected happened. Economic shifts, new regulations, supply issues - none of that shows up in last year's numbers. Start with historical data as your foundation, sure. But then add some forward-thinking analysis and "what if" scenarios. Trust me, you'll get way more realistic projections that way.
Honestly, skip all the finance-speak and just tell a story with visuals. Did you hit your targets? Why or why not? That's your starting point. Each group wants different things - marketing cares about customer numbers, operations wants efficiency stuff, HR focuses on headcount. Those dense spreadsheets make everyone's eyes glaze over, trust me. Simple charts work way better. Pick 2-3 wins and maybe 1-2 problems with actual solutions. The whole thing should feel like you're having a conversation, not reading from a textbook. Way more engaging that way.
Stop just throwing charts at people and actually tell a story with your data - like what went wrong, what surprised you, the wins. Those interactive dashboards where people can click around and explore? Super effective. My old team tried this "performance theater" thing where departments acted out their quarterly wins. Sounds ridiculous, I know, but everyone was actually into it. Short videos work better than endless slide decks too. Make people participate instead of just sitting there zoning out. Pick whatever feels right for your team's vibe and try it next quarter.
-
Qualitative and comprehensive slides.
-
Great designs, really helpful.