

Apresentação em PowerPoint de análise trimestral de desempenho de vendas com slides





Try Before you Buy Download Free Sample Product
 Impress Your
Audience
 100%
Editable
 Save Hours
of Time


Para deixar uma impressão duradoura com sua apresentação em PowerPoint de análise trimestral de desempenho de vendas, é claro que você precisa de um bom exemplo de PPT. Levando isso em consideração aqui, criamos um arquivo de amostra PPT pronto para ajudá-lo a olhar para trás e fazer o gerenciamento de desempenho, revisão de desempenho ou avaliação de desempenho para sucesso futuro. Indo além, usando nosso deck de apresentação de marketing qbr, você pode definir o tom de uma reunião de vendas para discutir os planos do próximo trimestre, a fim de garantir o cumprimento eficiente das metas de negócios. A melhor parte aqui é que você pode aplicar nossa apresentação de slides do PowerPoint para o seu desenvolvimento organizacional, retratando várias relações de dados de vendas e métodos para reduzir os custos operacionais. Ainda não terminados, nossos designs de modelos criativos, como resumo de pipeline trimestral, ciclo de vendas, histórico trimestral, resumo de vendas semanal / trimestral, etc., são úteis para abordar todos os conceitos significativos ligados a uma reunião de revisão operacional. A conclusão aqui é que, se você deseja que tudo esteja certo em sua próxima apresentação de slides de PPT de avaliação de desempenho trimestral, você não deve olhar além desta amostra exclusiva de PPT. Investigue todas as pistas com nossa Análise trimestral de desempenho de vendas. Apresentação completa em PowerPoint com slides. Estabeleça a interação dos eventos.
People who downloaded this PowerPoint presentation also viewed the following :
Conteúdo desta apresentação em PowerPoint
Slide 1 : Este slide apresenta a Avaliação Trimestral do Desempenho de Vendas. Informe o nome da sua empresa e continue.
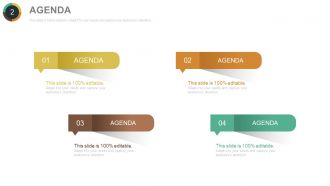
Slide 2 : Este slide mostra a Agenda da sua empresa. Adicione aqui.
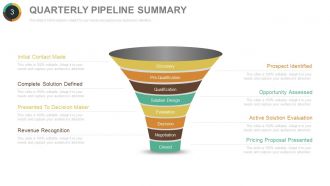
Slide 3 : Este slide apresenta o Resumo Trimestral do Pipeline com as seguintes etapas - Descoberta, Pré-qualificação, Qualificação, Desenho da Solução, Avaliação, Decisão, Negociação, Fechado. Ele também mostra as seguintes etapas - Identificação do cliente potencial, Oportunidade avaliada, Avaliação da solução ativa, Proposta de preço apresentada, Contato inicial feito, Solução completa definida, Apresentado ao tomador de decisões, Reconhecimento de receita.
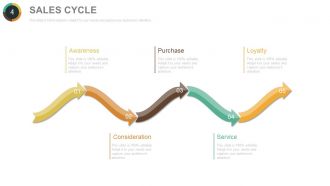
Slide 4 : Este slide apresenta o Ciclo de Vendas em um diagrama de fluxo com as seguintes etapas - Conscientização, Consideração, Compra, Serviço, Fidelidade.
Slide 5 : Este slide mostra o Resumo de Vendas Semanal / Trimestral com Vendas Totais.
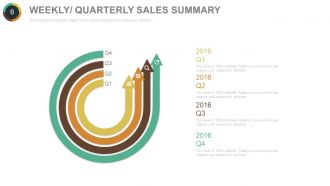
Slide 6 : Este slide também mostra o Resumo de Vendas Semanal / Trimestral.
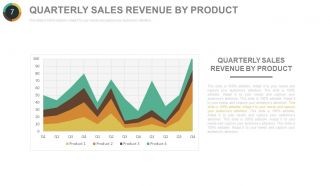
Slide 7 : Este slide exibe a receita de vendas trimestral por produto graficamente.
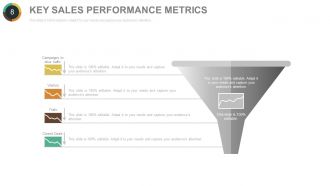
Slide 8 : Este slide mostra uma imagem de funil informando as principais métricas de desempenho de vendas. Essas métricas incluem: testes, negócios fechados, visitantes, campanhas para direcionar o tráfego.
Slide 9 : Este slide apresenta o Quarter Track Record em tabelas e gráficos.
Slide 10 : Este slide mostra a Linha do Tempo da Oportunidade. Você pode adicionar os dados relevantes, como marcos, jornada, etc., nesta linha do tempo e fazer uso deles.
Slide 11 : Este slide mostra a matriz de pontuação de oportunidade. Fornecemos algumas caixas de texto para você inserir dados relevantes.
Slide 12 : Este slide também mostra a matriz de Pontuação de Oportunidade com os quatro pontos a seguir - Qualificar (Desenvolvimento de Vendas), Passar para Vendas, Sucata, Nutrir (Marketing).
Slide 13 : Este slide apresenta a Análise de Pipeline do Produto com caixas de texto para preencher.
Slide 14 : Este slide mostra as ofertas do próximo trimestre.
Slide 15 : Este é o slide A Voz do Cliente para expor os problemas, as opiniões dos clientes, etc.
Slide 16 : Este slide apresenta a análise de ganho-perda em porcentagem, etc.
Slide 17 : Este slide mostra o gráfico de Qualidade do Pipeline com dois aspectos - Estágio de Vendas no eixo xe Idade da Oportunidade exibida no eixo y.
Slide 18 : Este slide apresenta a Qualidade do Pipeline em uma forma de matriz com - Qualificar (Desenvolvimento de Vendas), Passar para Vendas, Sucata, Nutrir (Marketing).
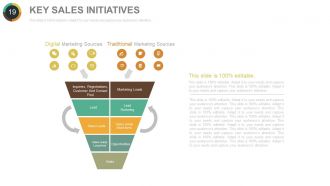
Slide 19 : Este slide mostra as principais iniciativas de vendas em um formato de imagem de funil.
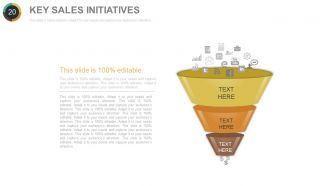
Slide 20 : Este slide também mostra as principais iniciativas de vendas em um formato de imagem de funil.
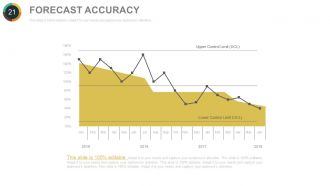
Slide 21 : Este slide apresenta o gráfico de Precisão da Previsão indicando o Limite de Controle Superior (UCL), Limite de Controle Inferior (UCL).
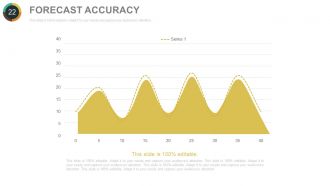
Slide 22 : Este slide também mostra o gráfico de precisão da previsão.
Slide 23 : Este slide apresenta a carteira do trimestre atual em um gráfico de pizza. Ele também mostra vários ícones e caixas de texto para preencher.
Slide 24 : Este slide apresenta o gráfico da carteira do trimestre atual.
Slide 25 : Este é o slide da matriz do Scorecard de Desempenho do Representante de Vendas, mostrando o Desempenho Geral do Território.
Slide 26 : Este slide mostra o Sales Rep KPI Tracker.
Slide 27 : Este é o canal KPIS mostrando um slide - POS estacionário, POS online, POS móvel, Catálogo / revista, Call Center, monitores instantâneos, inspiração, avaliação, compra, pós-venda.
Slide 28 : Este slide também mostra os KPIS do Canal com base na densidade de vendas (€ por m²), custo de pessoal (€ por m²), custo imobiliário (€ por m²), giro de estoque.
Slide 29 : Este slide mostra as vendas de parceiros com imagens na nuvem. Ele também mostra- Literatura de Marketing, Ferramentas de Vendas, Incentivos de Canal, Promoções de Produtos, Registro de Ofertas, Notícias e Eventos.
Slide 30 : Este slide mostra o recorde de 4 quartos em tabelas e gráficos.
Slide 31 : Este slide também mostra o gráfico 4 Quarter Track Record.
Slide 32 : Este é o slide do Partner Score Card mostrando o Talent Scorecard.
Slide 33 : Este slide apresenta a Análise Competitiva.
Slide 34 : Este slide também apresenta a Análise Competitiva de forma gráfica.
Slide 35 : Este slide apresenta a Revisão da Previsão do Funil. Você pode adicionar texto conforme sua necessidade.
Slide 36 : Este slide também mostra a Revisão da Previsão do Funil.
Slide 37 : Este slide mostra a análise de oportunidade crítica.
Slide 38 : Este é o slide Mapa do processo de vendas em silhuetas de pessoas e imagens de funil para acompanhar.
Slide 39 : Este slide também mostra o Mapa do processo de vendas em um formato de funil com caixas de texto. Você pode adicionar informações de acordo com sua necessidade.
Slide 40 : Este slide apresenta o modelo de geração de leads com imagens de funil e caixas de texto.
Slide 41 : Este slide mostra as vendas trimestrais projetadas. Use este slide para mostrar suas próprias vendas trimestrais.
Slide 42 : Este slide também mostra as vendas trimestrais projetadas com imagens de ícones e caixas de texto.
Slide 43 : Este slide mostra o Guia do Processo de Planejamento de Vendas e Operações. Fornecemos algumas caixas de texto para você adicionar informações relevantes.
Slide 44 : Este slide mostra o gráfico de barras Meta e Conquista da Equipe de Vendas. Apresente seus próprios dados em um formato gráfico.
Slide 45 : Este é o slide Desempenho de vendas versus meta com imagens métricas. Você pode adicionar seu próprio desempenho de vendas e estatísticas de destino neste slide e comparar os dois de acordo.
Slide 46 : Este slide é intitulado Slides adicionais para avançar. Você pode alterar o conteúdo conforme a necessidade.
Slide 47 : Este slide mostra Nossa Equipe com nome, designação, etc. para preencher.
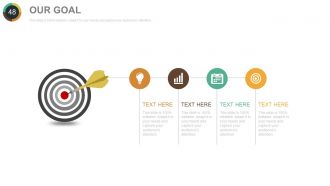
Slide 48 : Este é o slide Nosso Objetivo com imagens de alvos e flechas. Use-o para definir seus objetivos.
Slide 49 : Este slide mostra a comparação de duas entidades - Masculino e Feminino.
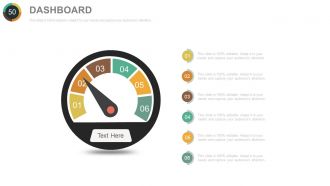
Slide 50 : Este é o slide do painel para mostrar métricas, KPIs etc.
Slide 51 : Este é um slide de Localização para mostrar o crescimento global, presença, etc. em uma imagem de mapa mundial.
Slide 52 : Este é um slide da linha do tempo para apresentar datas importantes, jornada, evolução, marcos etc.
Slide 53 : Este é o slide de imagem Alvo com seta. Use-o para indicar suas metas, objetivos, etc.
Slide 54 : Este é um slide de imagem do diagrama de Venn para mostrar informações, especificações, etc.
Slide 55 : Este é um slide do Mapa Mental para mostrar segmentação comportamental, informações ou qualquer coisa relativa.
Slide 56 : Este é um slide MATRIX com parâmetros High e Low.
Slide 57 : Este é um slide de Bulbo ou Ideia para apresentar uma nova ideia ou destacar especificações / informações, etc.
Slide 58 : Este slide mostra uma imagem da lupa com caixas de texto.
Slide 59 : Este slide mostra um gráfico de barras criativo para mostrar a comparação de produtos, crescimento, etc.
Slide 60 : Este é um slide de agradecimento pelo agradecimento ou pelo encerramento da apresentação.
Análise trimestral de desempenho de vendas Apresentação em PowerPoint com slides com todos os 60 slides:
A imagem final gerada por nossa Análise Trimestral de Desempenho de Vendas Completa PowerPoint com Slides é impressionante. Ele garante a gelificação de todos os elementos.
-
Quarterly Sales Performance Review
-
Agenda Slide
-
Quarterly Pipeline Summary
-
Sales Cycle
-

Weekly Quarterly Sales Summary
-
Weekly Quarterly Sales Summary
-
Quarterly Sales Revenue by Product
-
Key Sales Performance Metrics
-
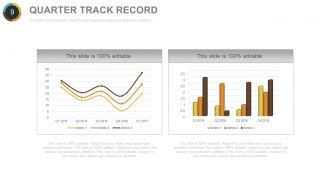
Quarter Track Record
-
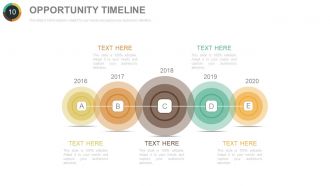
Opportunity Timeline
-

Opportunity Score
-
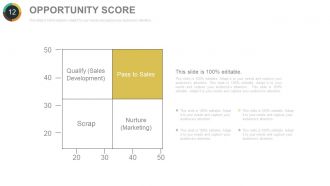
Opportunity Score
-
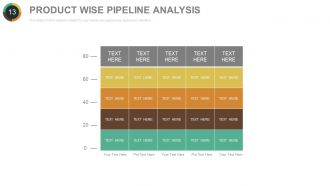
PRODUCT WISE PIPELINE ANALYSIS
-
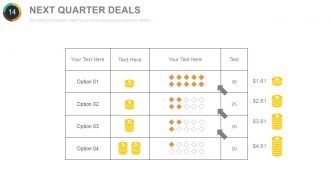
Next Quarter Deals
-
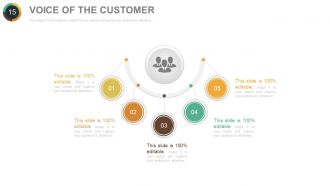
Voice of the Customer
-

WIN LOSS REVIEW
-
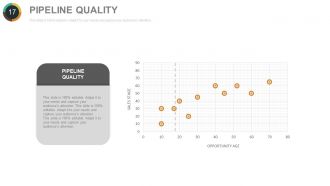
Pipeline Quality
-
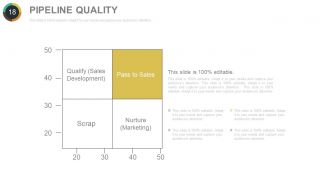
Pipeline Quality
-
Key Sales Initiatives
-
Key Sales Initiatives
-
Forecast Accuracy
-
Forecast Accuracy
-
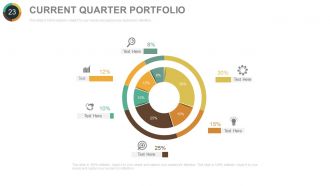
Current Quarter Portfolio
-
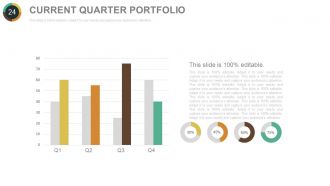
Current Quarter Portfolio
-
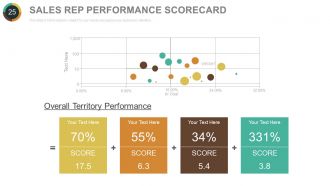
Sales Rep Performance Scorecard
-
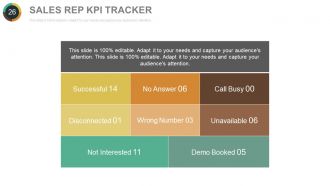
Sales Rep KPI Tracker
-
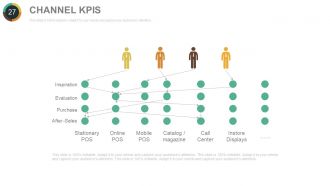
CHANNEL KPIs
-
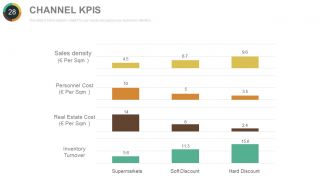
CHANNEL KPIs
-
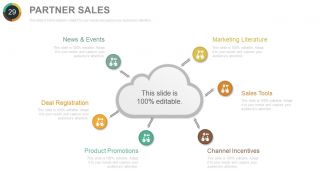
Partner Sales
-
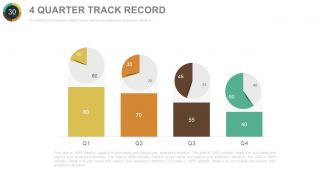
4 Quarter Track Record
-
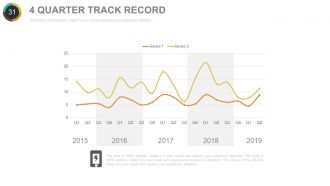
Four Quarter Track Record
-
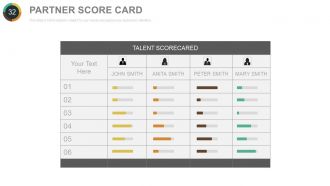
Partner Score Card
-
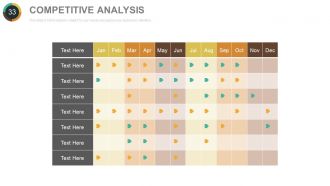
Competitive Analysis
-
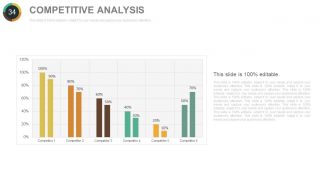
Competitive Analysis
-
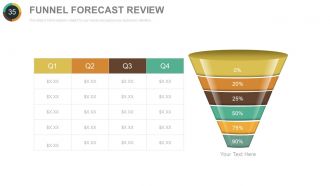
Funnel Forecast Review
-
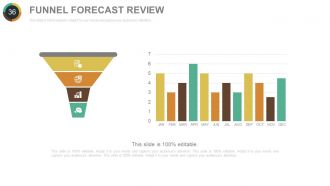
Funnel Forecast Review
-
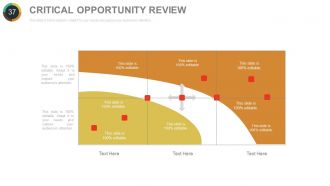
Critical Opportunity Review
-
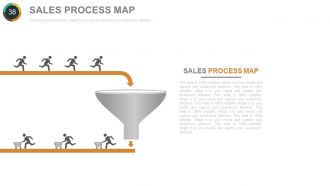
Sales Process Map
-
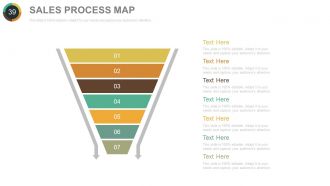
Sales Process Map
-
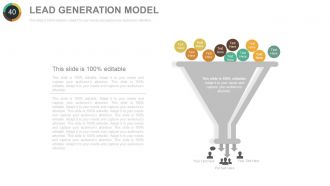
Lead Generation Model
-

PROJECTED QUARTERLY SALES
-
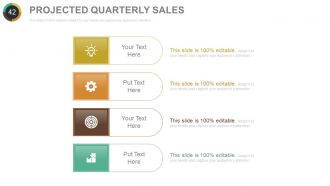
Projected Quarterly Sales
-
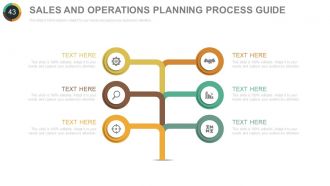
Sales and Operations Planning Process Guide
-
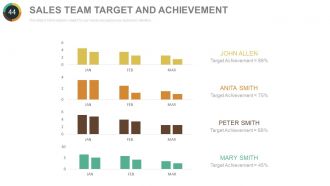
Sales Team Target and Achievement
-

Sales Performance Versus Target
-
Additional Slides
-

OUR TEAM
-
OUR GOAL
-

Comparison
-
Dashboard
-
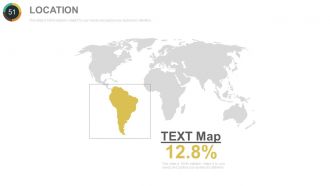
LOCATION
-
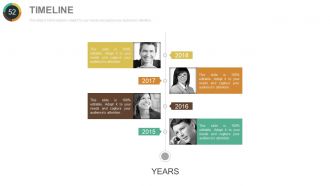
Timeline
-

Target with Arrow
-
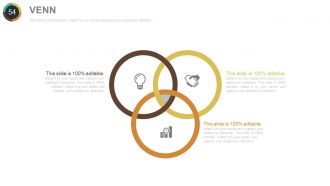
Venn Diagram
-
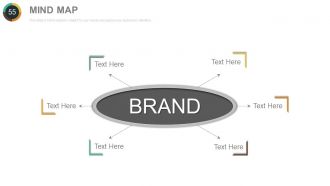
Mind Map
-
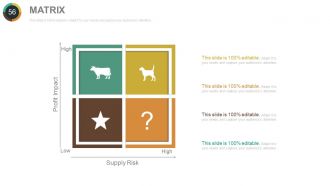
Matrix
-
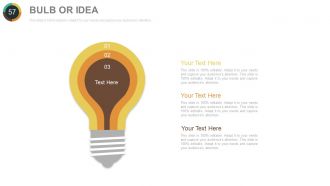
BULB OR IDEA
-

Magnifier Glass
-
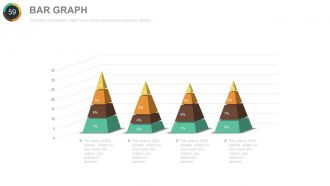
Bar Graph
-
Thank You
FAQs for Quarterly sales performance review powerpoint
Revenue growth is the obvious one, but conversion rates and deal size matter way more than people think. Sales cycle length too. I got burned last quarter - our numbers looked amazing but we were hemorrhaging cash on customer acquisition costs vs what they were actually worth long-term. Pipeline velocity is clutch for forecasting. Break down win/loss ratios by territory and rep so you can see who's actually performing. Monthly pulls are better than waiting until quarter-end when it's too late to fix anything. Oh, and retention metrics if you've got recurring revenue.
Yeah seasonality messes with everything - retail goes crazy in Q4 obviously, but B2B usually tanks in summer when everyone's at the beach. Compare year-over-year instead of quarter to quarter. That's way more useful. Plot your last 3 years and you'll see the patterns jump out. Don't freak when Q3 looks terrible compared to Q2 - some industries just work that way. I learned this the hard way when I panicked over a summer dip that turned out to be totally normal. Use those historical trends to set realistic forecasts so you're not constantly surprised by predictable swings.
Honestly, I'd go with something like Salesforce or HubSpot since they're basically made for tracking deals and spitting out quarterly reports automatically. Way better than wrestling with Excel spreadsheets every three months (learned that the hard way lol). If you need fancier charts and stuff, Tableau or Power BI work great. Google Sheets can actually handle simpler setups pretty well too - just need some basic formulas. The main thing is making sure whatever you pick connects with wherever your sales data currently lives. Otherwise you'll be stuck manually entering everything twice, which is honestly the worst.
Honestly, pull up your last 8-12 quarters first. What's the actual trend - 5% growth each quarter? 10%? Seasonal ups and downs? Don't just average everything out because you'll totally lowball yourself if there's real momentum happening. We did that once and it was embarrassing how easy our targets were. Think about what's changing too - new hires, product launches, whatever. I'd probably add 10-15% on top of your trend line for stretch. You want it tough enough that people care but not so crazy they just check out, you know?
Start with your pipeline - what deals are stuck and why? Look at this quarter's wins vs losses to see what actually moved the needle. Most reps honestly just cross their fingers and hope things improve without doing this homework. Stop chasing garbage leads. Qualify harder upfront instead of wasting time on prospects who'll never buy. Get regular coaching sessions to practice objection handling, and use those customer success stories as proof points. Oh, and don't wait until next quarter starts - implement this stuff now while you've got time to adjust.
Dude, customer feedback and market trends are basically your cheat codes for quarterly planning. Look at what customers are complaining about or raving over - that tells you which features to push or problems to solve. Market data shows where demand's heading, so you can shift resources before everyone else catches on. I swear, teams that ignore this stuff always act shocked when their numbers crash mid-quarter. Review both monthly, then tweak your messaging and target different segments. Oh and honestly? The companies crushing it right now are the ones actually listening to this data instead of just collecting it.
Look, competitive analysis is basically your reality check on quarterly numbers. That 15% growth might seem awesome until you find out everyone else hit 25% - then you're actually behind. I always tell people to track what competitors are doing with pricing and product drops throughout the quarter. Otherwise you're just celebrating in a bubble, you know? The whole market could've exploded and you'd think your strategy was genius. It's happened to me before, honestly. Raw sales data means nothing without context. Compare against competitors and suddenly those numbers tell you what's really working.
Honestly, just focus on telling a story with your data instead of throwing numbers at people. Bar charts are perfect for comparing quarters, and line graphs show trends super clearly. Dashboard layouts are everywhere now - you can display multiple metrics without making people's heads spin. Skip pie charts for sales stuff though, they're pretty useless here. Color-code by product or region so patterns pop right away. Here's the thing - pick maybe 2-3 metrics that actually matter to whoever you're presenting to. Build everything around what they need to make decisions.
Don't fall into the seasonality trap - Q4 vs Q2 is like comparing apples to oranges, so stick to year-over-year comparisons. Breaking down by product lines and regions is huge because those aggregate numbers can be seriously misleading. I learned this the hard way when I got obsessed with total revenue and completely missed some warning signs. One-time deals will mess with your head too, so watch for those. Honestly, just make yourself a template with different views - saves me so much time and I don't miss the obvious stuff anymore.
Dude, you're missing so much by just staring at sales numbers alone. Get marketing, product, and customer success in the room - they'll tell you WHY that weird Q2 dip actually happened. Was it a bug? Bad campaign timing? People churning like crazy? Finance can spot seasonal stuff you'd never notice too. Honestly feels like night and day once you see the bigger picture. I'd do monthly cross-team sessions where everyone brings their top insights that might mess with your sales. Takes like an hour but saves you from wild goose chases later.
Dude, training really works - I've seen teams jump 15-20% in just 2-3 months after good programs. Your reps get way better at explaining products and closing deals. They also sound way more confident on calls, which honestly makes a huge difference. Better product knowledge means they can actually upsell existing clients instead of just taking orders. The math works out too since higher close rates pay for the training pretty fast. Oh, and definitely track your close rates before/after so you can actually see the impact. Some managers skip that part and miss seeing how much it helped their quarterly numbers.
Stop burying people in spreadsheets! Your quarterly results need a real story. What was the goal? What went wrong? Like that July sales dip from the product delay - we've all been there, right? Then show how you bounced back in September. Honestly, stakeholders tune out without the narrative thread connecting everything. Throw in some actual customer wins or specific examples. Structure it like you're telling a friend what happened, not reading from a boring report. Short version: make them care about the journey, not just the final numbers.
Pipeline velocity is probably the biggest one nobody talks about enough - shows how fast deals actually move. Revenue growth, win rates, and average deal size are obvious picks. Customer acquisition cost vs lifetime value matters too. I'd definitely track quota performance by rep and territory, plus lead conversion at each stage. Sales cycle length helps with forecasting way more than people realize. Oh and honestly? Start simple with maybe 5-6 of these instead of going crazy with dashboards. Better to nail the basics than drown in data you won't use.
Honestly, most people just stare at their quarterly numbers without doing anything useful with them. Check what channels actually converted - if social killed it but your emails flopped, move that budget around for next quarter. Same with audiences. Double down on segments that worked and either fix the duds or cut them loose. The biggest mistake I see (and this drives me nuts) is teams spend forever making fancy reports but never actually change anything. Block out time each quarter to dig into the data, then immediately tweak your targeting and spend based on what you find.
Start with the easy stuff and get some wins on the board - even small ones count right now. Honestly, I'd just be straight up about what happened instead of acting like nothing's wrong. People can tell anyway, you know? Break things down into shorter goals so your team actually feels like they're accomplishing something. Maybe throw in some training sessions or get them better leads to work with. Once you get a couple victories, the momentum kind of builds itself. It's weird how that works but it really does. The confidence thing fixes itself once people start succeeding again.
-
Easy to edit slides with easy to understand instructions.
-
Helpful product design for delivering presentation.
-
relevant and effective
highly resourceful aid for management decision making