


Real Estate System Dashboard Snapshot For Rental Property Management




Try Before you Buy Download Free Sample Product
 Impress Your
 Audience
 100%
100% Editable
 Save Hours
 of Time


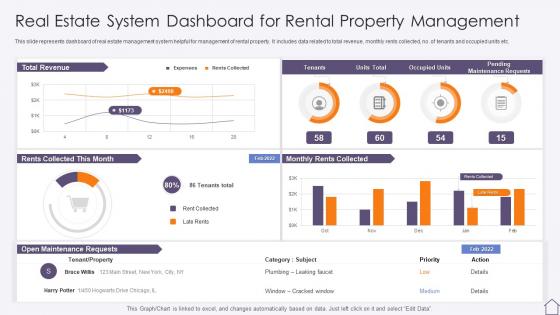
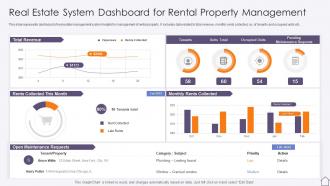
This slide represents dashboard of real estate management system helpful for management of rental property. It includes data related to total revenue, monthly rents collected, no .of tenants and occupied units etc.
People who downloaded this PowerPoint presentation also viewed the following :
Real Estate System Dashboard Snapshot For Rental Property Management with all 7 slides:
Use our Real Estate System Dashboard Snapshot For Rental Property Management to effectively help you save your valuable time. They are readymade to fit into any presentation structure.





FAQs for Real Estate System Dashboard Snapshot For
Focus on property values, days on market, inventory levels, and price per square foot - those four will cover most of what you need. Sales volume and absorption rates show you how fast things are moving. Cap rates and rental yields matter for investment stuff obviously. Honestly, I see so many people get caught up in creating these elaborate dashboards that look cool but tell you nothing. Geographic breakdowns are clutch for spotting trends. Year-over-year comparisons too. Start simple with these basics, then add whatever specific metrics your team actually uses to make decisions faster.
Okay so real estate dashboards are pretty clutch - they basically put everything in one spot instead of having you bounce around a million different apps. Agents can see their leads, listings, market data, sales pipeline, all that stuff at once. Buyers get custom property suggestions and alerts when new places pop up that match what they want. Honestly the organization alone makes it worth it since real estate data is usually scattered everywhere. I'd say figure out what features would save you the most time each day and start there first.
Line charts are your best bet for tracking price changes over time - super easy to read the market direction. Heat maps kill it for geographic stuff, like comparing different neighborhoods. Bar charts work well for inventory and days on market data. Scatter plots are honestly my favorite though - nobody uses them enough but they're perfect for spotting weird outliers or showing how price relates to square footage. Keep it simple, don't get fancy with charts that'll confuse everyone. Oh, and definitely add filters for property type and price ranges so people can dig into whatever they actually care about.
Look, those dashboard numbers will show you exactly what's selling and for how much in your area. Way better than just winging it, honestly. You can see how long similar places sit on the market, what comparable properties actually sold for - all that good stuff. If your listing's been up forever, you're probably priced too high. Selling in hours? Maybe too low. I'd check the data weekly because markets shift fast these days. Trust what the numbers say, not what you want them to say. Sounds obvious but you'd be surprised how many people ignore it.
So GIS data is what gives your dashboard actual location smarts. It layers property details with geographic stuff - neighborhood lines, school districts, flood zones, demographics. Way better than staring at spreadsheet numbers all day. You can spot which areas are heating up fastest or find undervalued neighborhoods. Plus you'll see walkability scores and other location factors. The really nice thing? Layer different datasets together and patterns just pop out that you'd totally miss otherwise. I'd say figure out what location stuff matters most for your analysis first, then build your dashboard around those layers.
Dude, real estate dashboards are honestly a lifesaver. You get all your important stuff - cash flow, ROI, occupancy rates - right there on one screen. No more drowning in random spreadsheets (I swear I had like 20 different ones at one point). Spotting underperforming properties becomes super easy, plus you can track overall returns and figure out your next move. The visual setup is clutch when you're presenting to investors too. Oh, and definitely set up automated data feeds if you can - saves you from constantly updating everything manually.
Google Data Studio's probably your best starting point - it's free and does way more than you'd expect. Power BI is solid if your office runs on Microsoft everything (which, let's be honest, most do). Tableau makes the prettiest charts but costs a fortune. Some people swear by those real estate-specific platforms like Chime, though I haven't tried them myself. Excel works too if you're into that kind of pain. I'd mess around with Data Studio first to figure out what you actually want, then maybe upgrade later if you need fancier features.
Look into API integrations or tools like Zapier - they'll sync everything automatically. Your CRM data flows right into the dashboard, so client info, property preferences, deal stages all show up without you typing anything. Seriously saves hours each week. Most CRMs like Salesforce or HubSpot already have built-in dashboard connections, so check that first before getting fancy with third-party stuff. Once it's running, you've got lead sources, communication history, and property matches all in one spot. Takes a bit to set up but honestly? Total lifesaver once you do.
Dude, real-time data is seriously worth setting up. You'll catch market shifts right as they're happening instead of finding out weeks later like everyone else. Your pricing can actually respond to what's going on now, not last month's numbers. Plus clients love when you're on top of current info - makes you look way more professional than the agent still using outdated comps. I'd focus on the basics first though: inventory changes, new listings, price drops. Those alone will give you a solid advantage. Honestly wish I'd started tracking this stuff sooner.
So basically you'd feed all your historical data - prices, market trends, economic stuff - into ML models that spit out forecasts right in your dashboard. Regression analysis works great for price predictions, plus seasonal modeling. Just make sure your data sources are solid because crappy data = crappy results, obviously. I'd display everything as interactive charts with confidence intervals so people know how uncertain the predictions actually are. Honestly, I'd start small - maybe 6-12 month neighborhood price forecasts first. Then once that's working reliably, you can add inventory predictions and market timing indicators.
Keep it stupid simple - if they need instructions, you've already lost them. Put your biggest metrics right upfront and use charts instead of boring data tables. Color coding is your friend here (green = good, red = fix this). Filters should make sense to normal humans, so stick with obvious stuff like dates and property types. Honestly, test it on someone who isn't tech-savvy first. You'll be amazed at what confuses people that seems totally obvious to you. Watch where they click around aimlessly - that's your sign to redesign those sections. Clean navigation beats fancy features every time.
Yeah, so real estate dashboards are all about showing different stuff to different people. First-time buyers see totally different metrics than investors do. Like investors want cap rates and cash flow numbers, but families just care about school ratings and how safe the neighborhood is. The whole interface actually changes - even the wording shifts depending if you're targeting millennials hunting for condos or older folks wanting vacation spots. Pretty clever honestly. You should definitely peek at your analytics to see which groups actually use which dashboard features most. Makes tweaking things way easier.
Your biggest headaches will be around accuracy, privacy, and bias stuff. Double-check that property values and market data are fresh - stale numbers can really screw over buyers. Don't display personal transaction details without permission either. Algorithmic bias is tricky too, especially if it makes certain neighborhoods look worse than they are. Honestly, people make huge financial decisions based on this data, so you'll want solid sources. Maybe throw in some disclaimers about when you last updated everything. It's not glamorous work but beats getting sued later.
So automated reporting is basically like having your dashboard work overtime while you're sleeping. No more pulling data every morning - thank god because that's such a time suck. You'll get real-time updates on leads, property performance, market stuff, commissions, all sent right to your phone or computer. Set up alerts for hot prospects or when prices change. Honestly the best part? You catch opportunities way faster and spend way less time doing boring data stuff, more time actually making money. Game changer for sure.
Dude, mobile access is a total game changer for real estate dashboards. You can update listings and check metrics while you're actually out showing properties instead of running back to the office every time. The best part? Having comps and market data right at your fingertips when clients start asking questions. Makes you look super on top of things. I swear, some agents still don't get how much they're missing by not having mobile-friendly dashboards. You'll be way more responsive to leads too - honestly can't imagine doing business without it anymore.
-
Very unique and reliable designs.
-
Fantastic collection. Loved how we can personalize these templates as per the requirements.