


Real estate investment powerpoint presentation slides


Try Before you Buy Download Free Sample Product
 Impress Your
 Audience
Editable
of Time


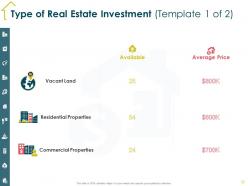
Introducing Real Estate Investment PowerPoint Presentation Slides. The presentation discusses executive summary, real estate market introduction, price-related statistics in real estate industry, investment and sales in real estate, industry analysis, law and regulations, mortgage financing, the cost involved in real estate, budget analysis, cash flow, real estate valuation. Showcase market trends of real estate with the help of readily available PPT slide design. The slides well explain real estate growth drivers, price-related statistics in the real estate industry, prices project appreciation, new home loan applications. The slides also provide investment details in real estate. Give an overview of the real estate market by taking advantage of the real estate business PPT slideshow. Demonstrate the types of real estate investments such as vacant land, commercial properties, residential properties, with the help of these PPT layouts. It covers the data of prices and sales of real estate. You can perform industry analysis of real estate by porter’s five forces analysis. Showcase laws affecting the real estate, real estate financing, loan categories, etc, information with the help of real estate marketing PPT presentation.
People who downloaded this PowerPoint presentation also viewed the following :
Content of this Powerpoint Presentation
Real estate means immovable property, where ownership is linked to land parcels. Its purpose is residential, commercial, or industrial use, also including resources like water or minerals found on the land. Such property is used to build houses or business buildings on it, and each structure is subject to regulation or restriction regarding acquisition and utilization. Real estate investors are individuals who have complete access to a property; they can give it on rent, lease, or even sell.
Real estate investment plays a substantial role in corporate growth. It creates an opportunity to generate income, portfolio diversification, and asset appreciation. Give your property steady streams of rental income, increasing cash flow and lucrativeness. Moreover, by investing in real estate, businesses diversify their investment portfolios and ensure that the risk is lowered. Additionally, owning properties also comes with significant tax advantages and saves money. Real Estate investment adds significantly to long-term corporate success.
Explore an enticing real estate investment proposal presentation designed to maximize your financial potential. Download here.
At SlideTeam, we have a vast collection of PowerPoint designs for business-related concepts. Here, you will find the right resource for your next presentation. These PPT visuals add aesthetics to your content when you demonstrate market trends, financial projections, and investment strategies. These PowerPoint layouts, each 100% editable and customizable, empower companies to generate maximum returns.
Empower your real estate investment decisions with our thorough analysis. Download now & get started.
Template 1: Executive Summary
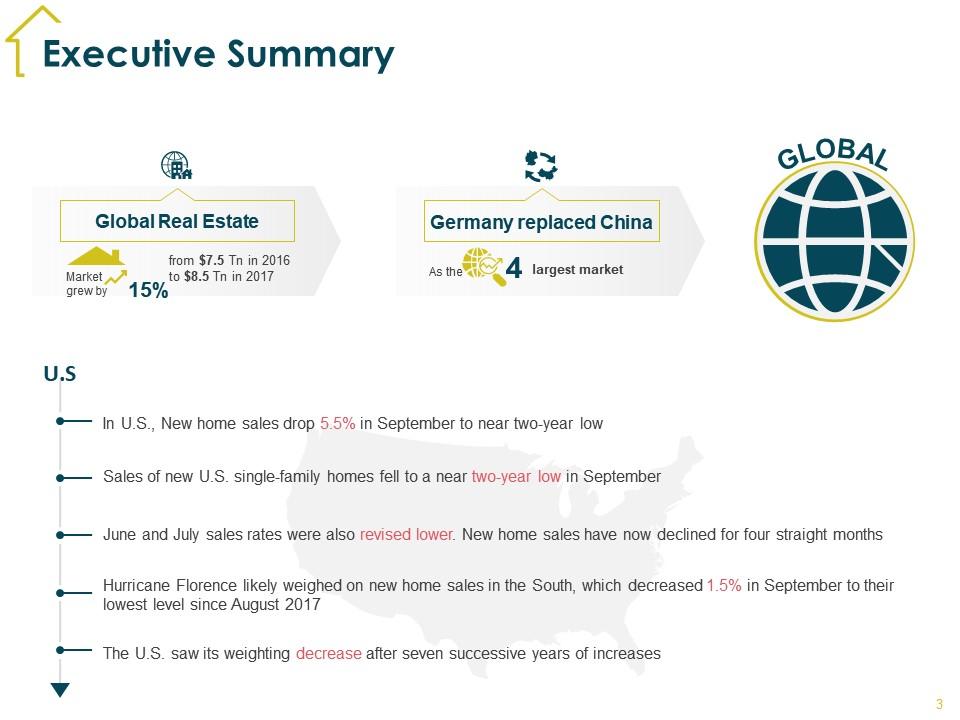
This executive summary presentation design outlines trends in global real estate investment. The world has seen a significant upswing in the sector lately, with growth surpassing expectation, at around 15%. Germany has surpassed China as a leading investment destination. Besides this, the PowerPoint slide focuses on US market data and numbers. The PPT Template depicts opportunities, highlighting the growth potential.
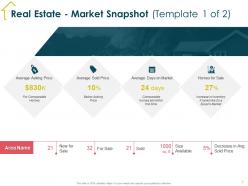
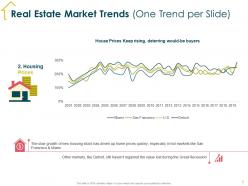
Template 2: Real Estate – Market Snapshot

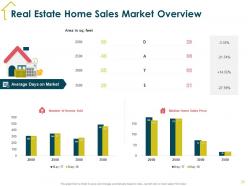
This real estate market snapshot PowerPoint Slide provides statistics on market conditions. The average asking price for comparable homes, average sold price, and percentage sold below the asking price offer insights. The design highlights average days on the market, indicating sales, with comparable homes typically selling within this timeframe.
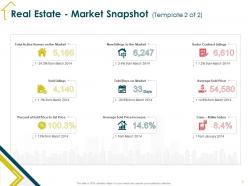
Template 3: Real Estate Market Snapshot Part 2

This real estate market snapshot PPT Layout provides data to study the market. Total active homes available, sold listings, and the percentage of sold price compared to the list price, reflecting market competitiveness can be studied using this data, displayed aesthetically. The idea is to ensure your business is the first mover. Besides this, the presentation design shows metrics like new listings entering the market and the total duration homes stay on the market, offering insights into inventory levels and buyer activity. The PPT graphic adds value to real estate agents, brokers, market analysts, appraisers, and investors.
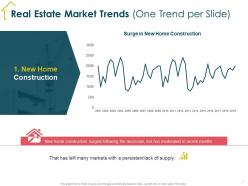
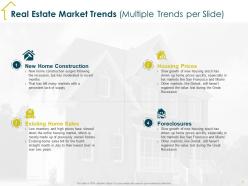
Template 4: Real Estate Market Trends (Multiple Trends Per Slide)
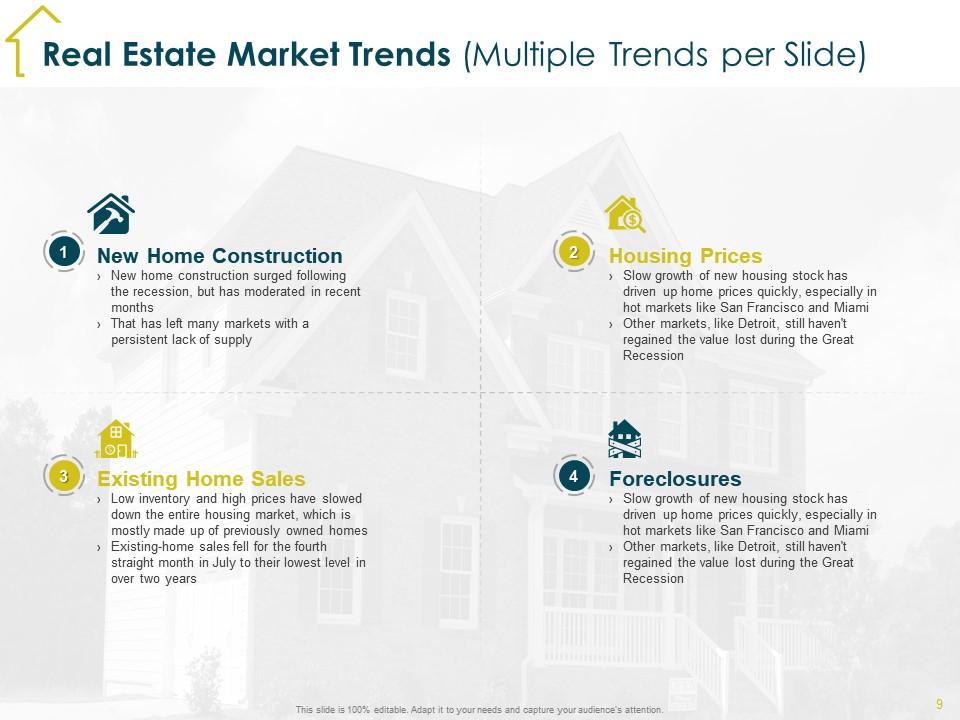
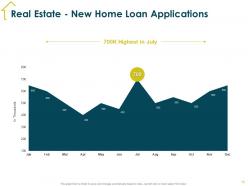
This visual presentation encapsulates critical real estate market trends. The PowerPoint slide encompasses housing prices and foreclosures, existing home sales, and new home construction, presenting a thorough analysis of the market's status and trends. This PPT Template equips stakeholders with insights and aims to ensure no one makes a mistake in the business.
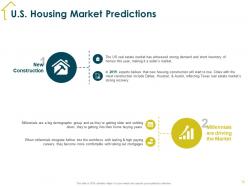
Template 5: U.S. Housing Market Predictions

This PowerPoint diagram highlights critical predictions for the US housing market, emphasizing new construction and the significant influence of millennials. The presentation template helps understand how this demographic group’s entry affects demand and drive market dynamics in the real estate sector. This PPT design adds value to real estate agents, developers, economists, market analysts, and investors. This presentation layout helps in decision-making and coming up with a strategic plan in the real estate sector.
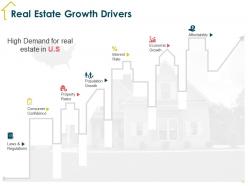
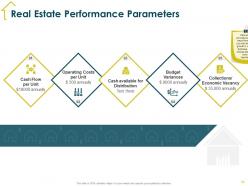
Template 6: Real Estate Growth Drivers
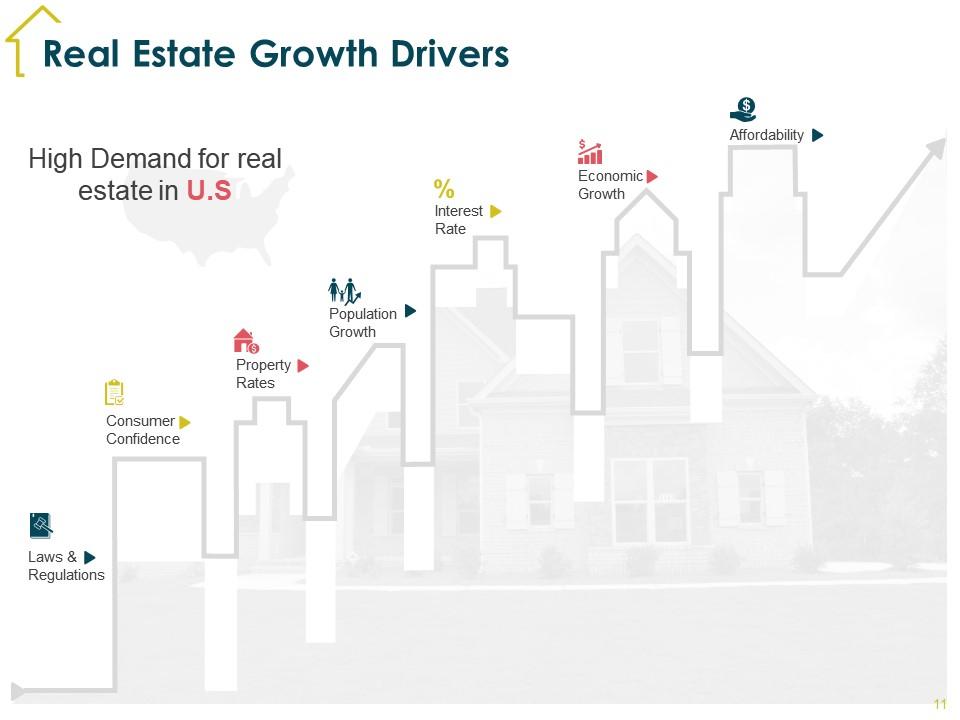
This PPT graphic underscores the key drivers fueling real estate growth and portrays the demand for real estate in the United States. The slide underscores the legal frameworks, consumer sentiment, property valuations, population expansion, interest rates, economic vitality, and affordability, which influence market dynamics. Identifying investment prospects, tracking market trends, and making informed decisions becomes a breeze with this template.
Template 7: Real Estate – Average Price
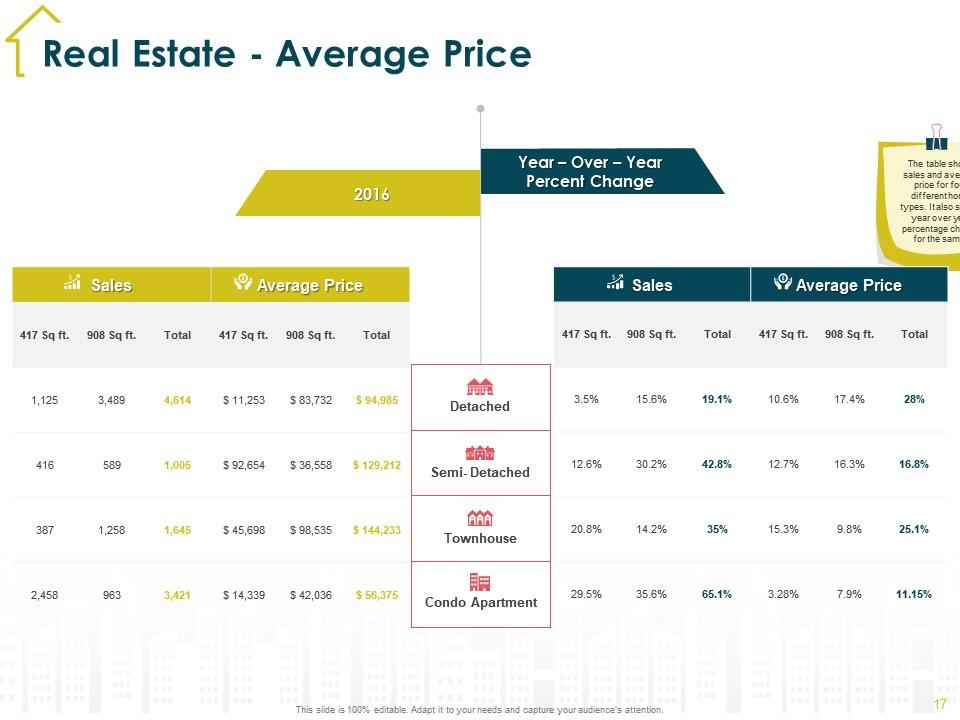
This PowerPoint framework shows the average prices of real estate types. These are detached, semi-detached townhouses and condo apartments. The slide depicts figures on average prices, sales volume, and year-over-year percent changes. The PPT visual helps real estate agents, brokers, market analysts, and appraisers. The PowerPoint template assists them in understanding average prices across property types. Download it now and insert it into your presentation.
Template 8: Most Expensive Metro Areas in The US
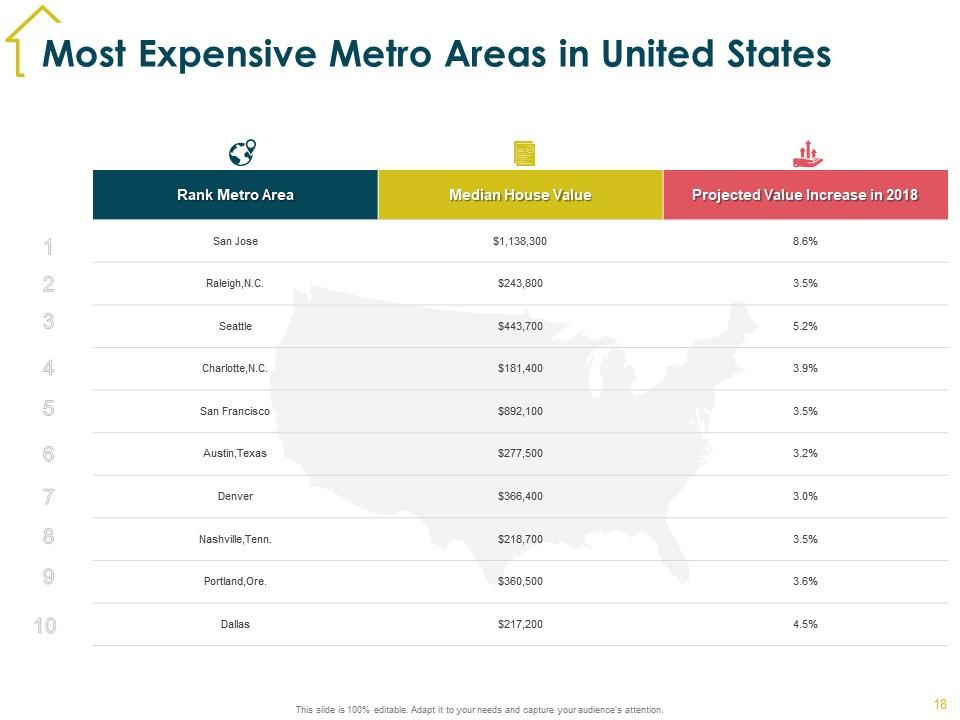
This PPT template outlines the most expensive metro areas in the United States. It ranks them based on median house values and projected value increases in 2018. The presentation slide helps people engaged in real estate work. These professionals can be agents, brokers, investors, market analysts, and even developers. By understanding the market trends in these high-value metro areas, they can adjust their marketing plans. Additionally, they can also use the information available in this PowerPoint graphic to target affluent clientele and identify lucrative investment opportunities. The PPT framework is accessible to download and add to your existing presentation. Just click the download now and get started.
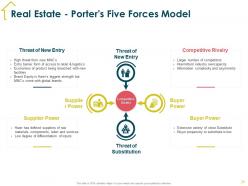
Template 9: Real Estate Porter’s Five Forces Model
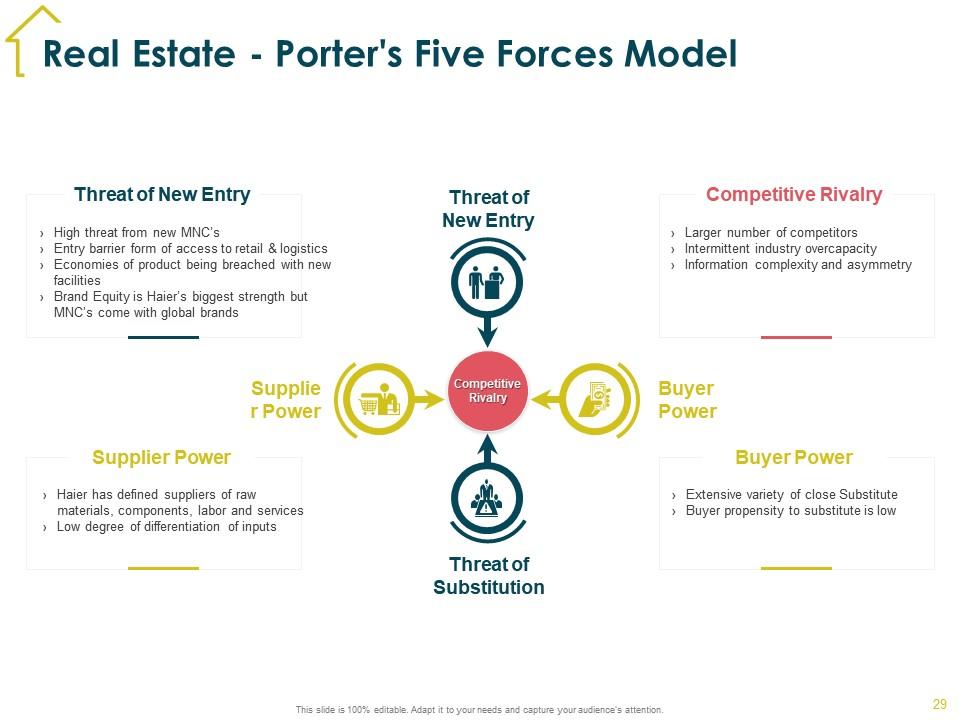
This presentation template defines how Porter's Five Forces model makes a difference in the real estate sector. It showcases all five of these, starting with assessing the threat of new entry, buyer power, threat of substitution, supplier power, and competitive rivalry. Analysts, consultants, market strategists, real estate developers, and investors find this template of value. The five forces depicted on the slide help empower them to evaluate market dynamics, recognize competitive pressures, and articulate strategies to improve market position and profitability.
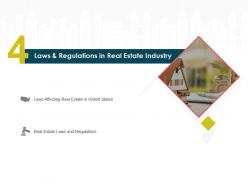
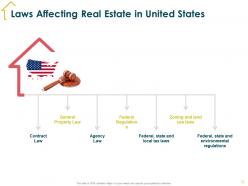
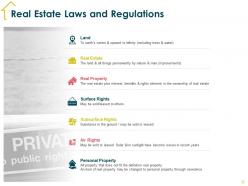
Template 10: Real Estate Laws and Regulations
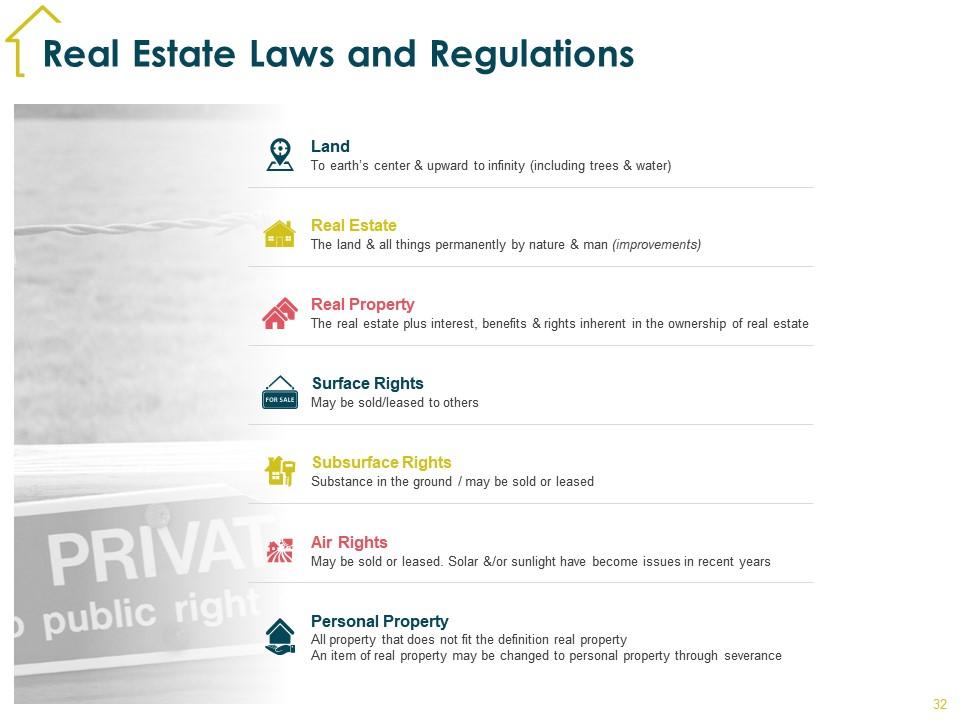
This PowerPoint Design showcases laws and regulation around real estate as comprising land, real property, surface rights, subsurface rights, air rights, and personal property. This presentation visual is ideal for real estate attorneys, property developers, real estate agents, land surveyors, and compliance officers. This PPT Template makes their audience understand the importance of these laws and regulations. The PowerPoint Template enables them to follow compliance at their level while resolving disputes and protecting the rights of property owners. Additionally, this presentation diagram creates awareness on potential mitigation risks involved in buying and selling a property.
Real Estate: Building Your Future
Real estate investment opportunities for corporations and individuals to generate revenue. Whether you are creating presentations on residential, commercial, or industrial properties, these PowerPoint slides will help you make the right decisions and create an impact on your audience. Download these PPT templates now to gain your investors or clients confidence.
Real estate investment powerpoint presentation slides with all 77 slides:
Use our Real Estate Investment Powerpoint Presentation Slides to effectively help you save your valuable time. They are readymade to fit into any presentation structure.


FAQs for Real estate investment
Honestly, it's mostly about interest rates, remote work, and just not having enough houses to go around. Rates going up means fewer people can afford to buy, but good neighborhoods? Still crazy competitive. Everyone wants a home office now and some yard space - remote work totally changed what people are looking for. New construction is moving at a snail's pace because of supply chain stuff and labor costs. So inventory stays tight pretty much everywhere. Oh, and definitely keep an eye on local job markets and any big infrastructure projects coming to your area. That's what really drives demand long-term.
Okay so first thing - crunch the numbers on cash flow. Rental income vs mortgage, taxes, insurance, maintenance, all that stuff. Research the neighborhood too - job market, growth trends, recent sales. Honestly I get lost scrolling Zillow for hours looking at comps but whatever, it works. Get an inspection obviously and budget for any big repairs. Oh and don't forget vacancy periods when you're calculating everything - that'll bite you if you skip it. Run conservative numbers and if something feels weird during the walkthrough, just trust that feeling.
Dude, location really is everything - learned that the hard way with my first place lol. A decent house in an awesome area beats a perfect house somewhere sketchy every time. Look at school districts first, then check how close it is to jobs and transit. Walk around the neighborhoods you're thinking about too. You'll pick up on weird vibes or see if it's getting nicer. Oh and pull up market data for the area - some spots just don't appreciate much no matter what. The good locations tend to stay good though, which is nice.
Yeah, interest rates basically control everything in real estate. Higher rates = higher mortgage payments, which tanks your cash flow and scares off buyers. Prices usually drop. Lower rates make borrowing cheap, so property values go up - it's pretty predictable honestly. Employment and GDP matter too since they affect who can actually afford to rent or buy. Oh, and watch Fed meetings religiously. They'll telegraph rate changes way ahead of time, which gives you a huge advantage for timing purchases or sales. Most people ignore this stuff but it's literally free intel.
Honestly? Go residential first. Way easier to wrap your head around - people always need housing, financing isn't a nightmare, and you can start with smaller properties. Commercial sounds sexy with those higher returns and 5-10 year leases, but the down payments will crush you. Plus you need to understand zoning, business trends, all that stuff. And if your commercial tenant's industry tanks... yikes. At least with residential, someone's always gonna need an apartment, you know? Build up some cash and experience first, then maybe look at commercial down the road.
Don't put everything in one basket - mix up property types and locations to protect yourself when markets get weird. Residential rentals, commercial stuff, maybe some REITs if you want exposure without dealing with tenant drama. Instead of dropping all your cash at once, space out your purchases over time. Cash reserves are boring but honestly saved my butt when I had three vacant units last year. Oh, and start with one approach first - you can always branch out once you figure out what actually works for you.
Look, traditional mortgages are probably your best bet to start - just know you'll need 20-25% down since it won't be your primary home. House hacking with an FHA loan is actually pretty smart if you can swing it (like living in half a duplex). My buddy did this and loved it. Hard money's there for flips but it's expensive. Oh, and seller financing is underrated - basically the owner becomes your lender. Definitely get pre-approved with someone who knows investment properties first though. You don't want to be house shopping blind.
Honestly, management can totally make or break your returns. Good ones keep vacancy low and handle maintenance before it becomes a nightmare. Bad ones? Higher turnover, tenants who don't pay, and you're stuck with expensive repairs that could've been prevented. Yeah, they'll charge 8-12% of rent, but decent managers usually pay for themselves through better screening and keeping tenants longer. If you're not nearby or just don't want the hassle, find someone with solid references. Clear communication is huge too - you don't want to be left guessing what's happening with your property.
So real estate investors get some pretty decent tax perks. You can write off mortgage interest, property taxes, and repairs against your rental income. Depreciation is where it gets interesting though - it's basically a fake loss on paper that cuts your taxes even while your property's probably going up in value. Hold onto properties for more than a year and you'll pay capital gains rates instead of regular income tax when you sell. One heads up: that depreciation comes back to bite you later through recapture taxes. Worth talking to an accountant honestly, there's probably stuff I'm forgetting.
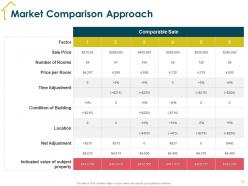
Seriously, don't skip the CMA - I made that mistake on my second property and it sucked. You need to see what similar places actually sold for recently, not just listing prices. Overpriced deals become obvious right away, plus you'll know if it's actually worth it or total garbage. The data helps estimate realistic rental income too. Without comps, you're just guessing and that's sketchy. Pull everything within half a mile from the last few months before you make offers. Trust me on this one.
Honestly, the space is moving insanely fast right now. AI valuation tools are huge - way more accurate than the old methods. Virtual tours and AR stuff are pretty standard now too. Blockchain's making transactions smoother, though still feels a bit gimmicky to me sometimes. Smart building tech is where I'd put my attention though. IoT systems actually boost property values in real ways. Fractional ownership platforms are cool if you don't have tons of cash upfront. Digital management tools handle everything from screening tenants to fixing broken stuff. My advice? Subscribe to a couple PropTech newsletters and hit up some virtual demos. Half of it's hype, but you'll spot the gems.
So basically these platforms let you throw in like $500-1000 with a bunch of other people to invest in real estate deals. Before this, you'd need six figures just to get started - which is insane honestly. You can get into commercial buildings, apartment complexes, all that stuff without dealing with tenants calling you at 2am about broken toilets. Fundrise and RealtyMogul are pretty solid options. Just watch out for fees and don't expect to pull your money out quickly if you need it.
Dude, definitely look up zoning laws before you buy anything. They control what you can actually do with the property - like whether it's residential, commercial, or mixed-use. Can't run a business from a residential-only zone, you know? Some places have bizarre rules too (no Airbnbs, weird building restrictions). Start with the planning department's website, but honestly? Just call them. Way easier to get straight answers that way. Oh, and check if they're planning any zoning changes - those can mess with your property value. Trust me, it's worth spending a few hours researching now instead of dealing with expensive headaches later.
So rentals are basically about that monthly cash coming in - you're thinking tenant demand, expenses, all the landlord stuff. Buying to sell is more about timing and finding deals you can flip or hold till values go up. Rentals feel way more predictable to me, even when you get stuck with some crazy tenant (which happens). The gains are smaller but steadier. Buying's riskier but the payoff can be huge if you time it right. Really depends what kind of cash flow works for your situation - steady monthly income or waiting for those bigger but less guaranteed profits.
Rising interest rates are your first warning sign. More inventory sitting around longer? That's when I'd start getting nervous. Price cuts everywhere usually follow right behind. Construction permits dropping is useful but honestly comes too late to be super helpful. Rental vacancies tick up too, and cap rates get squeezed. Don't obsess over just one thing though - you need to watch several indicators at once or you'll get a false read. Oh, and set up Google alerts for local market stuff so you're not constantly hunting for data.
-
Excellent work done on template design and graphics.
-
Editable templates with innovative design and color combination.
-
Enough space for editing and adding your own content.
-
Great designs, Easily Editable.
-
Easy to edit slides with easy to understand instructions.