


Real Estate Investment Analysis Powerpoint Presentation Slides


Try Before you Buy Download Free Sample Product
 Impress Your
 Audience
Editable
of Time


Are you looking for a real estate investment analysis Powerpoint presentation to share your amazing business plan for real estate? No problem! To help you out here we are presenting a readymade slide presentation to highlight the factors to consider when investing in real estate. Furthermore, before launching your next property business plan using presentation templates included in this PPT example you can illustrate real estate location analysis. This PowerPoint slide deck also supports to underline significant features of a business plan financials so as to convince potential purchasers to go for the deal. Going further, this sample of PPT presentation assists property investment companies to introduce themselves as well as to unveil curtain over their services. To make our PPT model more precise we have included exclusive presentation slides like real estate – market size, real estate market activity, real estate trends, real estate – sales growth, real estate rents and many more. In short, with our pre designed property investment analysis Powerpoint show you are one step closure in turning your analysis into an amazing visual communication. Influence their impressions with our investment ppt Slides. Get folks feeling good about the days to come.
People who downloaded this PowerPoint presentation also viewed the following :
Content of this Powerpoint Presentation
Slide 1: This slide introduces Real Estate Investment Analysis.State your company name and get started.
Slide 2: This slide presents Table Of Contents.
Slide 3: This slide presents Agenda. You can add the company agenda and use it.
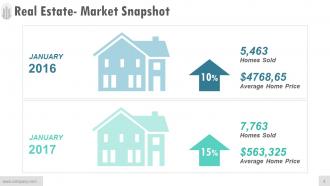
Slide 4: This slide shows Real Estate- Market Snapshot.
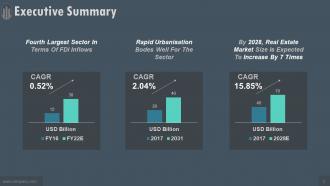
Slide 5: This slide showcases Executive Summary.
Slide 6: This slide presents Real Estate- Market Size.
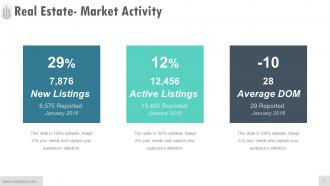
Slide 7: This slide shows Real Estate- Market Activity.
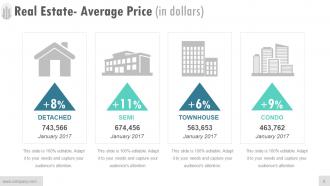
Slide 8: This slide showcases Real Estate- Average Price (in dollars).
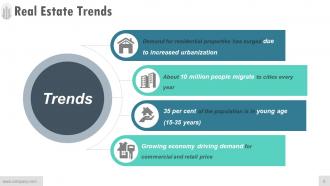
Slide 9: This slide presents Real Estate Trends which also showcases four different categories which you can use.
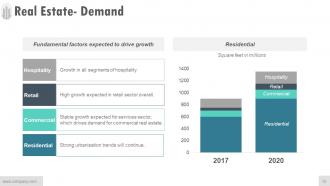
Slide 10: This slide showcases Real Estate- Demand. You can add the stages and use it.
Slide 11: This slide presents Real Estate- Opportunities.
Slide 12: This slide shows Real Estate- Major Investments. Add the major investements.
Slide 13: This slide presents Real Estate- Policy Support. State the Policy Support and use it.
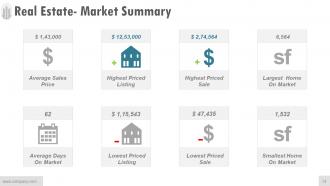
Slide 14: This slide shows Real Estate- Market Summary.
Slide 15: This slide presents Real Estate- Market Analysis Infographic.
Slide 16: This slide showcases Real Estate- Market Outlook.
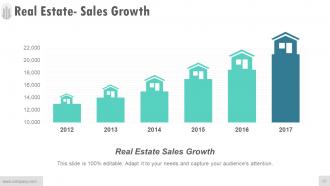
Slide 17: This slide presents Real Estate- Sales Growth.
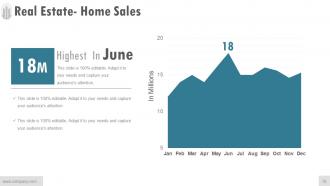
Slide 18: This slide presents Real Estate- Home Sales.
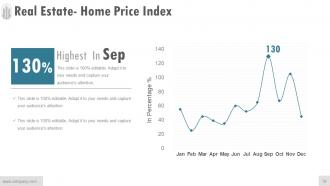
Slide 19: This slide showcases Real Estate- Home Price Index.
Slide 20: This slide presents Real Estate- Prices (Projected Appreciation).
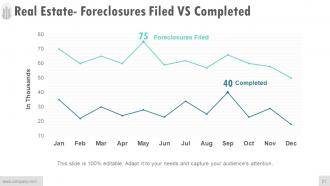
Slide 21: This slide shows Real Estate- Foreclosures Filed VS Completed.
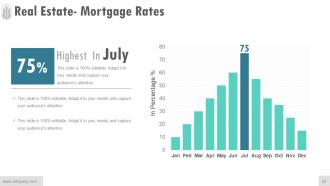
Slide 22: This slide presents Real Estate- Mortgage Rates.
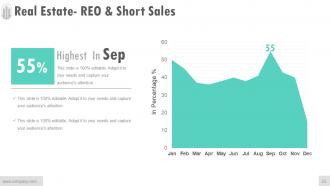
Slide 23: This slide showcases Real Estate- REO & Short Sales.
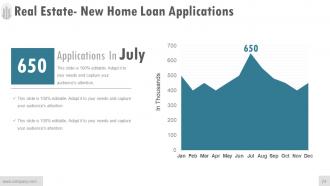
Slide 24: This slide shows Real Estate- New Home Loan Applications.
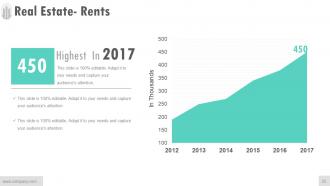
Slide 25: This slide presents Real Estate- Rents.
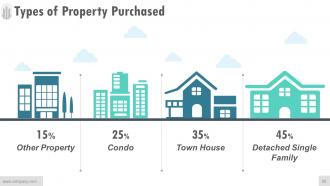
Slide 26: This slide showcases Types of Property Purchased with these of the parameters- Other Property, Detached Single, Family, Condo, Town House,
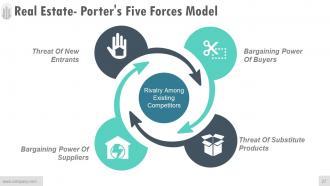
Slide 27: This slide shows Real Estate- Porter's Five Forces Model with these of the five parameters- Rivalry Among Existing Competitors,, Bargaining Power Of Buyers, Threat Of New Entrants, Threat Of Substitute Products, Bargaining Power Of Suppliers.
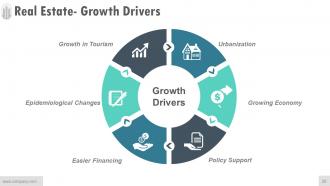
Slide 28: This slide showcases Real Estate- Growth Drivers with these of the parametrs- Urbanization, Growing Economy, Policy Support, Easier Financing, Epidemiological Changes, Growth in Tourism, Growth Drivers.
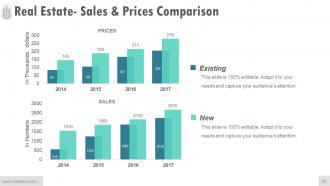
Slide 29: This slide showcases Real Estate- Sales & Prices Comparison.
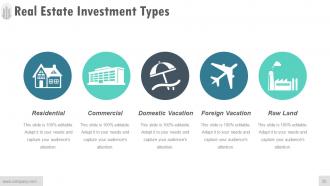
Slide 30: This slide shows Real Estate Investment Types with these five main categories- Raw Land, Foreign Vacation, Domestic Vacation, Commercial, Residential.
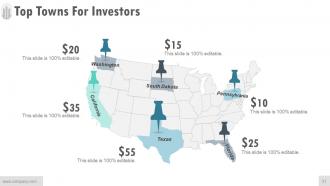
Slide 31: This slide showcases Top Towns For Investors. You can add the data and use it.
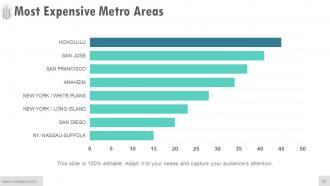
Slide 32: This slide shows Most Expensive Metro Areas.
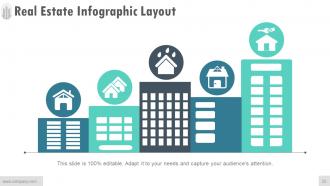
Slide 33: This slide presents Real Estate Infographic Layout.
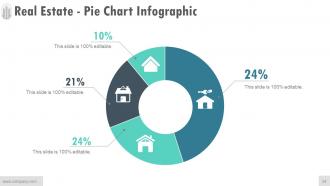
Slide 34: This slide showcases Real Estate - Pie Chart Infographic.
Slide 35: This slide shows Real Estate Icon Set.
Slide 36: This slide presents additional slides.
Slide 37: This is a Vision, Mission and Goals slide. State them here.
Slide 38: This is an Our Team slide with name, image &text boxes to put the required information
Slide 39: This is an About Us slide showing Our Company, Value Client, and Premium services as examples
Slide 40: This is an Our Goal slide. State them here.
Slide 41: This slide shows Comparison of Positive Factors v/s Negative Factors with thumbsup and thumb down imagery.
Slide 42: This is a Financial Score slide to show financial aspects here.
Slide 43: This is a Dashboard slide to show- Strategic System, Success, Goal Process, Sales Review, Communication Study.
Slide 44: This is a Timelines slide to show- Plan, Budget, Schedule, Review.
Slide 45: This is a Newspaper slide to highlight something or add memeorabilia.
Slide 46: This slide presents a PUZZLE slide with the following subheadings- Integrity and Judgment, Critical and Decision Making, Leadership, Agility.
Slide 47: This is a Target slide. State your targets here.
Slide 48: This is a Circular slide to show information, specification etc.
Slide 49: This is a Circular image slide to show information, specifications etc.
Slide 50: This slide shows a Mind map for representing entities.
Slide 51: This slide shows a Matrix in terms of High and Low.
Slide 52: This is a LEGO slide with text boxes to show information.
Slide 53: This is a Hierarchy slide showing- Supply Chain Manager, Supply Chain Council, Sourcing, Supplier Quality Engineer, Procurement, Logistics & Management, Supplier Management, Student, Contract Management.
Slide 54: This is a Bulb Or Idea image slide to show information, innovative aspects etc.
Slide 55: This is a Magnifying glass image slide to show information, scoping aspects etc.
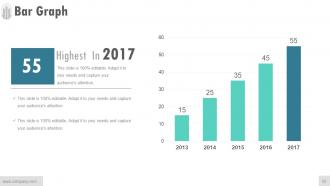
Slide 56: This is a Bar Graph image slide to show product comparison, growth etc.
Slide 57: This is a Funnel image slide showing: Calls-to-action, Reachability, User Experience, Color Schemes, Engagement, Simplicity.
Slide 58: This is a Thank You image slide with Address, Email and Contact number.
Real Estate Investment Analysis Powerpoint Presentation Slides with all 58 slides:
Get to hook the best brains available with our Real Estate Investment Analysis Powerpoint Presentation Slides. It helps dangle the bait.


FAQs for Real Estate Investment Analysis
Honestly, just nail these four and you're golden. Cap rate shows what the property yields without factoring in your loan. Cash-on-cash is way more useful though - that's your actual return on whatever cash you threw down. NOI is dead simple: rent minus expenses. But here's the thing - if you're financing (which, duh, most people are), definitely run your debt service coverage ratio too. Lenders obsess over that number. I'd probably start with cap rate and cash-on-cash for comparing deals, then dig into the others once something looks promising.
Dude, location is literally make or break for ROI. Job growth, decent schools, low crime - that's what drives both rent prices and appreciation. I've seen total dumps in prime spots crush gorgeous houses in sketchy areas every time. Your tenant quality gets way better too, plus fewer vacancies. Check employment trends and any new developments coming in. Oh and definitely cruise around the neighborhood at different hours - you'd be surprised what you notice at like 10pm versus noon on a Tuesday. Crime stats are online but nothing beats seeing it yourself.
Dude, market trends are everything in real estate valuation. Supply/demand, interest rates, jobs, demographics - all that stuff matters way more than people think. I totally messed up ignoring this on a property last year, btw. Hot markets can bump values 10-20% while cold ones drag them down. Your comps are basically useless unless you know where the market was headed when those sales closed. Pull recent absorption rates and check pending inventory. That's how you figure out if values are climbing or tanking right now.
Add those renovation costs right to your purchase price when you're crunching numbers - they're part of your initial investment, not monthly expenses. Get real estimates from contractors first though, don't just wing it. I always tack on 15-20% extra because something always goes wrong (trust me on this one). Factor everything into your cash-on-cash return and cap rate. The whole point is boosting your rental income and property value anyway. Track both what you spend and how much value you actually add so you can see if it was worth it.
BiggerPockets calculators are solid for starting out - they're free and handle most basic stuff. I'm obsessed with my custom Excel templates honestly, probably spent way too many hours perfecting them but they're worth it once you get the hang of it. Google Sheets works too if you don't have Excel. DealCheck's decent for quick mobile analysis when you're actually out looking at places. The fancy software like ARGUS or RealData is expensive but powerful if you're doing serious volume. Just start with the free tools first though - no point spending money until you know what you actually need.
Look, cash flow projections are like your financial reality check before buying rental property. You're basically mapping out rental income vs all your expenses - maintenance, taxes, those annoying vacancy months when nobody's paying rent. Too many people I know skipped this part and got wrecked later. Run three scenarios: worst case, realistic, and if everything goes perfect. Short sentences keep it simple. The numbers don't lie about whether you'll actually make money or just break even. Trust me, it beats finding out the hard way that your "investment" is bleeding cash every month.
Look at cap rates and cash flow first, then check vacancy rates in your area. Location trumps everything else though - honestly, I'd rather have an okay duplex in a solid neighborhood than some gorgeous house where I'm scared to collect rent at night. Run the math on at least 3 similar properties so you're not just guessing. Don't forget to factor in big repairs and market dips when you're calculating returns. Also compare it to throwing that money in index funds since real estate locks up your cash for years.
Okay so cap rates - you gotta look at location, age, and condition first since those basically set your risk level. Interest rates and investor demand make these things bounce around constantly. Property type matters a ton too (multifamily is way different from retail or office). Here's what screws people up though - they don't compare their financing costs to the actual cap rate. Check vacancy rates in that specific area and how stable the rental market is. Oh and definitely pull some recent comps in the same submarket to see if you're not getting ripped off.
So rates basically control everything in real estate investing, right? Low rates mean cheap borrowed money, so your cash-on-cash returns look way better and more deals actually work. High rates squeeze your profits hard - suddenly that "great" deal isn't so great anymore. But here's what's kinda cool about expensive money: it scares off other investors. Less competition, softer property prices. I've seen some decent opportunities pop up when everyone else freaks out. My advice? Change your buying criteria based on whatever rates are doing, and always run the numbers assuming rates go higher. Trust me on that last part.
Dude, zoning laws basically control what you can do with property - like whether it's residential, commercial, or mixed-use. They set rules on building height, how dense you can build, parking spots, all that stuff. The crazy part is zoning can change over time. You could buy residential and it gets rezoned commercial later (hello money!) or the opposite happens and you're screwed. I'd definitely check the local zoning map first and see if there's any pending changes. Oh and talk to the planning department - they usually know what's coming down the pipeline for the area.
Demographics totally shift what people want to buy and how much they'll pay. Millennials are finally buying houses, so suburban single-family places are hot right now. Boomers are getting older and want accessible stuff or condos to downsize - this trend's gonna be huge for years, honestly. People moving between states changes pricing too. You should definitely check migration numbers, birth rates, age breakdowns in your areas. Oh and employment data matters since job growth pulls in specific age groups. My advice? Always dig into local demographic trends before you invest anywhere.
So here's the deal - commercial properties let you depreciate over 39 years vs 27.5 for residential, which honestly isn't as exciting as it sounds. You can write off way more stuff though: property management, utilities, maintenance, all that. Residential gets weird if you're living in part of it or renting to your cousin or whatever. 1031 exchanges work for both types but commercial deals tend to be more complicated tax-wise. My brother went through this whole thing last year. Definitely talk to your accountant first - the numbers might surprise you either way.
Start with gross rental yield - just divide annual rent by property price, multiply by 100. Then subtract all your actual costs like taxes, maintenance, vacancies, management fees to get the real picture. Those online calculators are pretty useless honestly, they don't know your local market. I'd pull data on 5-10 similar properties in each area you're looking at. Check historical occupancy rates and how long places sit empty. Always assume at least 10% vacancy unless you've got rock-solid proof otherwise - learned that one the hard way. Different cities have totally different expense ratios too.
Dude, property management literally makes or breaks your returns. Good managers keep places rented, fix stuff before it explodes, and deal with tenant drama. Bad ones? You're stuck with empty units and massive repair bills from things they ignored. I learned this the hard way with my first rental - thought I could handle everything myself until I got a 3am call about flooding. Unless you want to be on call 24/7, just hire someone. Yeah, it'll cost you around 8-12% of rent, but honestly? Worth every penny for your sanity.
Honestly, data analytics is a game-changer for real estate. You'll spot patterns that you'd totally miss just staring at spreadsheets all day. I'm talking comparable sales analysis, predicting where markets are headed, checking out neighborhood demographics - all backed by actual numbers instead of gut feelings. It's wild how much you can see when you have the right data. Other investors are basically flying blind while you're catching opportunities and red flags they completely miss. Oh, and the timing aspect is huge too - knowing when to buy or sell makes such a difference. Start simple with CoStar or even Excel, then upgrade as you get the hang of it.
-
Professional and unique presentations.
-
Innovative and Colorful designs.