

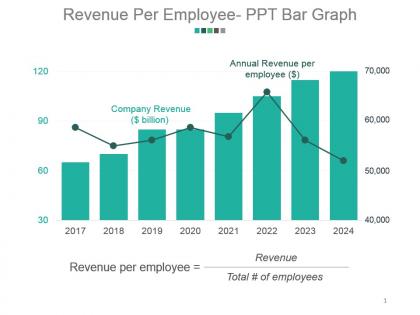
Revenue per employee ppt bar graph powerpoint slide background image




Try Before you Buy Download Free Sample Product
 Impress Your
Audience
 100%
Editable
 Save Hours
of Time


Go across borders with our Revenue Per Employee Ppt Bar Graph Powerpoint Slide Background Image. Fulfill your dreams of global expansion.
People who downloaded this PowerPoint presentation also viewed the following :
Revenue per employee ppt bar graph powerpoint slide background image with all 5 slides:
Let us help your next presentation succeed. Thousands of styles of Revenue Per Employee Ppt Bar Graph Powerpoint Slide Background Image are waiting to be incorporated into your projects.


FAQs for Revenue per employee ppt bar graph powerpoint
Key factors influencing revenue per employee include automation levels, skill requirements, capital intensity, pricing models, and operational efficiency. These factors vary significantly across industries, with technology companies achieving higher ratios through scalable software products, while manufacturing relies on automated processes and healthcare depends on specialized expertise, ultimately delivering competitive advantages through strategic resource optimization.
Organizations improve revenue per employee by investing in automation technologies, enhancing employee training and development, streamlining operational processes, and implementing performance-based incentive systems. These strategic approaches enable businesses to maximize productivity while minimizing workforce costs, with many companies finding that technology integration and skills development ultimately deliver higher profit margins and competitive advantage.
Company culture significantly impacts revenue per employee by fostering employee engagement, encouraging innovation, promoting collaboration, and reducing turnover costs. Organizations with strong cultures see enhanced productivity through improved communication, streamlined decision-making, and strategic talent retention, with many companies finding that positive cultural environments ultimately deliver higher operational efficiency and competitive advantage.
Automation and technology significantly boost revenue per employee by streamlining operations, reducing manual labor costs, and enabling faster service delivery. Manufacturing companies using robotic systems and financial institutions implementing AI-driven customer service often see dramatic productivity gains, while retail organizations leveraging inventory automation deliver enhanced efficiency, ultimately creating substantial competitive advantages through optimized resource allocation.
Yes, revenue per employee benchmarks vary significantly across sectors, with technology companies typically achieving $200,000-$500,000, financial services averaging $100,000-$300,000, and manufacturing ranging from $150,000-$400,000 depending on automation levels. These benchmarks enable organizations to assess operational efficiency, identify optimization opportunities, and strategically allocate resources, with many companies finding that consistent measurement against industry standards ultimately delivers competitive advantage and improved profitability.
Small businesses can leverage revenue per employee to demonstrate operational efficiency, scalability potential, and management effectiveness to investors. By showcasing strong per-employee productivity metrics alongside growth trajectories, startups and small companies can differentiate themselves in competitive funding environments, with many investors finding that businesses with optimized workforce efficiency deliver superior returns and sustainable competitive advantages.
Employee training significantly enhances revenue per employee by improving productivity, reducing errors, and accelerating skill development across teams. Well-trained employees deliver higher-quality outputs, streamline processes, and adapt to new technologies more effectively, with organizations investing in comprehensive training programs finding measurable increases in individual contribution rates and overall operational efficiency.
Market conditions significantly impact revenue per employee through economic cycles, industry demand fluctuations, and competitive pressures that influence both top-line growth and workforce optimization strategies. During economic downturns, companies often streamline operations and reduce headcount while maintaining revenue targets, potentially improving this ratio, while growth periods may require workforce expansion that temporarily dilutes the metric before productivity gains materialize.
Businesses can maximize revenue per employee during downturns by streamlining operations through automation, investing in upskilling programs, optimizing resource allocation, and focusing on high-value services. These strategies enable organizations to maintain productivity with leaner teams, with many companies finding that strategic technology investments and cross-training initiatives deliver sustained competitive advantages even in challenging markets.
Employee engagement significantly enhances revenue per employee through increased productivity, reduced turnover costs, and improved customer satisfaction scores. Engaged teams deliver higher quality outputs, drive innovation initiatives, and maintain stronger client relationships, with many organizations finding that highly engaged workforces generate 23% higher profitability and substantially improved per-employee revenue metrics.
Focusing solely on revenue per employee presents risks including neglecting customer satisfaction, underinvesting in innovation, creating unsustainable workloads, and overlooking long-term strategic initiatives that don't immediately boost revenue. While this metric delivers valuable efficiency insights, organizations increasingly find that balanced scorecards incorporating employee wellness, customer retention, and innovation investments ultimately deliver more sustainable competitive advantage and growth.
Companies can integrate revenue per employee into strategic planning by setting multi-year productivity targets, aligning hiring strategies with revenue goals, and incorporating this metric into departmental performance frameworks. Through workforce optimization initiatives, technology investments, and skills development programs, organizations enhance operational efficiency while reducing costs, ultimately delivering sustained competitive advantage and improved profitability across business cycles.
**INPUT**: What tools and software can help businesses track and analyze revenue per employee? **OUTPUT**: Tools for tracking revenue per employee include HR analytics platforms, business intelligence software, financial dashboards, ERP systems, and workforce management solutions. These technologies streamline data collection by integrating payroll systems, sales databases, and operational metrics, with many organizations finding that automated tracking delivers enhanced workforce insights and strategic resource allocation decisions. **Word count: 54 words**
Revenue per employee significantly impacts business valuation by demonstrating operational efficiency, scalability potential, and management effectiveness to investors and stakeholders. Companies with higher ratios, particularly in technology and financial services sectors, command premium valuations while attracting top talent and investment capital, ultimately delivering competitive advantages through streamlined operations and enhanced market positioning.
Businesses can communicate revenue per employee through annual reports, investor presentations, quarterly earnings calls, stakeholder dashboards, and industry benchmarking reports. These strategic communications enhance transparency by highlighting operational efficiency, workforce productivity, and competitive positioning, with many organizations finding that regular disclosure builds investor confidence and demonstrates effective resource allocation in an increasingly performance-focused market.
-
Excellent products for quick understanding.
-
Topic best represented with attractive design.