

Root cause analysis fishbone diagram cause and effect


Try Before you Buy Download Free Sample Product
 Impress Your
 Audience
Editable
of Time


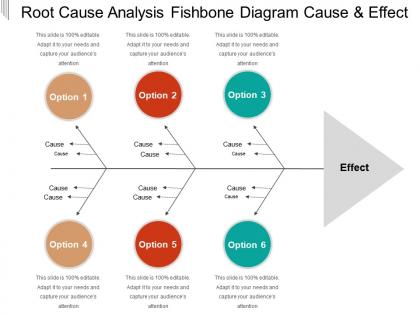
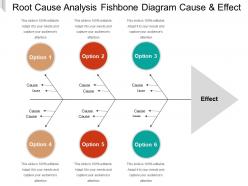
Identify the solution to the problem by employing this Root Cause Analysis Fishbone Diagram Cause And Effect template. Utilize the Ishikawa diagrams PPT slideshow to identify potential factors causing an overall effect. Cause or reason of faults and problems of a specific event can be discussed easily with the help of this ready-to-use fishbone diagram PowerPoint theme. Describe how the fishbone diagram showcases the causes that contribute to a problem. Reveal key relationships among various variables, and the possible causes with the help of root cause analysis PowerPoint theme. You can also discuss five common root cause analysis tools for effective problem-solving. Take the advantage of problem solving PPT graphic, to discuss an iterative interrogative technique that is used to explore the cause-and-effect relationships underlying a particular problem. Components of root cause analysis can also be discussed with this readily available five whys PPT layout. Discuss how the Ishikawa diagram helps to identify many possible causes for a problem and sorts ideas into useful categories. Thus, understand and communicate the problem effectively by downloading our content-ready factor analysis PPT presentation.
People who downloaded this PowerPoint presentation also viewed the following :
Root cause analysis fishbone diagram cause and effect with all 5 slides:
Befriend our Root Cause Analysis Fishbone Diagram Cause And Effect. They will stand by you through thick and thin.

FAQs for Root cause analysis fishbone diagram
So fishbone diagrams are basically for finding the real root cause of problems instead of just guessing randomly. You draw this fish skeleton thing (looks kinda dead tbh) with your problem as the head, then add potential causes as the bones branching out. What's cool is it stops your brain from fixating on obvious stuff. Forces you to consider different categories - people issues, process problems, equipment failures, environment, whatever. I've seen teams waste weeks fixing symptoms when the actual problem was something totally different. It's like detective work but organized. Try it next time you're banging your head against something stubborn.
Honestly, fishbone diagrams are great for getting everyone to actually participate. The visual setup lets people dump ideas into specific categories - like processes, equipment, whatever - so quieter team members don't get steamrolled by whoever talks the most. You know how meetings can get. Plus it stops the blame game since you're mapping out ALL possible causes instead of pointing fingers at one department. I'd suggest having different people "own" different sections of the diagram. Gets way better participation that way, and you'll catch stuff you'd totally miss otherwise. The whole thing just keeps people more focused than those rambling brainstorm sessions.
So basically it's got the "head" where you write your actual problem, then these main branches called the 6 M's - Methods, Machines, Materials, Measurements, Mother Nature, and Manpower. Yeah, those names are pretty old school but whatever works! You can totally change the categories to match your situation better. Then off each main branch, you add smaller branches for specific causes in that area. The whole thing ends up looking like a fish skeleton - hence the name, right? Just start with a clear problem statement, then brainstorm under each category. Honestly, it's great for stopping you from fixating on just one obvious cause.
So fishbone diagrams are basically visual brainstorming tools - you get that fish skeleton shape where causes branch out into categories like people, process, materials, whatever. Pretty different from other methods that are more linear. Like 5 Whys just goes straight down asking "why" over and over, which gets boring fast honestly. Fault tree analysis uses all these logic gates and gets complicated quick. The fishbone's biggest advantage? Getting your whole team thinking systematically without anyone forgetting obvious stuff. I'd use it when you want input from multiple people instead of drilling deep into one specific problem.
Manufacturing and healthcare use fishbone diagrams constantly - probably saw them most there. Automotive and aerospace companies are obsessed with them for troubleshooting. Hospitals rely on them when stuff goes sideways. Software teams throw them at debugging problems too. Food production, pharmaceuticals, chemical processing - anywhere mistakes cost serious money or hurt people, basically. My old manager was always drawing these things on whiteboards during incident reviews. Start small when you're learning them. Pick something simple that went wrong and map it out. Gets way easier once you've done a few.
First thing - get super specific about what's actually wrong. "Sales are down" won't cut it. Get your team together for brainstorming since they're the ones dealing with this mess daily. Don't let that one guy who always talks too much take over though. You know the standard buckets - People, Process, Materials, Equipment - but honestly just use whatever makes sense for your situation. Keep asking "why" for everything. Here's the thing that actually matters: prioritize based on real data, not what feels right. I learned this the hard way. Focus there first.
So basically you map out everything that could screw up your project before it actually does. Think people problems, bad processes, crappy materials, whatever. It's like imagining your project already failed and working backwards - sounds weird but it works. Categories help you brainstorm stuff you'd normally miss. My team does this at kickoff meetings now and honestly? We catch so much dumb stuff early. Way better than putting out fires later when everyone's stressed. Just get your team in a room and start listing what could go wrong.
Toyota had this paint problem that kept screwing up their cars. Instead of just blaming the workers (which honestly would've been my first instinct), they did one of those fishbone diagram things. Mapped out every possible cause - materials, machines, people, methods, the whole deal. Turns out the real culprit was humidity messing with the paint booth, not human error at all. Once they fixed the environmental stuff, problem solved. The trick is forcing yourself to look at everything systematically instead of going with your gut reaction. Way harder than it sounds though.
So basically, you put your main problem at the "head" of the fish, then draw these big bones coming off it for different categories - like people issues, process stuff, environment, whatever fits. Then smaller bones branch off those for specific causes. It's kind of like making a family tree but for everything that's going wrong lol. What I love about it is you can actually see how problems connect instead of just brainstorming random stuff. Forces everyone to think more methodically too. Honestly, once you map it all out visually, the whole mess starts making way more sense. Definitely try it next time you're stuck.
Ugh, the worst is when people make the problem way too vague from the start. Get your actual team involved - like the people who deal with this stuff every day, not just managers. Don't waste time making it look perfect (seriously, I've watched teams spend forever on colors and fonts). Dig deeper than the obvious causes too. Keep asking "why" until you hit something real. Oh and here's the thing that drives me crazy - people make these gorgeous diagrams then do nothing with them. Just pick 2-3 main issues and give someone ownership. Otherwise what's the point?
Honestly, going digital with fishbone diagrams is a game changer. Your whole team can jump in and edit stuff at the same time on Miro or Lucidchart. Way better than crowding around a whiteboard. You can drag branches around, color-code things, even link to other docs. I've been there when someone trips over a cord and kills the power - automatic saving is clutch. Canva works too if you want something super simple. Start with Draw.io since it's free, then see how your team likes it.
Honestly, your people need solid problem-solving skills first - critical thinking stuff. Root cause analysis training helps them dig past the obvious symptoms. The brainstorming gets awkward if folks won't speak up though! Good facilitation makes a huge difference since you need everyone throwing out ideas. Obviously they should know something about whatever process you're analyzing - can't diagnose what you don't understand, right? I'd do like a 30-minute intro covering why each category exists before jumping into your first session. Communication skills matter way more than people think.
Yeah, fishbone diagrams work great for creative stuff! Just swap out those boring manufacturing categories for things that actually matter in your work. Design teams I know use "inspiration sources," "deadlines," "client feedback" - way more relevant than "machines," right? Pick 4-6 categories that mess with your projects regularly. Could be "team dynamics," "technical limitations," "creative constraints" - whatever fits your process. Then just brainstorm everything under each category. Honestly, it's helped me spot problems I wouldn't have thought of otherwise.
Look, your fishbone diagram is just guesswork until you back it up with real data. You'll waste so much time chasing phantom problems otherwise - trust me on this one. Start collecting whatever you can: measurements, surveys, incident reports, observations. This stuff helps you figure out which causes are actually legit versus total dead ends. I've watched entire teams burn weeks going down the wrong rabbit hole because they skipped this part. Plus you need that baseline data to prove your fixes actually worked later. Bottom line: build your fishbone first, then go hunt for evidence.
Fishbone diagrams are clutch for Six Sigma projects, especially when you hit the Analyze phase. After you've got your data from measuring, use the fishbone to map out what's actually causing your problem - not just random guesses. Your team can dump ideas into the main buckets (people, process, materials, environment). Works way better than just sitting around throwing out theories. Once you've got everything mapped, pick the most promising "bones" and dig deeper with your statistical tools. I've seen teams waste weeks chasing symptoms instead of root causes. Give it a shot - it'll keep everyone focused instead of going down rabbit holes.
-
Topic best represented with attractive design.
-
Easily Understandable slides.