

Sales achievements powerpoint presentation slides





Try Before you Buy Download Free Sample Product
 Impress Your
 Audience
 100%
100% Editable
 Save Hours
 of Time


Showcase the current sales financial growth of your organization with the help of our content ready Sales Achievements PowerPoint Presentation Slides. You can portray the total revenue of the sales that you have accomplished by using this visually appealing list of accomplishments PowerPoint graphic. With the aid of a sales promotion presentation template, you can highlight the sales product performance dashboard of your organization. Use financial accomplishments PPT theme and discuss the overall gross profit of your product with the stakeholders. Take the assistance of the sales and revenue accomplishments PowerPoint layout to determine the frequency of payments produced by the specific product or an item. Employ sales achievements PPT visuals to outline your key deliverables and accomplished projects. Talk about various sales promotion tools with the help of this professionally designed product management and achievement PowerPoint deck. Therefore, download our ready-to-use summary of achievements presentation template to impress your stakeholders.
People who downloaded this PowerPoint presentation also viewed the following :
Content of this Powerpoint Presentation
Slide 1: This slide introduces Sales Achievements. State Your Company Name and begin.
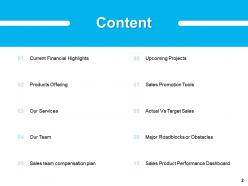
Slide 2: This slide shows Content of the presentation.
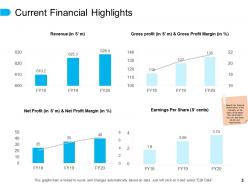
Slide 3: This slide presents Current Financial Highlights with the help of bar graphs.
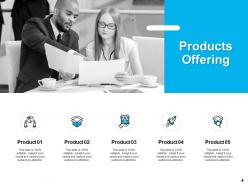
Slide 4: This slide displays Products Offering with related diagram and icons.
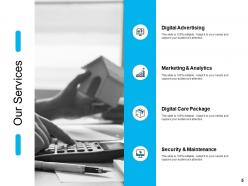
Slide 5: This slide showcases Our Services describing- Digital Advertising, Marketing & Analytics, Digital Care Package, Security & Maintenance.
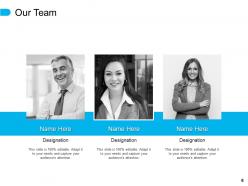
Slide 6: This is Our Team slide with names and designation.
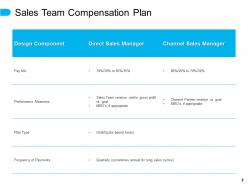
Slide 7: This slide shows Sales Team Compensation Plan in tabular form with categories as- Design component, Direct Sales Manager and Channel Sales Manager.
Slide 8: This slide presents Upcoming Projects with related imagery.
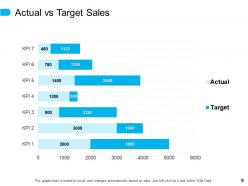
Slide 9: This slide displays Actual Vs Target Sales in graphical form.
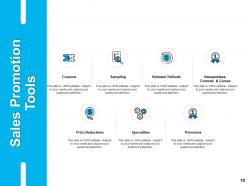
Slide 10: This slide represents Sales Promotion Tools describing- Premiums, Coupons, Rebates/ Refunds, Specialties, Sweepstakes, Contests & Games, Sampling, Price Reductions.
Slide 11: This slide showcases Major Roadblocks or Obstacles. You can add or edit text as per requirements.
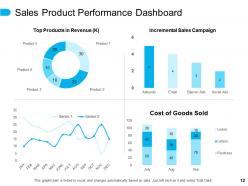
Slide 12: This slide shows Sales Product Performance Dashboard with the help of graphs.
Slide 13: This slide displays Sales Achievements Icons.
Slide 14: This slide is titled as Additional Slides for moving forward.
Slide 15: This is About Us slide to show company specifications etc.
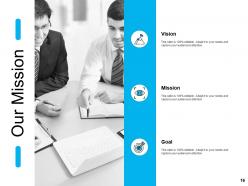
Slide 16: This is Our Mission slide with related imagery and text.
Slide 17: This is a Comparison slide to state comparison between commodities, entities etc.
Slide 18: This is a Financial slide. Show your finance related stuff here.
Slide 19: This is a Puzzle slide with text boxes to show information.
Slide 20: This is a Target slide. State your targets here.
Slide 21: This is an Idea Generation slide to state a new idea or highlight information, specifications etc.
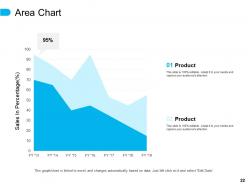
Slide 22: This slide shows Area Chart with two products comparison.
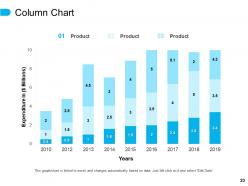
Slide 23: This slide displays Column Chart with three products comparison.
Slide 24: This is a Thank You slide with address, contact numbers and email address.
Sales achievements powerpoint presentation slides with all 24 slides:
Use our Sales Achievements Powerpoint Presentation Slides to effectively help you save your valuable time. They are readymade to fit into any presentation structure.






FAQs for Sales achievements
Track revenue and deal count first - those are your bread and butter. But honestly, most sales teams stop there and wonder why they're flying blind. You'll also want conversion rates, deal size, and how long your sales cycle actually takes. Pipeline velocity is clutch too since it shows how fast stuff moves through your funnel. Oh, and don't sleep on customer acquisition cost. Pick maybe 4-5 metrics that actually matter to your goals instead of drowning in data. Trust me, tracking everything just creates noise.
Honestly, templates are lifesavers when you're presenting sales numbers. Instead of just throwing data at people, they help you tell an actual story - start with the problem, show what you've done, then boom, here's what worked. The good ones have spaces built in for context too, not just endless charts. I used to waste so much time staring at blank slides! Now I just grab a template that flows like how I'd naturally explain things. Consistent formatting means people actually follow along instead of getting confused by random colors and fonts everywhere. Game changer.
Dude, the right tech makes such a huge difference when you're showing off your sales wins. Instead of those crappy static slides we all hate, you can pull live data from your CRM and make actually interesting charts that tell the whole story. Interactive presentations are where it's at - let people click around and explore the numbers themselves. I've been using Tableau lately and honestly it's a game changer. HubSpot's reporting is solid too, or you could just do screen recordings of your actual sales process. Pick whatever connects to your current setup and just mess around with it before your next big presentation. Trust me on this one.
Dude, visuals are game-changers for this stuff. Nobody wants to sit through you rattling off a bunch of percentages - their eyes just glaze over. But throw up a chart showing that dramatic upward trend? Now you've got their attention. Before/after comparisons work great too, or those milestone timelines that actually make your wins feel real instead of just random numbers floating around. I always go for visuals that scream "look how awesome this turned out" without making people do math in their heads. Trust me, pick the ones that highlight your biggest successes and make the impact super obvious right away.
Dude, lead with your biggest wins right away - people zone out so fast in these things. I usually go chronological or group stuff by category (revenue, clients, team size), whatever makes the most sense. Oh and throw in one stat that'll make them do a double-take because honestly that's what keeps people awake. Charts beat bullet points every time for your main numbers. Give some quick context so they get how you pulled it off, but don't go crazy with details. Wrap up by mentioning next quarter's goals - shows you're not just coasting on past wins, you know?
Don't just celebrate numbers - show how your wins actually moved the business forward. Map each achievement to what the company needed. Like that 30% revenue bump? Explain how it funded the product launch or whatever. I hate when people just dump charts with zero context, honestly. Be specific: "This $2M deal secured our Q4 cash flow AND let us expand marketing." Connect your future targets to what's coming up too. You want them seeing you as someone who gets the bigger picture, not just someone who hits quotas.
Don't just present to them - get them involved. Hit them with a shocking stat or story right off the bat. Charts and visuals are your friend because text-heavy slides are basically torture. I always throw in questions like "What do you think caused this spike?" It keeps people awake and actually gets their brains working. Here's the thing though - they care way more about business impact than your fancy metrics. Connect everything back to what keeps them up at night. Oh, and don't forget concrete next steps at the end or nothing will happen afterward.
Definitely put those testimonials everywhere - your website, sales decks, email signatures, all of it. Video ones are gold because prospects can actually see real people talking about their results. Way more believable than just text quotes. Honestly, I'd skip the generic "great service!" comments and focus on testimonials that match your prospects' specific problems. Case studies with actual numbers work great too. Oh, and make sure your sales team knows they can share these freely during calls. The whole point is helping prospects picture themselves getting the same results your current customers are bragging about.
Oh totally! Thermometers for quota stuff are pretty cool, and speedometers work great for performance tracking. I'm weirdly obsessed with funnel charts for pipeline data - they just click visually, you know? Heat maps are solid for territory performance. You can throw in industry icons too, like dollar signs or whatever fits. Timeline charts show momentum nicely across quarters. Honestly, pick your biggest metric first and find a visual that actually tells the story. Then just build out from there. Way better than boring bar charts everywhere.
Definitely normalize everything first - percentages or quota performance work way better than raw numbers since markets are totally different sizes. Side-by-side charts showing quota attainment and growth rates are your friend here. Context matters though. Like, 50% growth in some tiny market isn't the same as 10% in a huge one, obviously. Keep your time periods consistent and maybe drop in quick notes about regional stuff that impacted things. Oh, and don't go overboard - pick maybe 2-3 solid metrics, standardize them, then let the visuals do the talking. Nobody wants to wade through spreadsheet chaos.
Honestly, the worst thing you can do is throw random numbers at them without explaining what they actually mean. Like saying you hit 120% of quota - so what? What did that do for the company? Also don't take credit for stuff that wasn't really you. Market was hot and everyone crushed it? Say that. Your whole team killed it? Give them props too. Skip the boring "exceeded expectations" garbage - nobody cares about vague stuff like that. Tell them exactly what changed because of what you did. Start with how you helped the business, then prove it with numbers. Way more convincing that way.
Oh yeah, definitely break it down by product - you're gonna miss so much otherwise. High performers will hide your duds, and you won't catch where things are actually going wrong. Different products have totally different cycles and margins anyway, so what works for one could completely fail for another. We almost got burned on this once because our software was doing great but hardware was quietly dying (thankfully caught it in time). Honestly, just grab last quarter's numbers and split them by your main categories. You'll see patterns pop up right away.
Dude, numbers just don't stick in people's heads the way stories do. Like, you can rattle off percentages all day but everyone's gonna zone out. Instead, turn your biggest win into a mini story - walk them through how you spotted the client's problem, dealt with their pushback, closed the deal. People actually follow along when there's a journey to it. Honestly, I've seen way too many sales presentations that are just revenue figures on slides. Boring as hell. Your audience needs to feel the "how" behind your success, not just hear the final number. Stories create that emotional hook that makes your wins memorable.
Look, your past wins are basically your best selling tool for future plans. Pull up those Q3 numbers where social media boosted leads by 30% - boom, that's your proof you can handle expanding digital channels next year. Don't just list achievements like trophies though. Connect each win to what's coming next with clear "we crushed X, so now we're ready for Y" logic. I always think of it like building blocks, you know? Each success sets you up for the bigger move. End every achievement by flipping it forward to your next strategy.
Get feedback right after your presentations - send quick surveys asking what clicked and what didn't make sense. I always grab my manager for a casual chat too since those conversations usually give you the best insights. Honestly, the formal surveys are fine but sometimes people are more honest in person. Follow up with meetings about how your wins connect to future plans. Don't make the feedback thing feel like extra work though - that's when people stop participating. Pick one approach that fits your team's vibe and go from there.
-
Appreciate the research and its presentable format.
-
I discovered this website through a google search, the services matched my needs perfectly and the pricing was very reasonable. I was thrilled with the product and the customer service. I will definitely use their slides again for my presentations and recommend them to other colleagues.
-
Great quality product.
-
Professional and unique presentations.
-
Best way of representation of the topic.
-
Great quality slides in rapid time.
-
Excellent template with unique design.
-
Awesomely designed templates, Easy to understand.