Sustainability And Environmental Management Powerpoint Presentation Slides
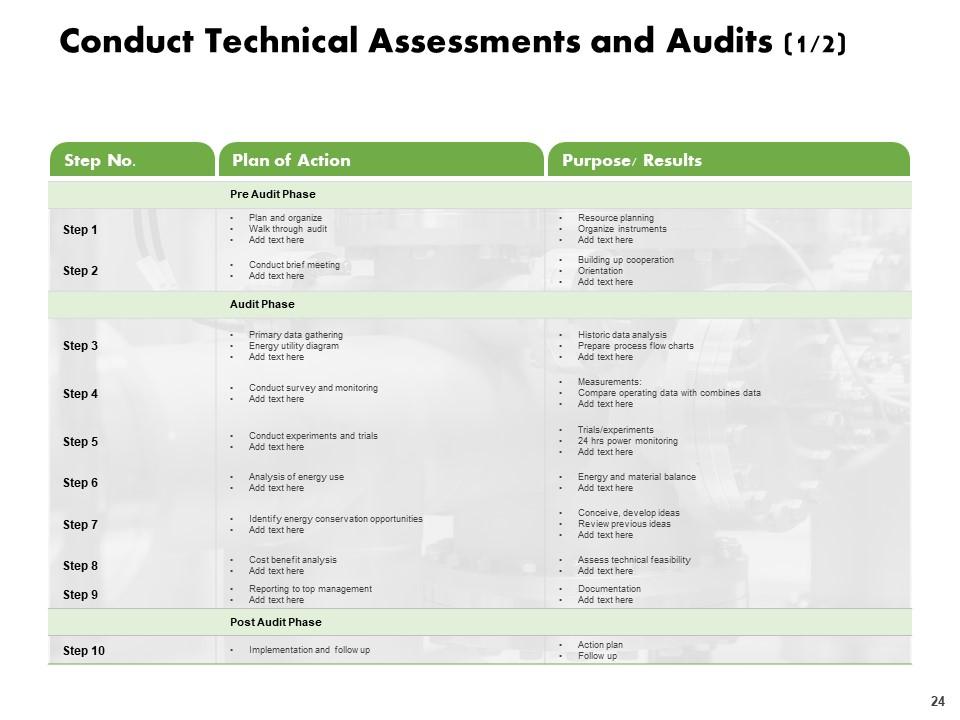
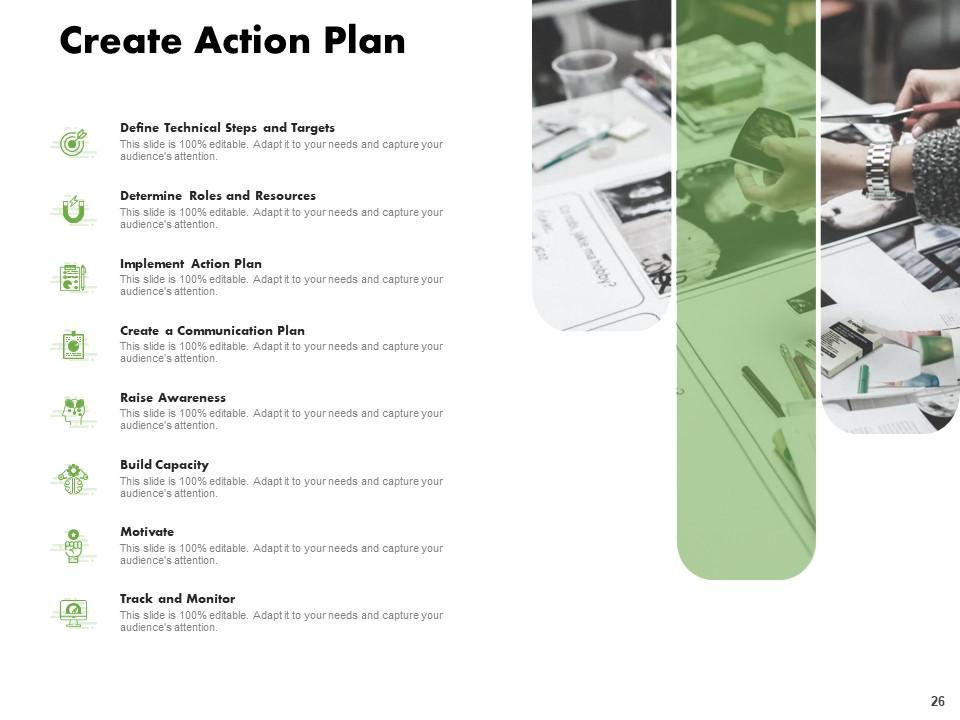
Encourage the saving of natural resources using the content ready Sustainability and Environmental Management PowerPoint Presentation Slides. Take the assistance of these sustainable development PPT templates to create effective communication as well as action plans for conserving energy. Take advantage of the environmental development PPT slides to reveal the energy conservation projects undertaken by your organization. Moreover, you can also depict the action plan for energy conservation that constitutes resource determination, implementation of the action plan, etc. Utilize the professionally designed sustainability development PowerPoint visuals to estimate the potential for improvement. Unveil the phases of technical assessments such as the pre-audit phase, audit phase, and post-audit phase. Raise awareness about sustainable development among the masses through various methods like seminars, workshops, etc. Download our visually appealing sustainable development PPT deck to make your organization environmentally responsible.
- Google Slides is a new FREE Presentation software from Google.
- All our content is 100% compatible with Google Slides.
- Just download our designs, and upload them to Google Slides and they will work automatically.
- Amaze your audience with SlideTeam and Google Slides.
-
Want Changes to This PPT Slide? Check out our Presentation Design Services
- WideScreen Aspect ratio is becoming a very popular format. When you download this product, the downloaded ZIP will contain this product in both standard and widescreen format.
-

- Some older products that we have may only be in standard format, but they can easily be converted to widescreen.
- To do this, please open the SlideTeam product in Powerpoint, and go to
- Design ( On the top bar) -> Page Setup -> and select "On-screen Show (16:9)” in the drop down for "Slides Sized for".
- The slide or theme will change to widescreen, and all graphics will adjust automatically. You can similarly convert our content to any other desired screen aspect ratio.
Compatible With Google Slides

Get This In WideScreen
You must be logged in to download this presentation.
PowerPoint presentation slides
Presenting Sustainability and Environmental Management PowerPoint Presentation Slides. This PPT deck comprises sixty-four fully customizable slides. These templates also support the standard and widescreen sizes. Modify the color, text, and font size of these templates. This PPT slideshow is also compatible with Google Slides. Convert these slides into many images or document formats like JPEG or PDF.
People who downloaded this PowerPoint presentation also viewed the following :
Content of this Powerpoint Presentation
Slide 1: This slide introduces Sustainability and Environmental Management. State your company name and begin.
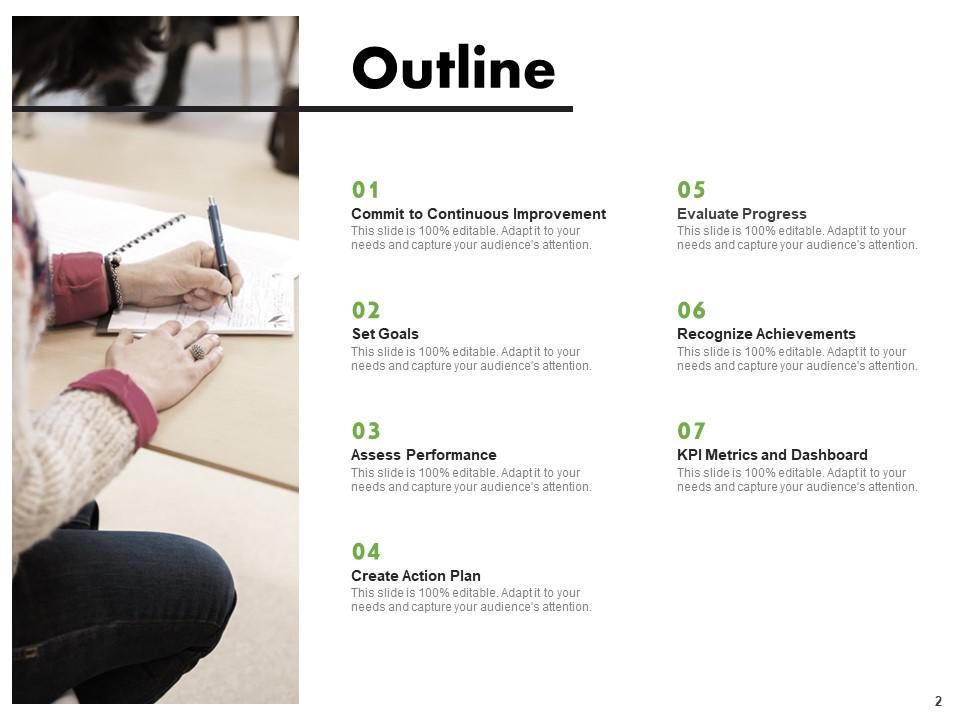
Slide 2: This slide displays the Outline of the presentation.
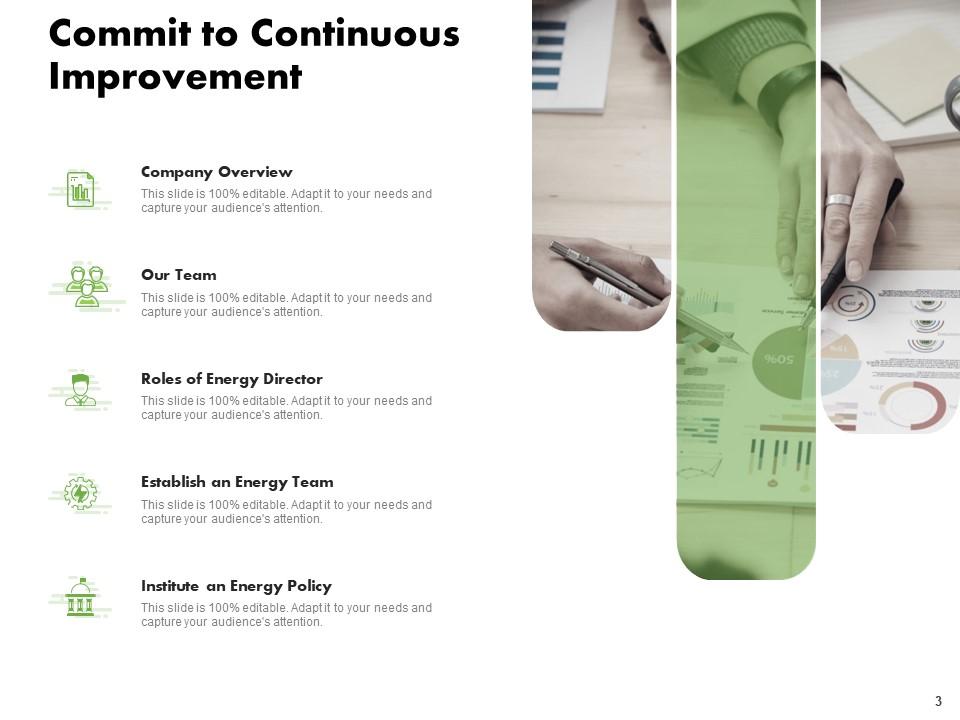
Slide 3: This slide displays Commit to continuous improvement.
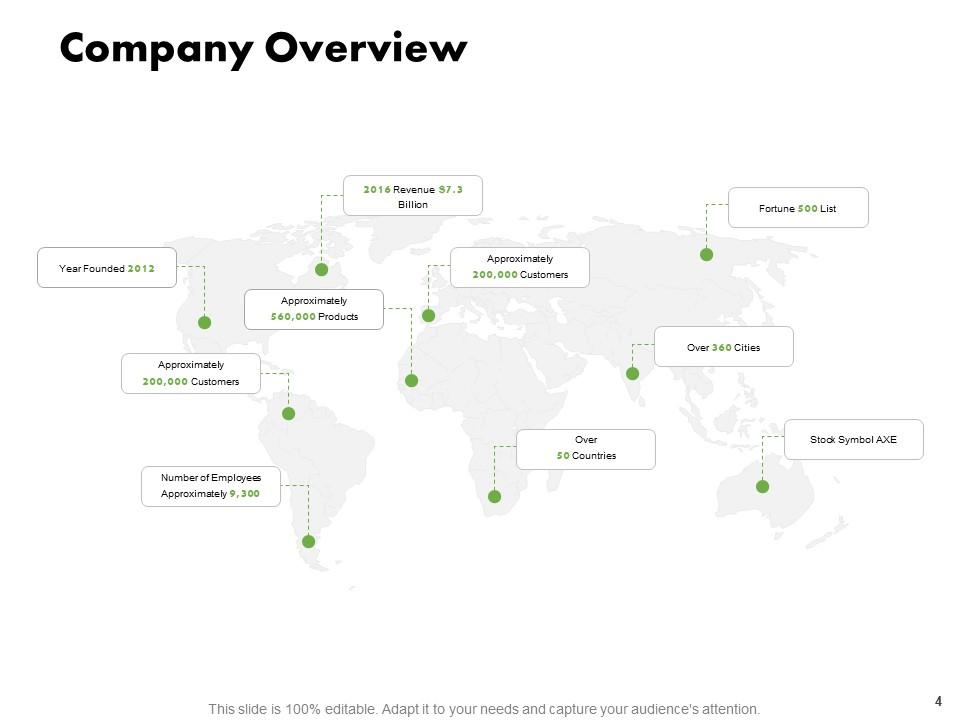
Slide 4: This slide displays Company Overview.
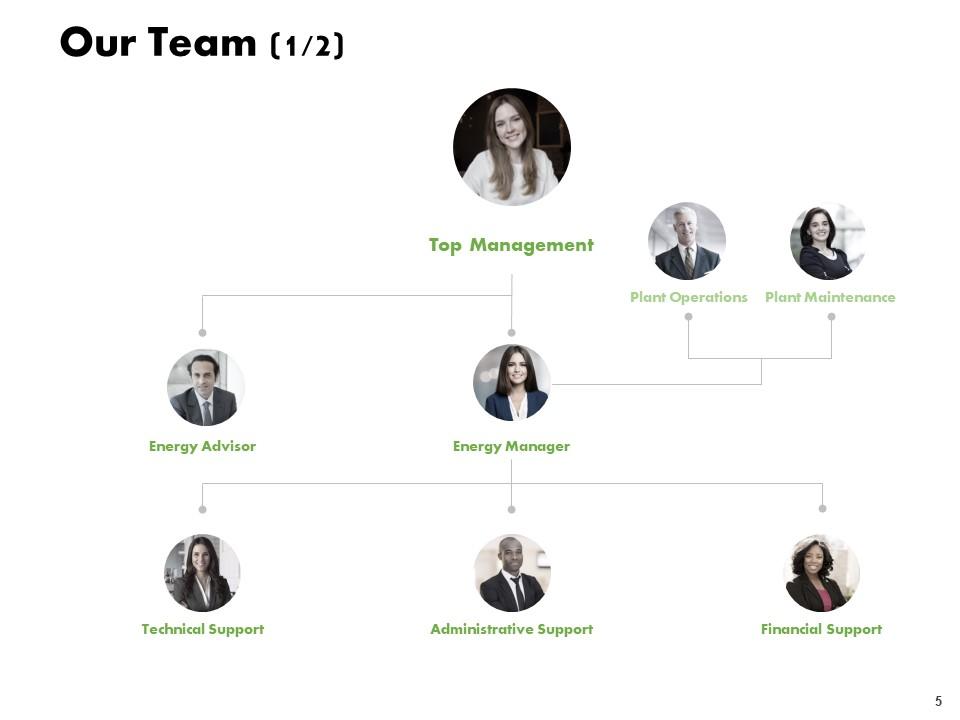
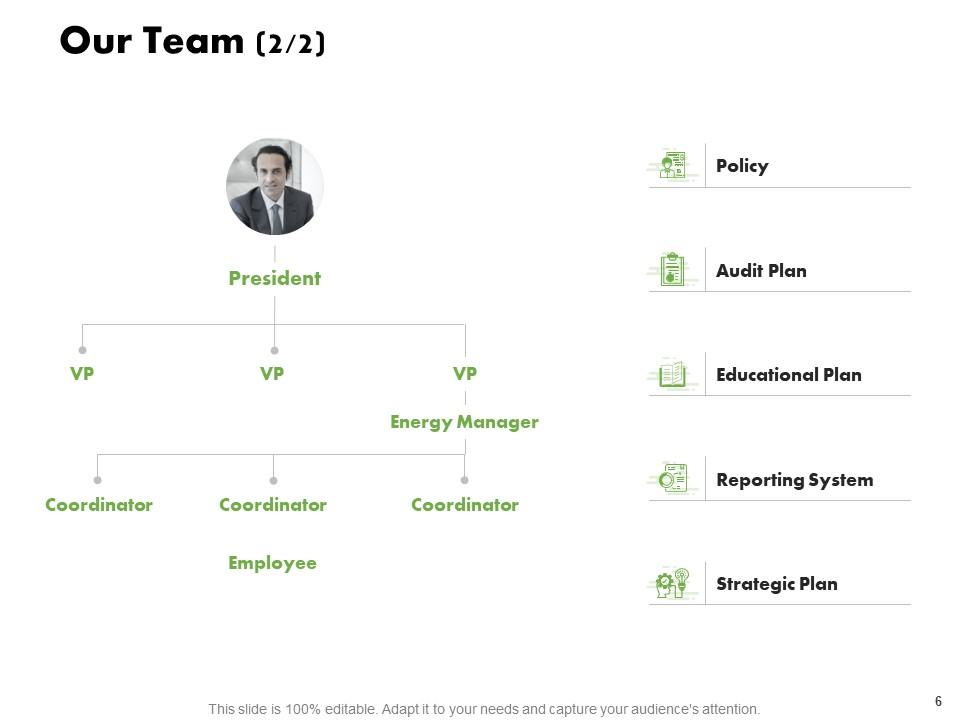
Slide 5: This is Our Team slide with names and designation.
Slide 6: This is also Our Team slide.
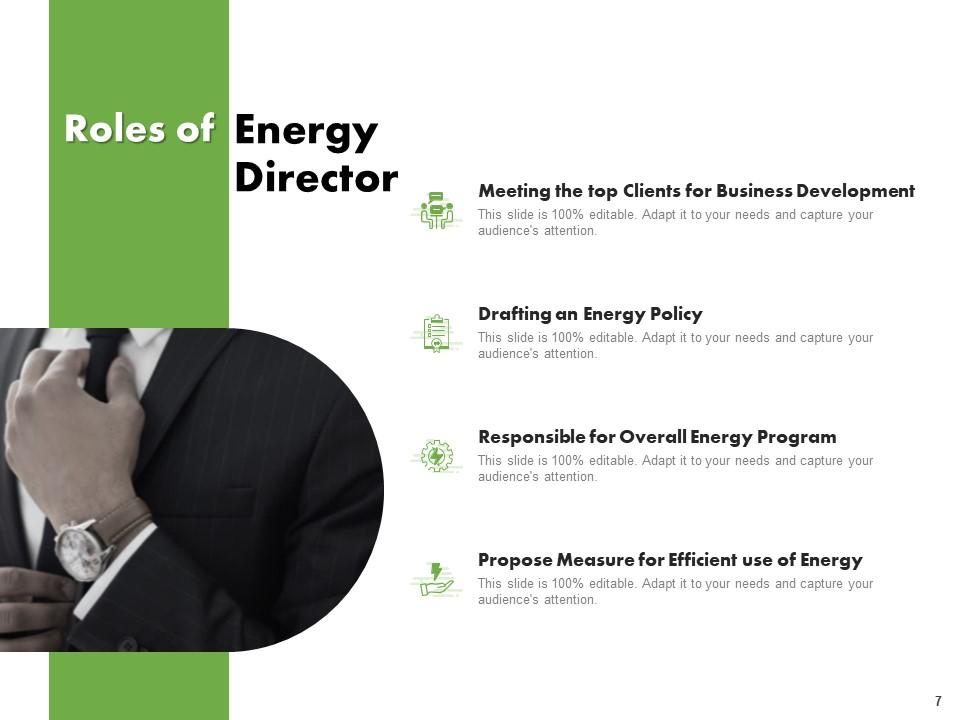
Slide 7: This slide showcases the Roles of Energy Director.
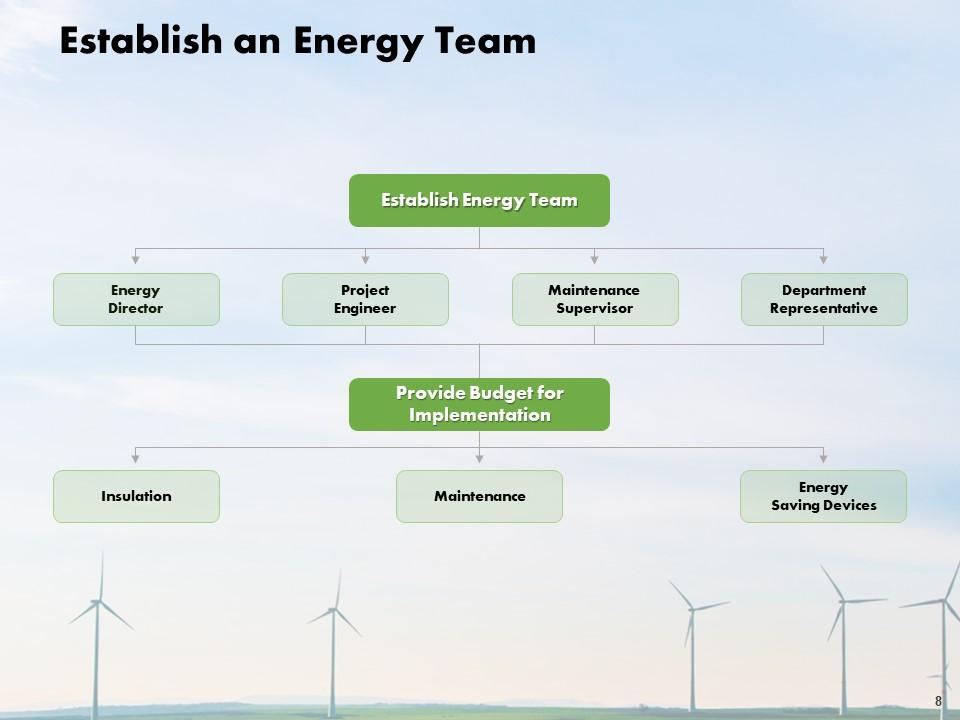
Slide 8: This slide displays Establishing an Energy Team.
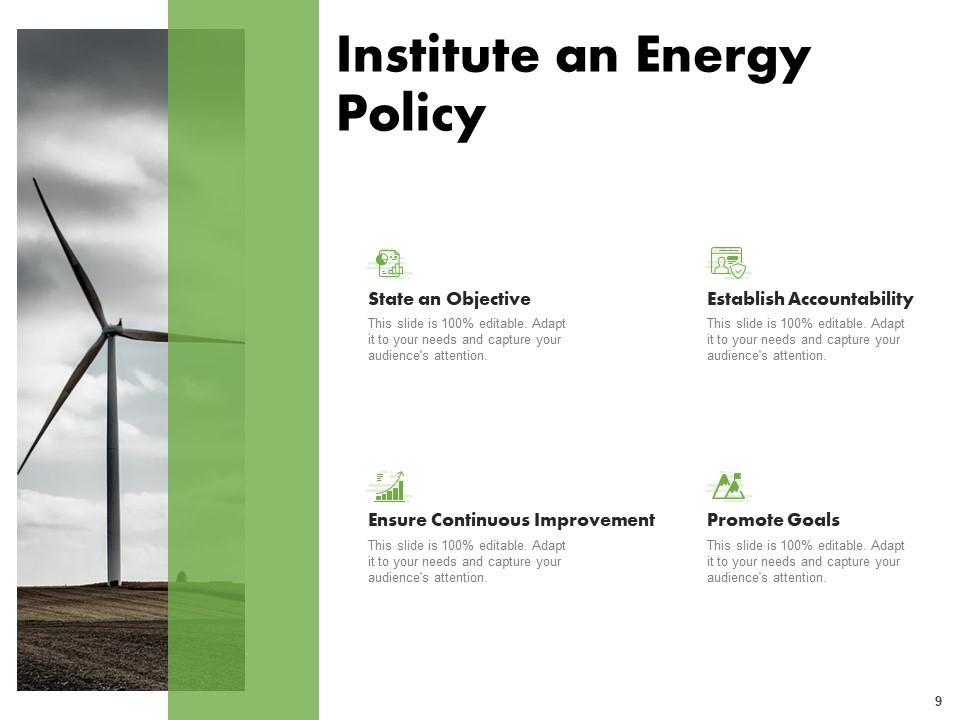
Slide 9: This is Institute an Energy Policy slide such as- State an Objective, Establish Accountability, Ensure Continuous Improvement, Promote Goals.
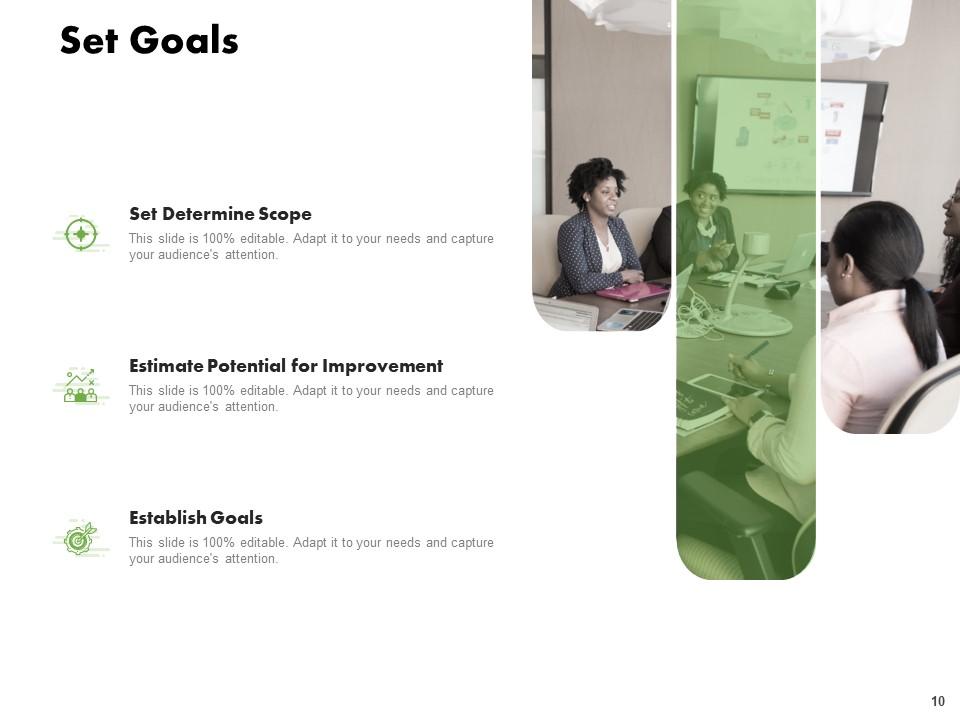
Slide 10: This slide is about Setting Goals.
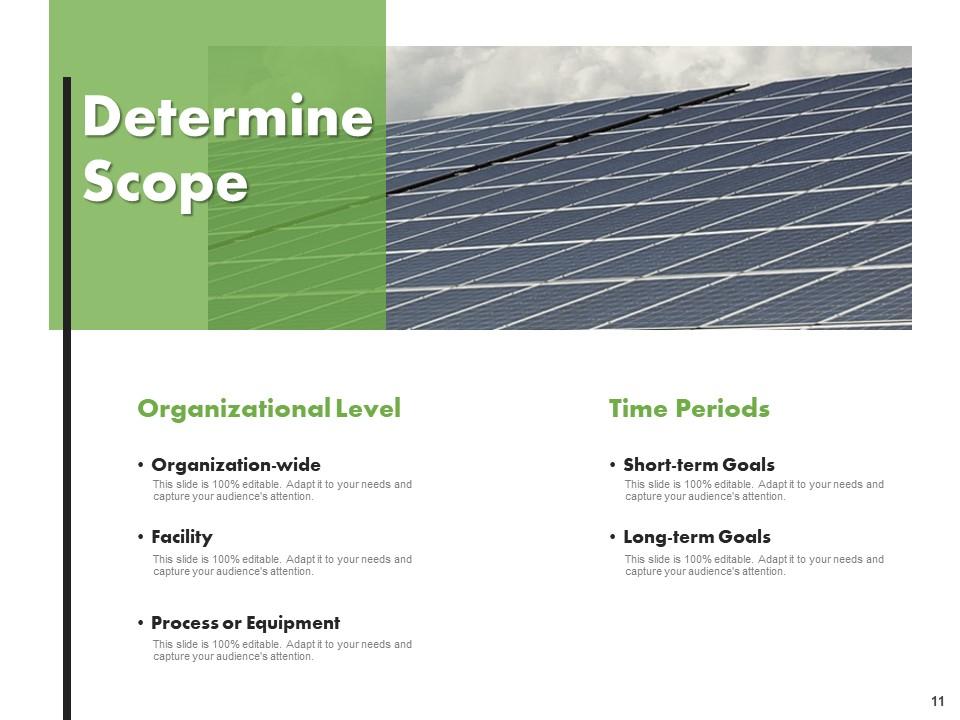
Slide 11: This is Determine Scope slide displaying- Organization-wide, Facility, Process or Equipment, Organizational Level, Short-Term Goals, Long-Term Goals, Time Periods.
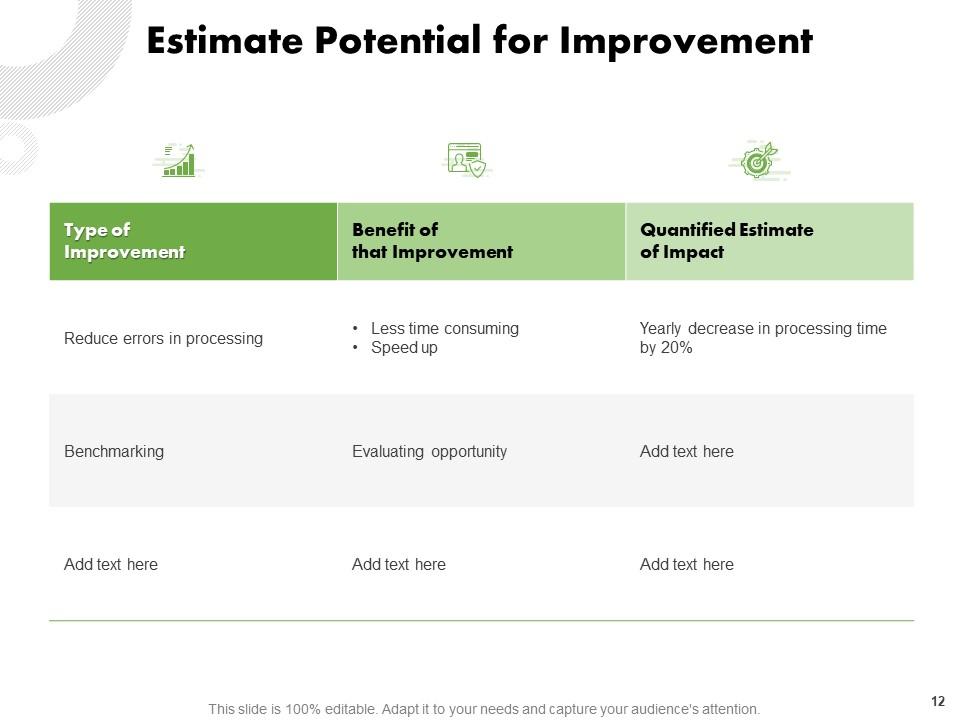
Slide 12: This slide depicts Estimate Potential for Improvement.
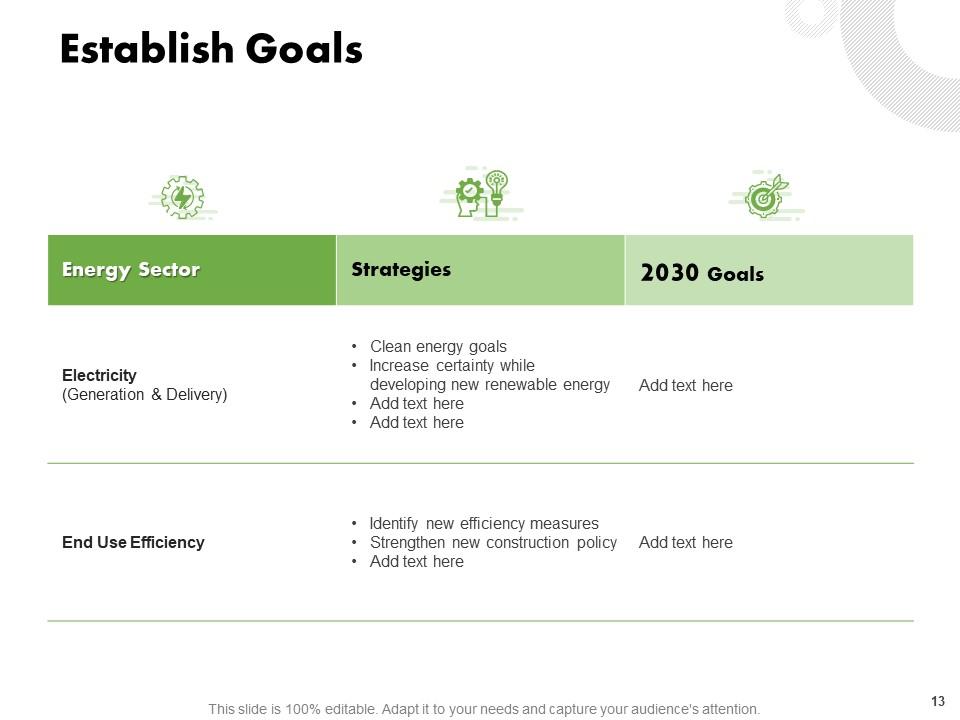
Slide 13: This is Establish Goals slide.
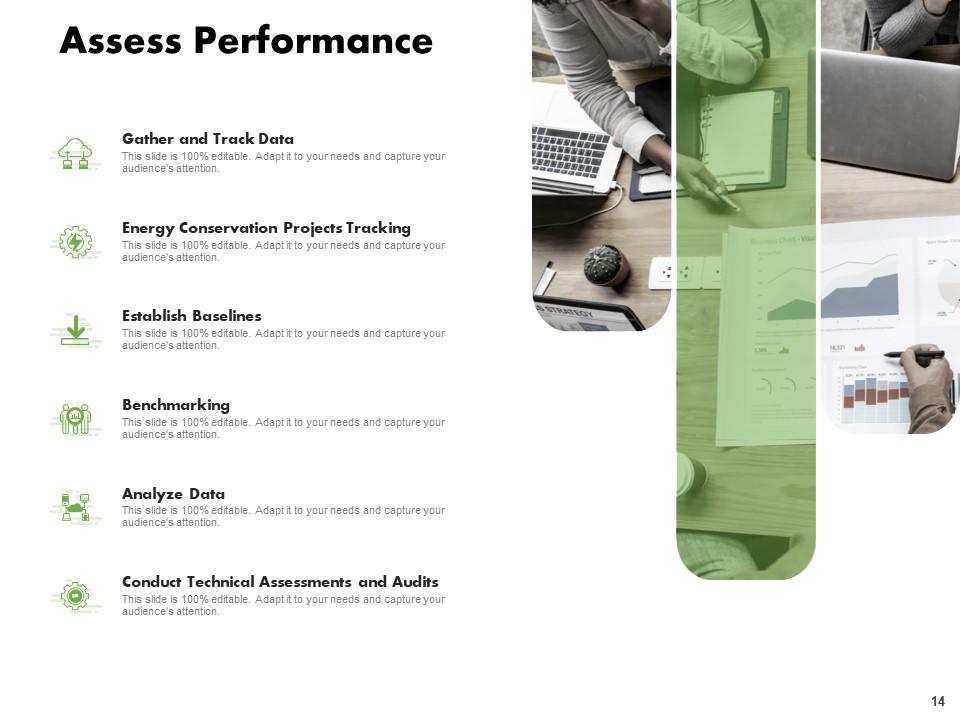
Slide 14: This slide displays assess performance.
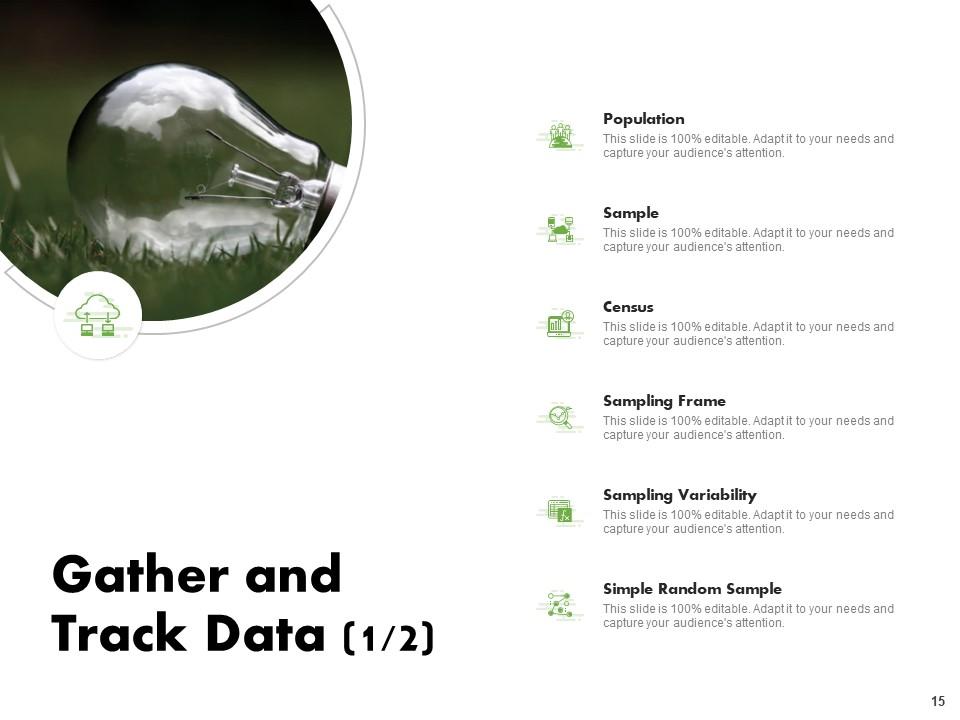
Slide 15: This slide showcases Gather and Track Data with- Sample, Population, Census, Sampling Frame, Simple Random Sample, Sampling Variability.
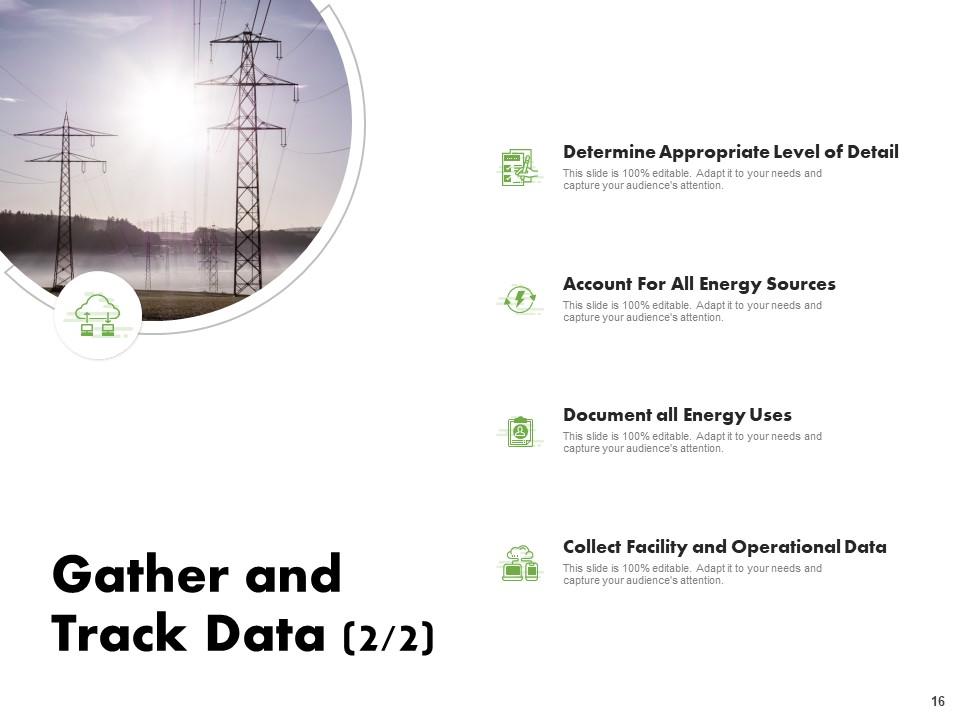
Slide 16: This slide depicts Gather and Track Data with- Determine Appropriate Level of Detail, Account for all Energy Sources, Document all Energy Uses, Collect Facility & Operational Data.
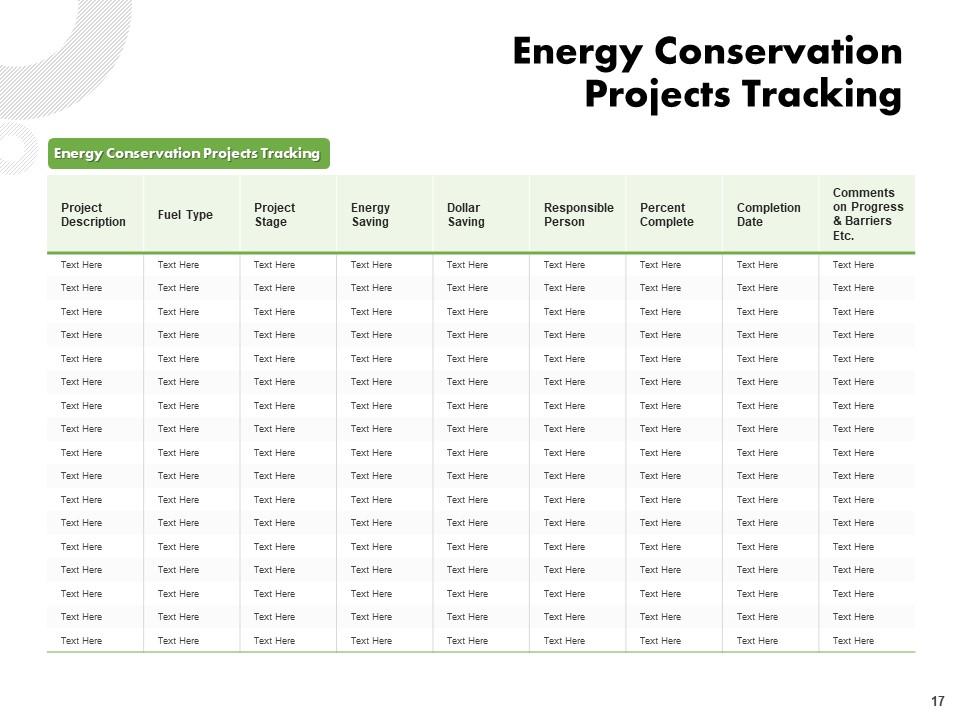
Slide 17: This slide displays Energy Conservation Projects Tracking.
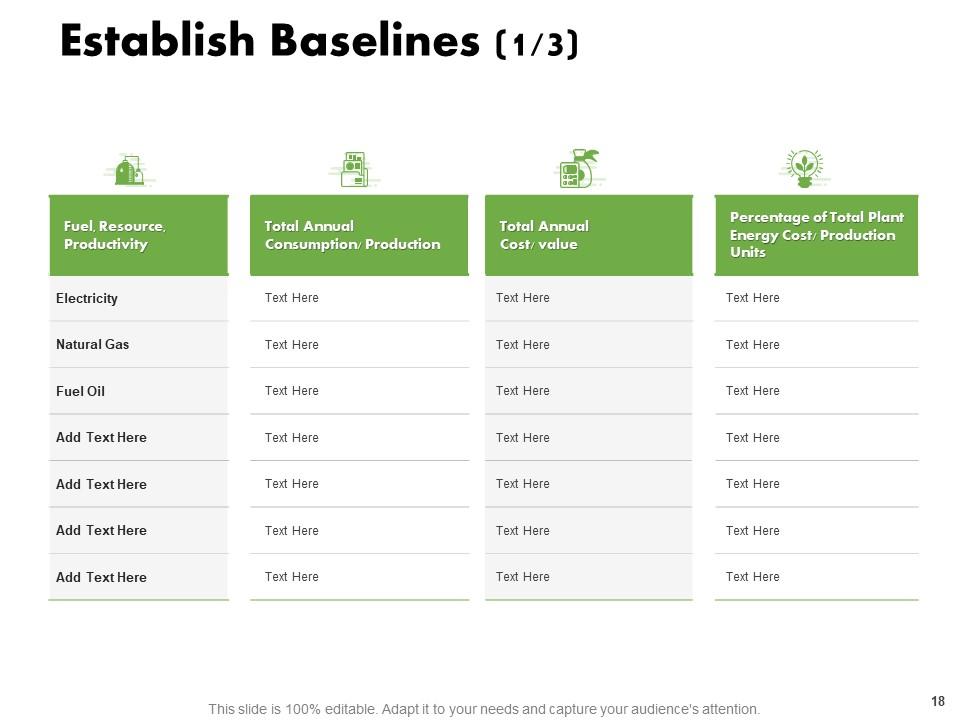
Slide 18: This is Establish Baselines slide.
Slide 19: This is Establish Baselines slide.
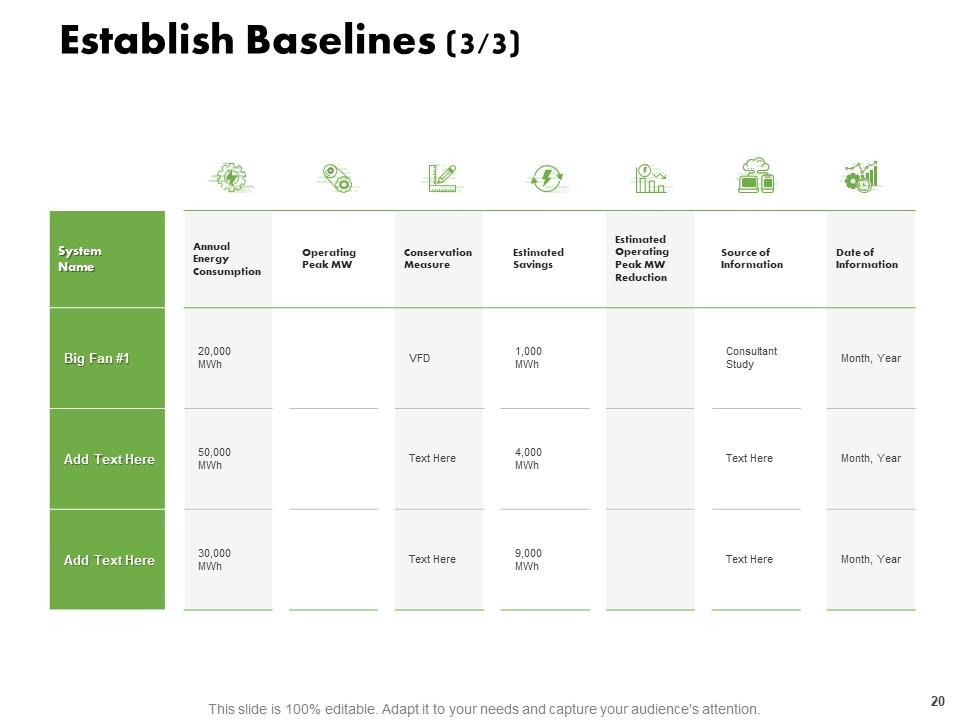
Slide 20: This is also Establish Baselines slide.
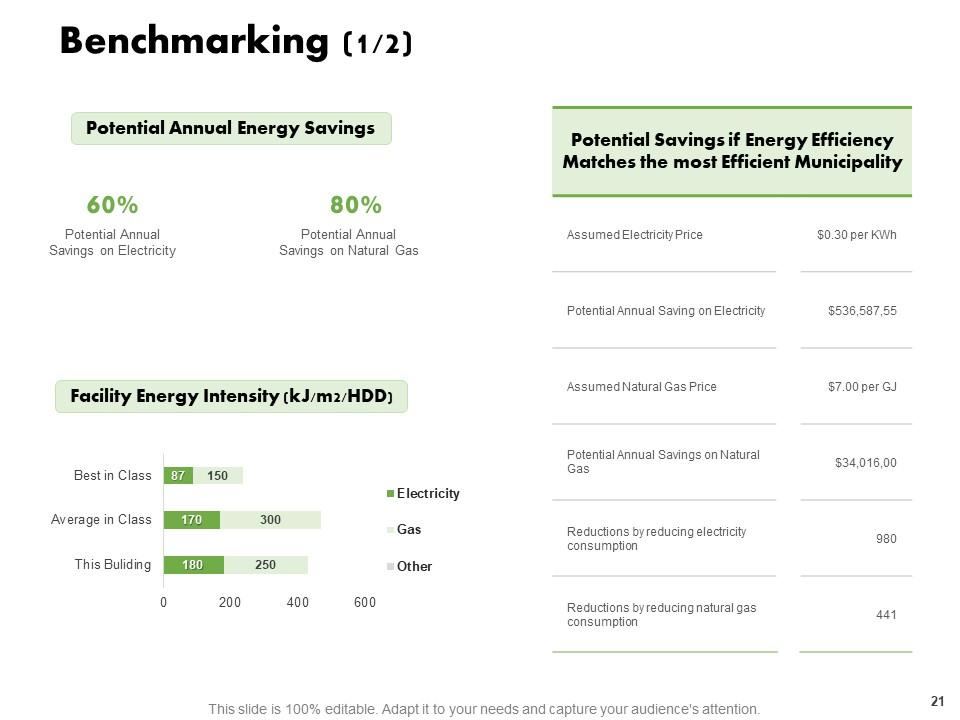
Slide 21: This slide showcases Benchmarking with- Potential Annual Savings on Electricity, Potential Annual Savings on Natural Gas, Potential Annual Energy Savings, Facility Energy Intensity.
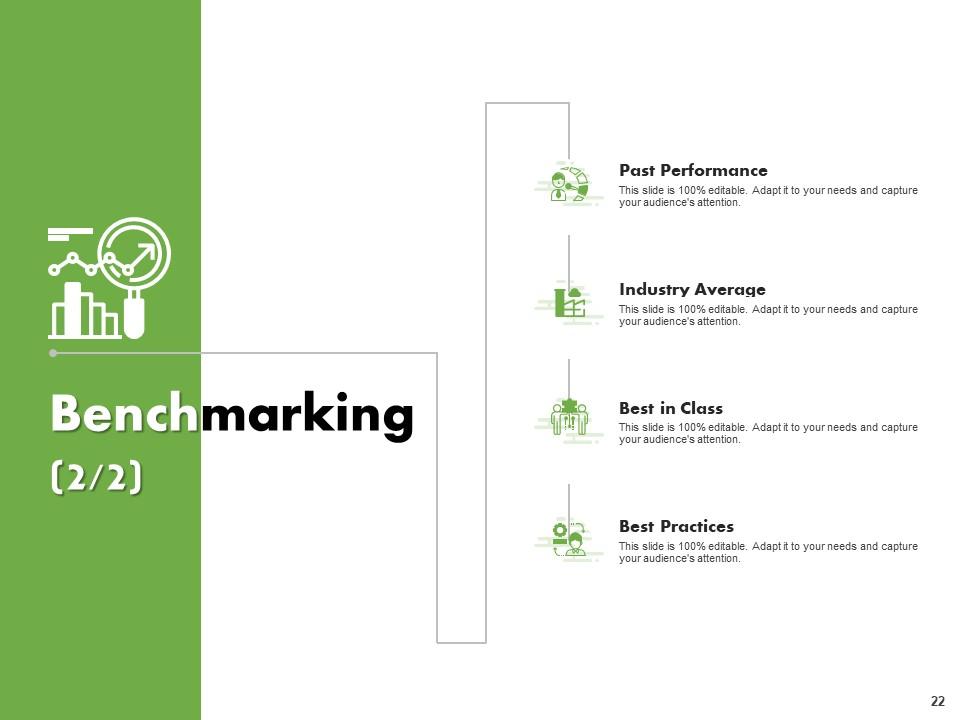
Slide 22: This slide displays Benchmarking showcasing- Past Performance, Industry Average, Best in Class, Best Practices.
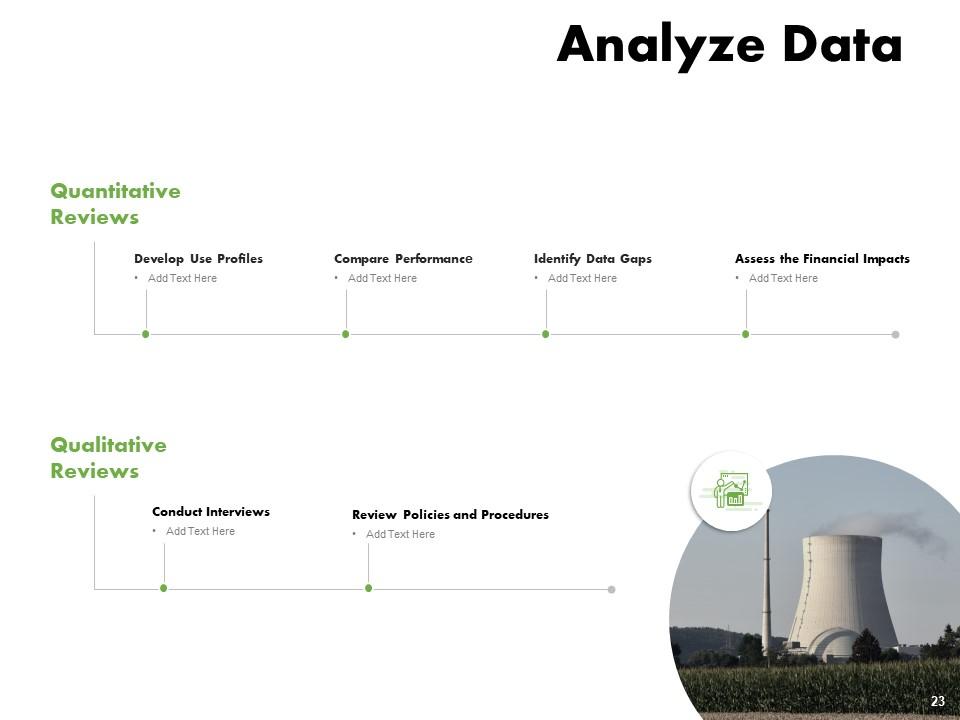
Slide 23: This slide depicts analyze data.
Slide 24: This is Conduct Technical Assessments and Audits slide.
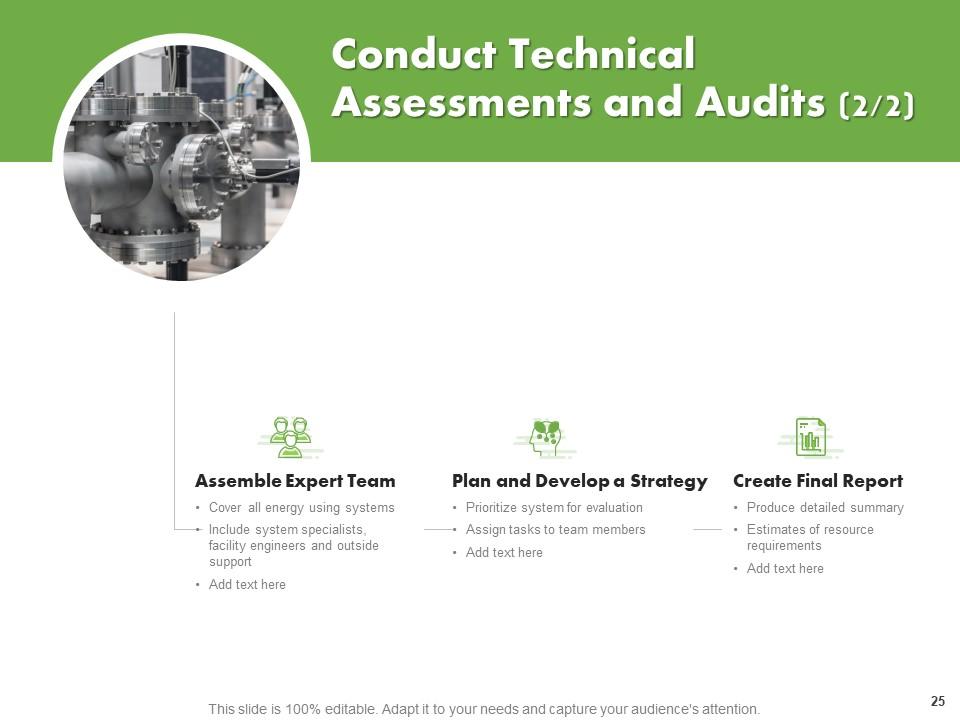
Slide 25: This is also Conduct Technical Assessments and Audits slide.
Slide 26: This slide displays Track and Monitor
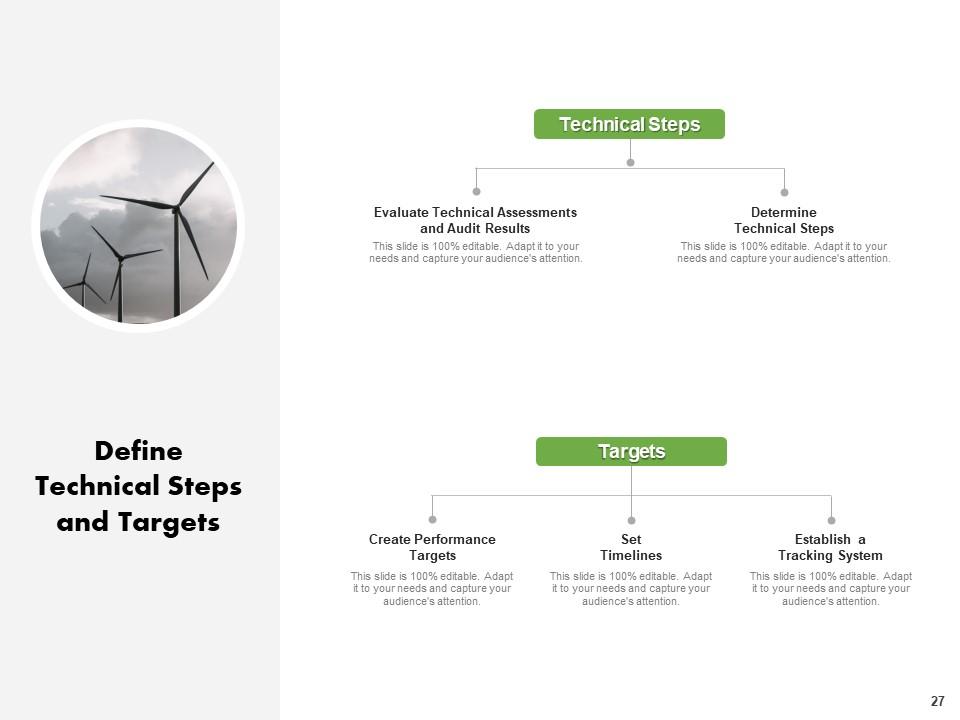
Slide 27: This slide is about Defining Technical Steps and Targets with- Technical Steps, Evaluate Technical Assessments and Audit Results, Determine Technical Steps, Create Performance Targets.
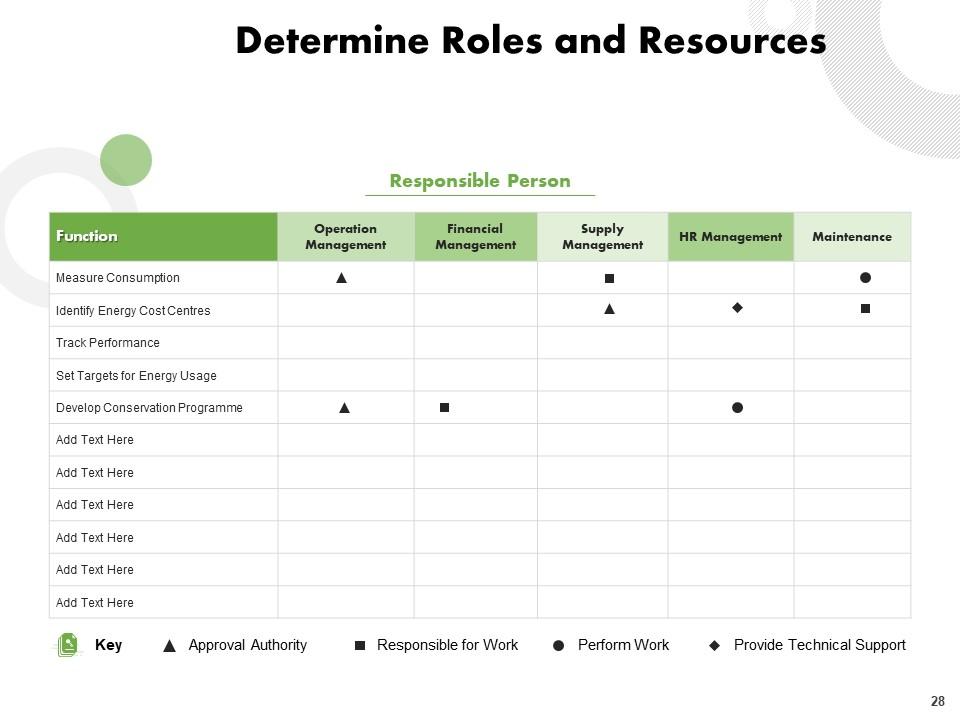
Slide 28: This slide showcases Roles and Resources describing- Responsible Person, Responsible for Work, Approval Authority, Perform Work, Provide Technical Support.
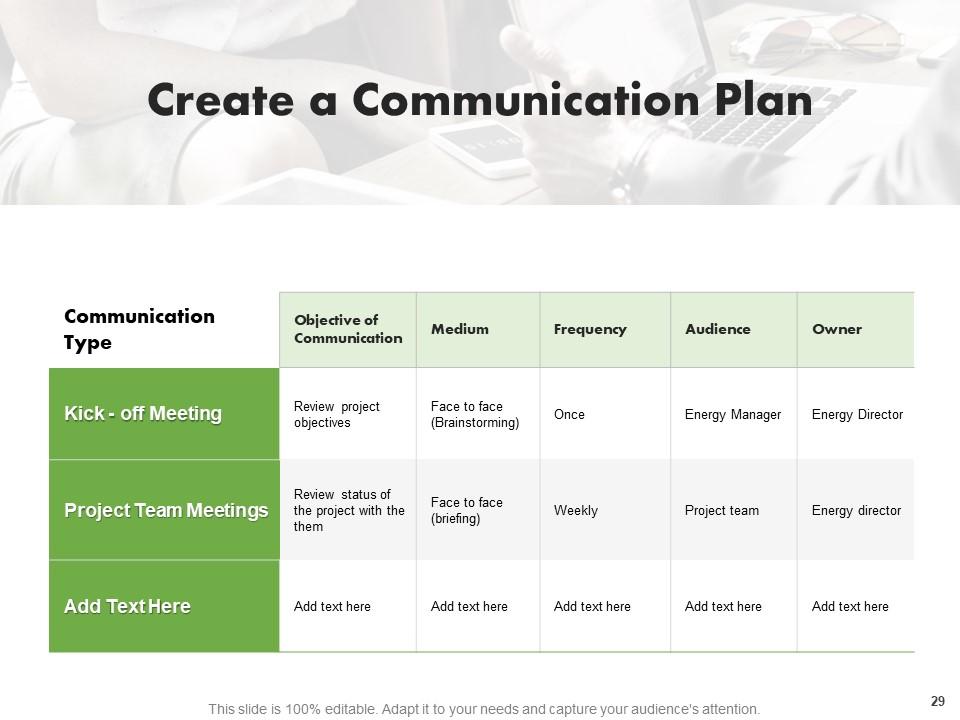
Slide 29: This is Create a Communication Plan slide.
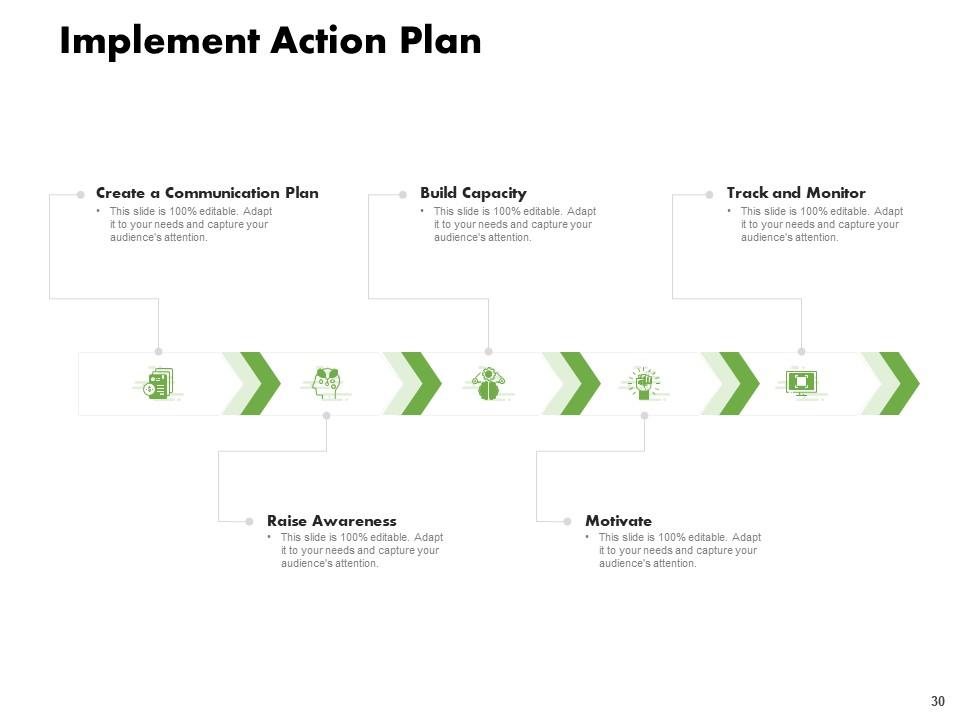
Slide 30: This slide displays implement action plan with- Create a Communication Plan, Raise Awareness, Build Capacity, Motivate.
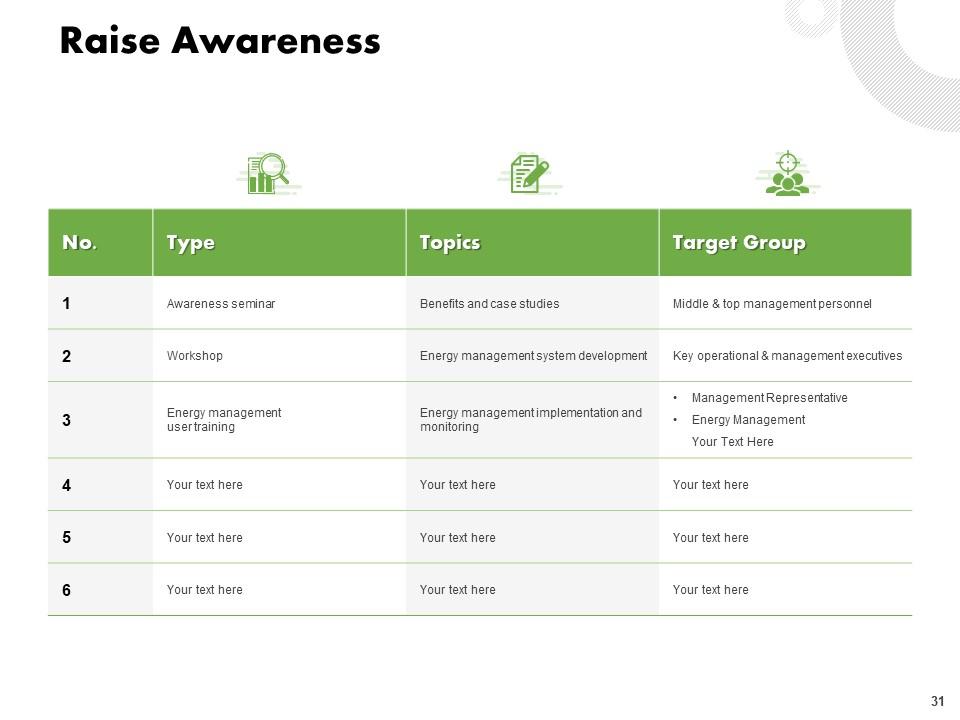
Slide 31: This is Raise Awareness slide.
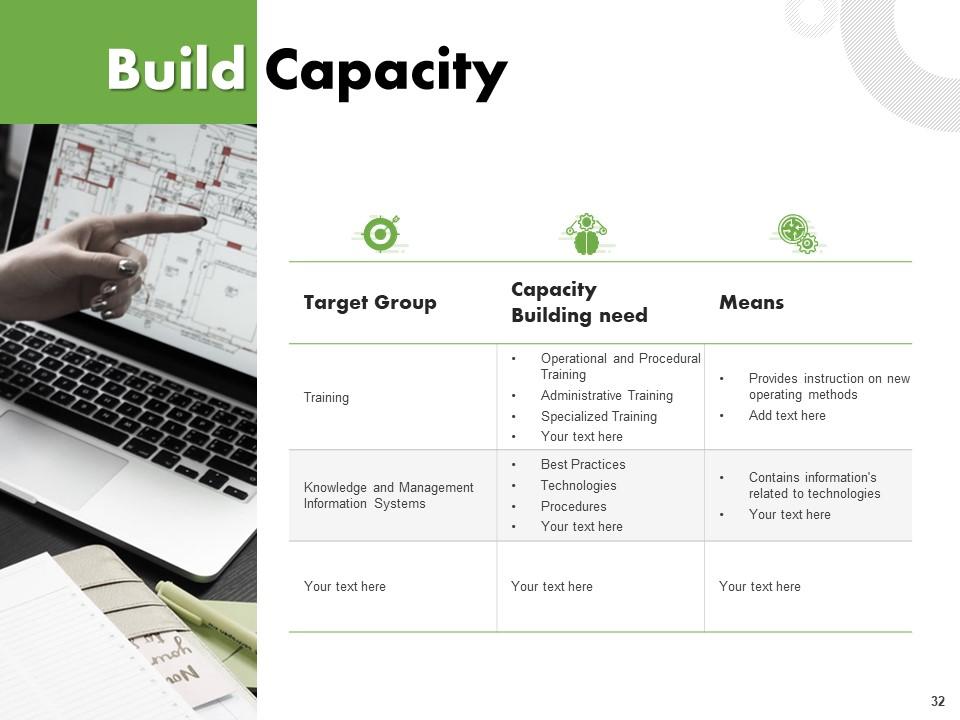
Slide 32: This slide showcases Build Capacity.
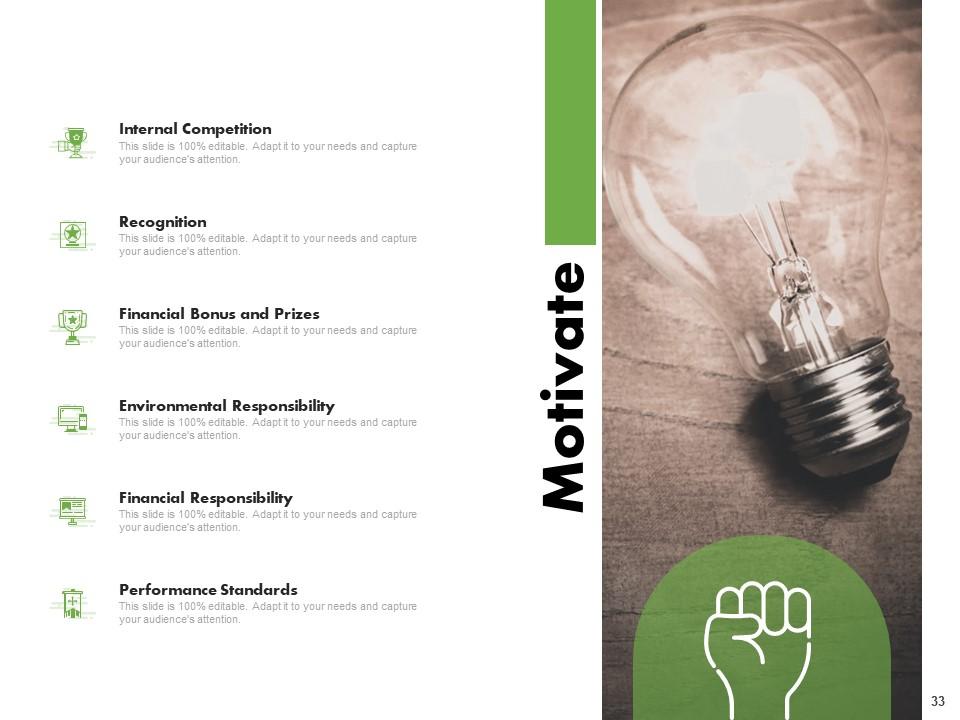
Slide 33: This is motivate slide describing internal competition, recoginition, financial bonus and prizes etc.
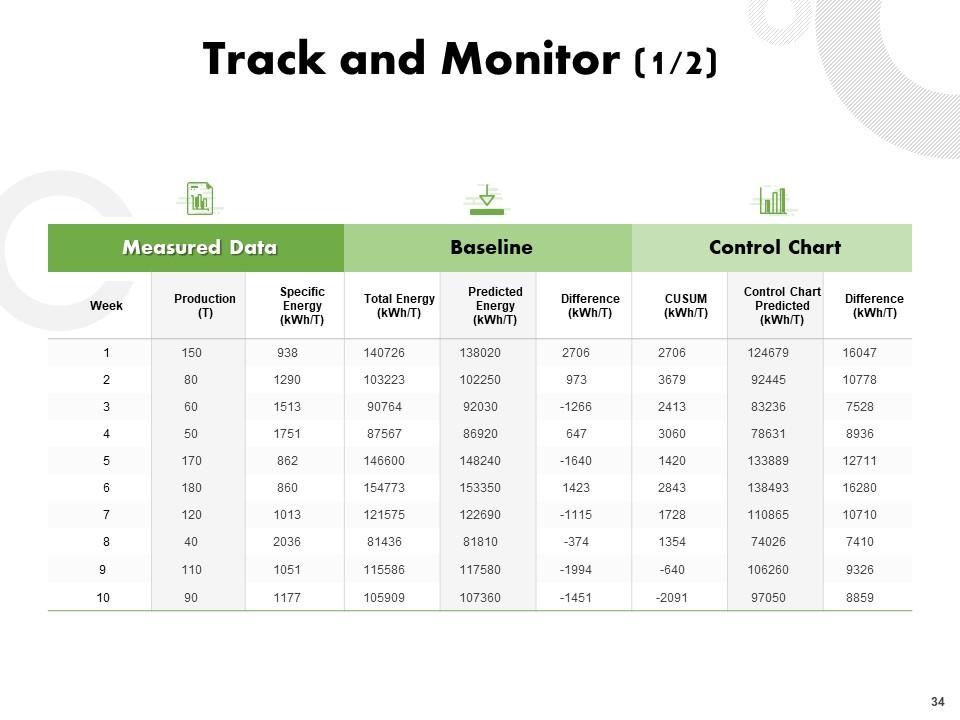
Slide 34: This slide displays Track and Monitor.
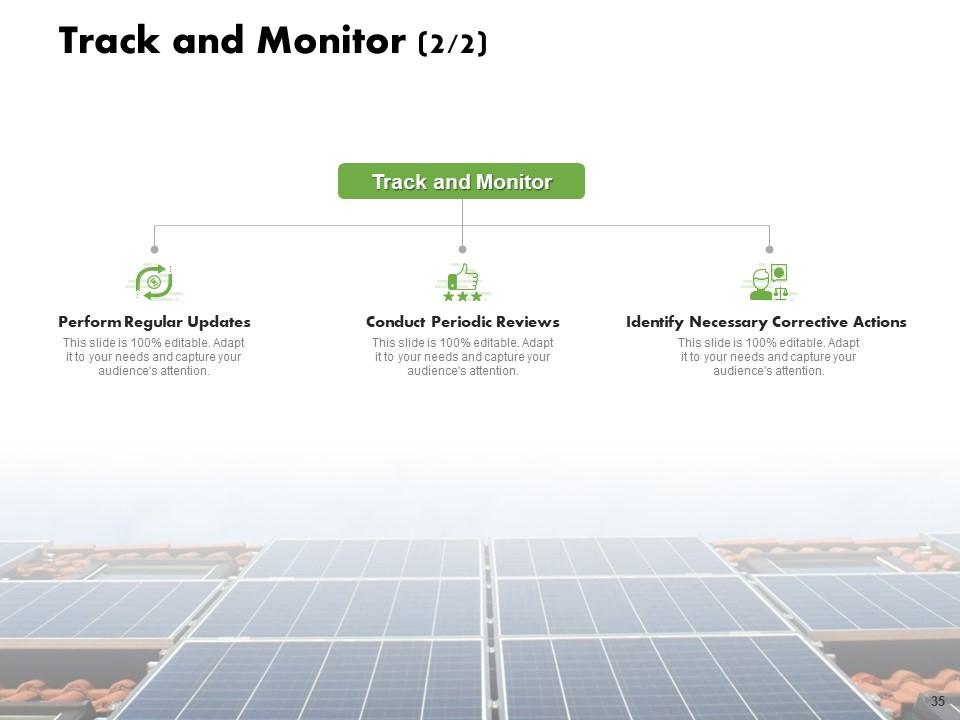
Slide 35: This slide displays Track and Monitor with- Perform Regular Updates, Conduct Periodic Reviews, Identify Necessary Corrective Actions.
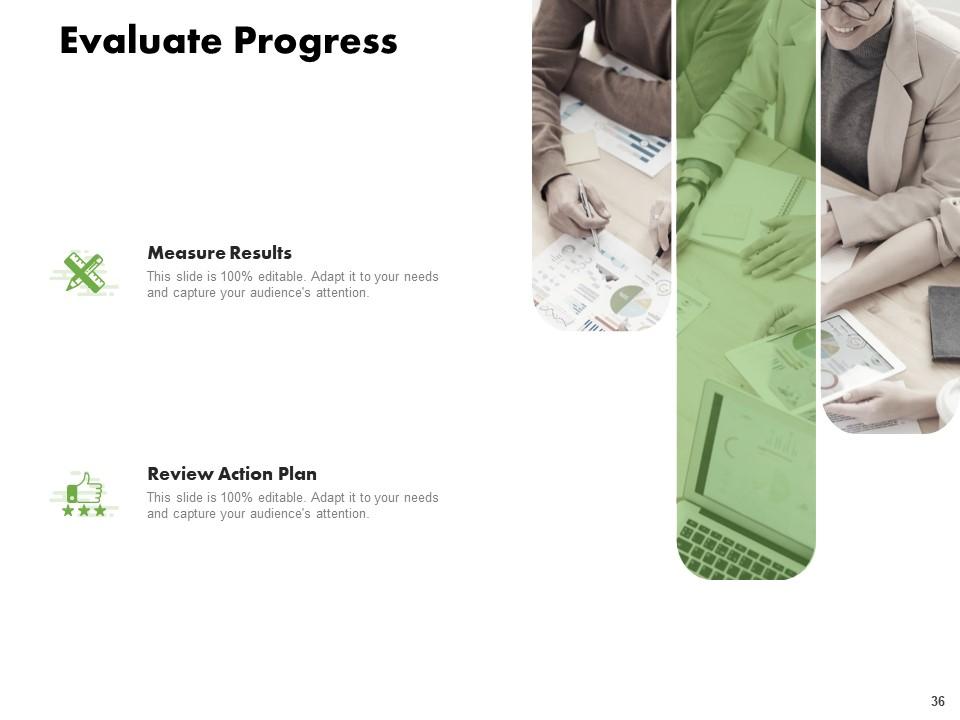
Slide 36: This slide showcases Review Action Plan with evaluate progress, measure results.
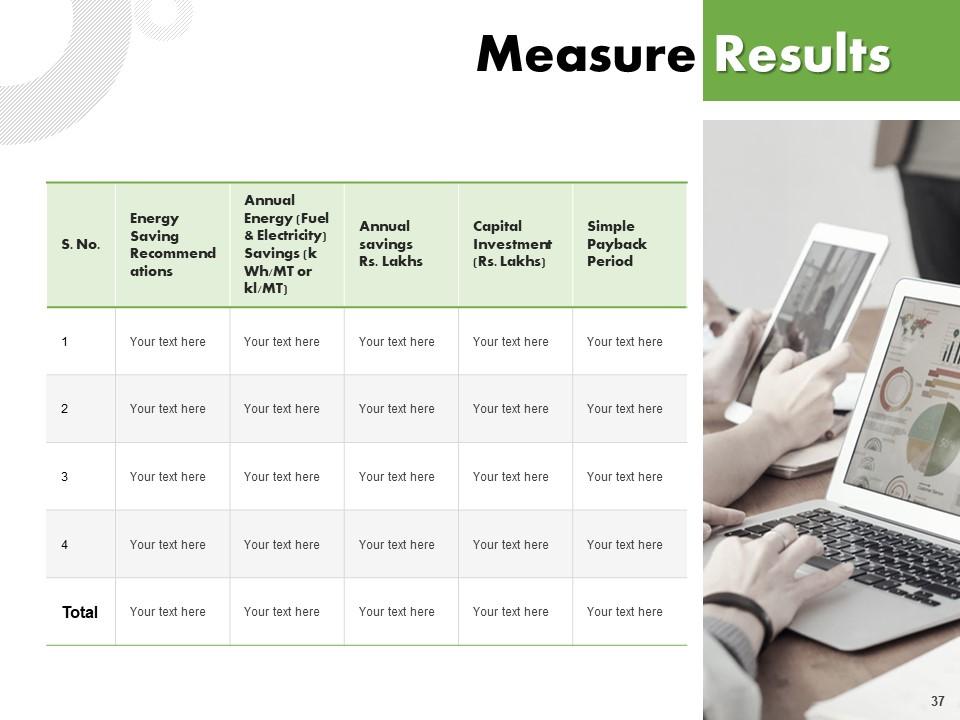
Slide 37: This slide showcases measure results.
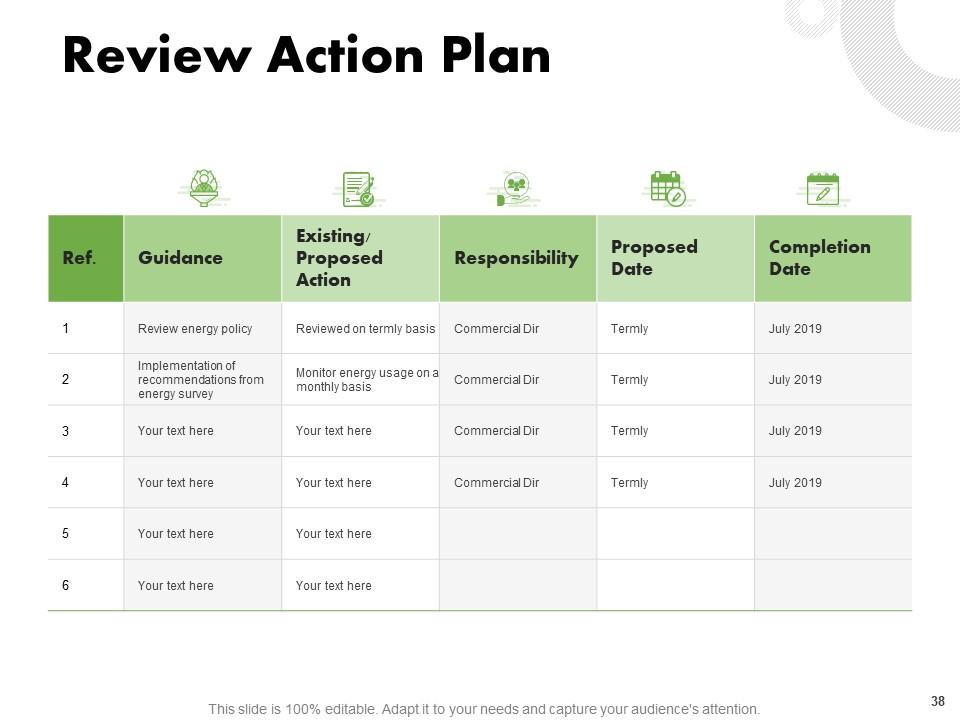
Slide 38: This is Review Action Plan slide.
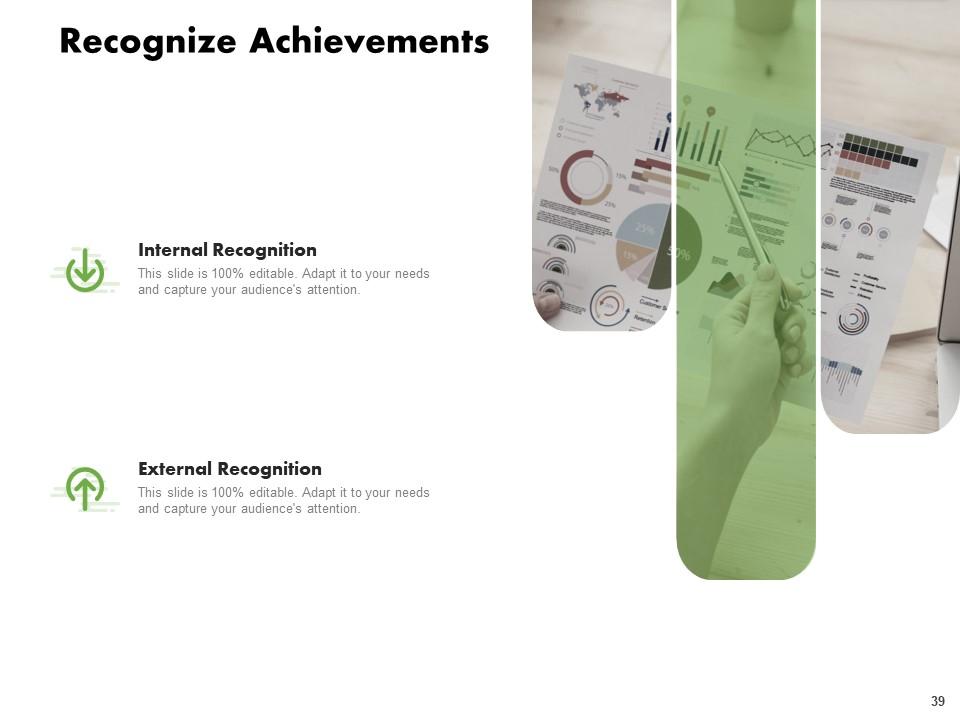
Slide 39: This slide showcases Recognize Achievements displaying- Internal Recognition, External Recognition.
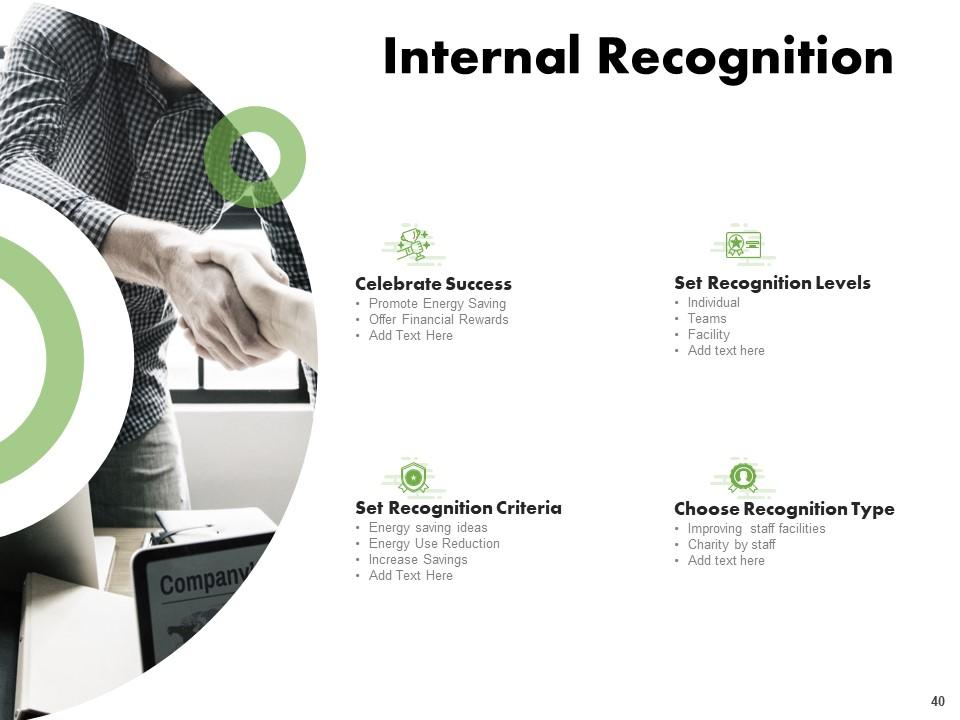
Slide 40: This slide depicts Internal Recognition with- Celebrate success, Promote energy saving, Offer financial rewards, Set Recognition Criteria, Energy saving ideas, Energy Use Reduction, Increase Savings, Set Recognition Levels.
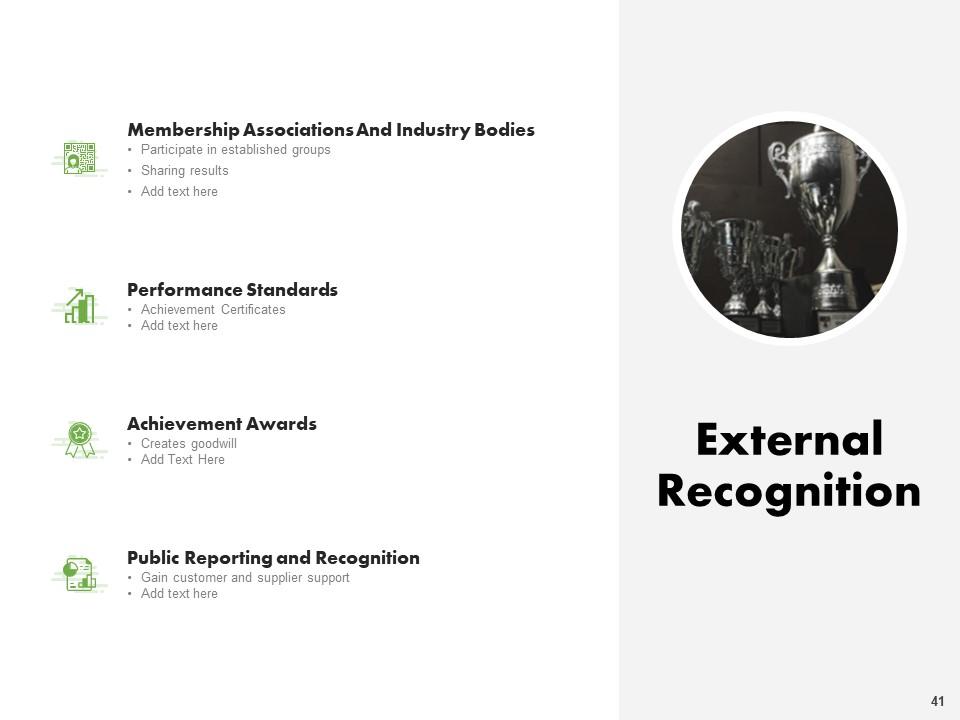
Slide 41: This slide depicts External Recognition with- Membership Associations and Industry Bodies, Participate in established groups, Sharing results, Performance Standards, Achievement certificates, Achievement Awards, Creates goodwill, Gain customer and supplier support.
Slide 42: This is KPI Metrics and Dashboard slide.
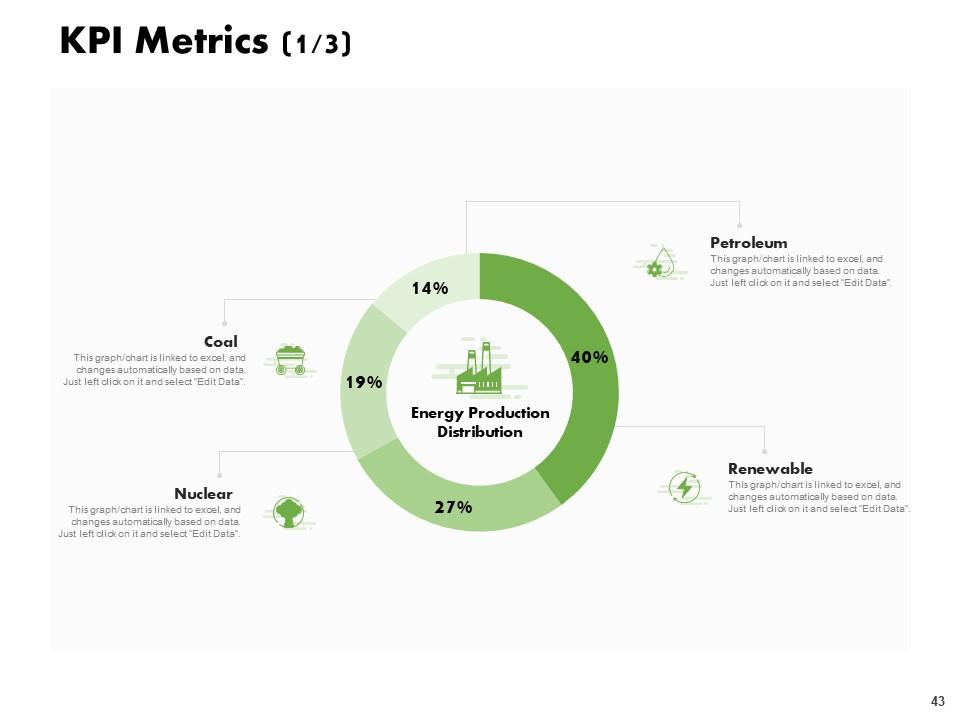
Slide 43: This slide showcases Energy Production Distribution.
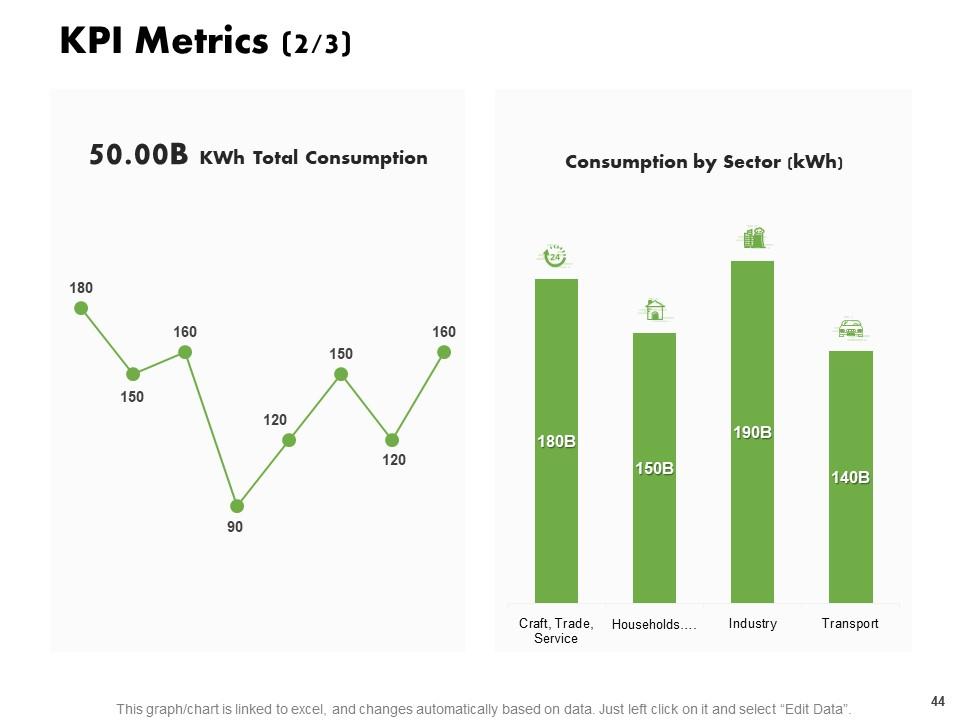
Slide 44: This is KPI Metrics slide showcasing total consumption, Consumption By Sector (kWh).
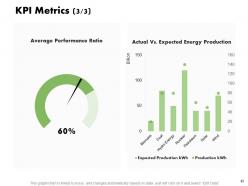
Slide 45: This slide also showcases KPI Metrics with Actual Vs. Expected Energy Production, Average Performance Ration.
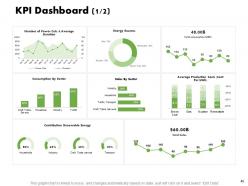
Slide 46: This is KPI Dashboard slide showcasing percentages of contribution of renewable energy to household, industry, craft, trade, service.
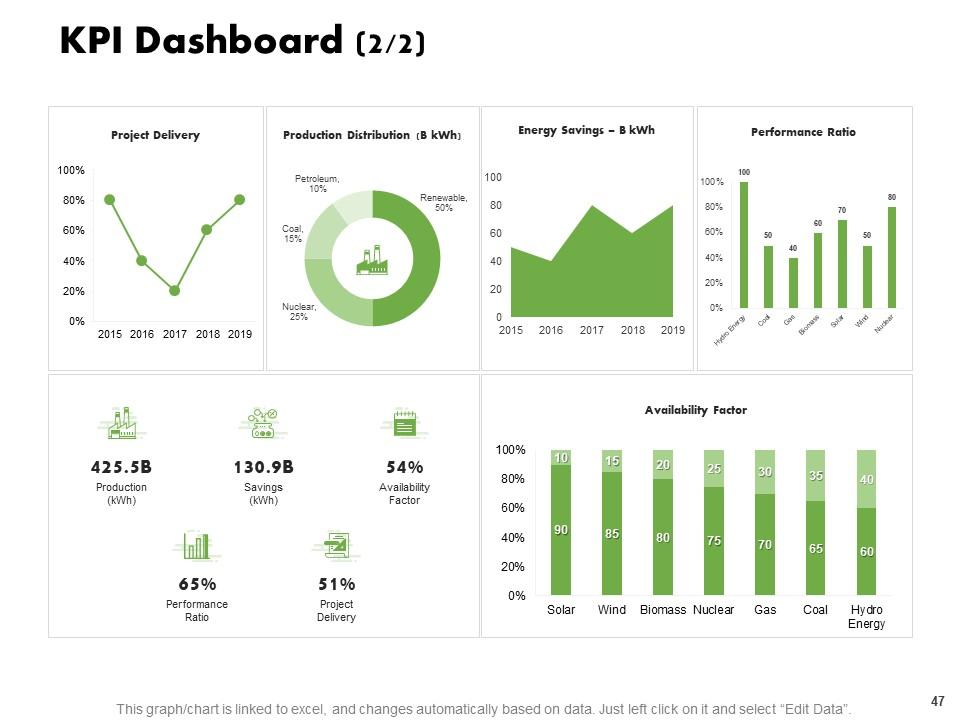
Slide 47: This is KPI Dashboard slide with- Project Delivery, Production Distribution (B kWh), Renewable, Nuclear, Coal, Gas, Energy Savings – B kWh, Performance Ratio Availability Factor, Production (kWh), Performance Ratio.
Slide 48: This is sustainability and environmental icons Slide.
Slide 49: This slide is titled as Additional Slides for moving forward.
Slide 50: This slide displays time for Coffee break.
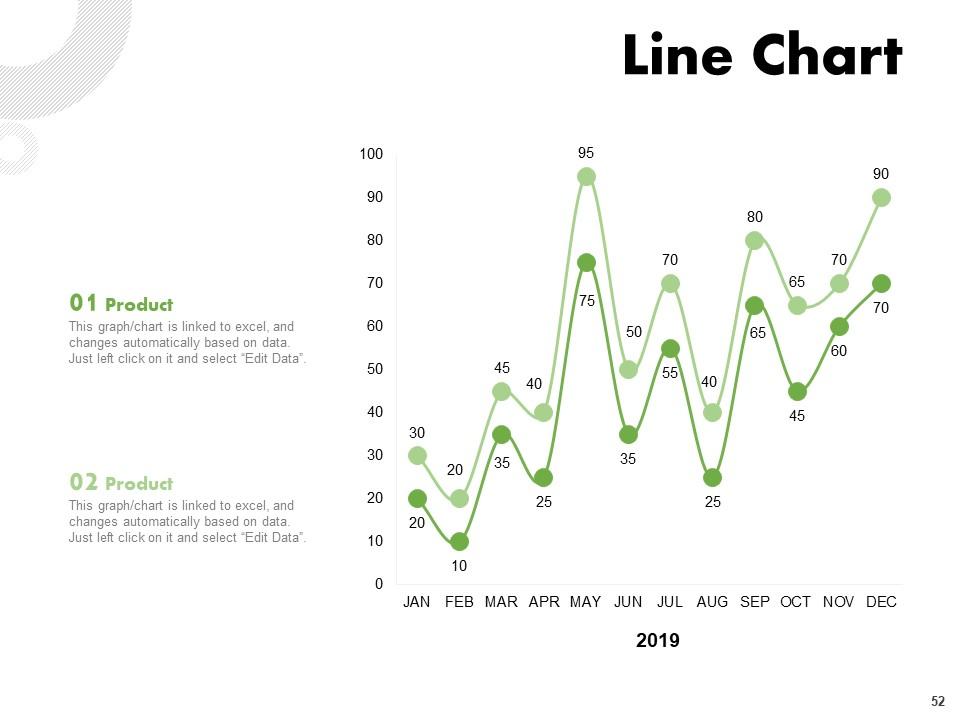
Slide 51: This slide displays Line Chart.
Slide 52: This slide displays Bar Chart with product comparison.
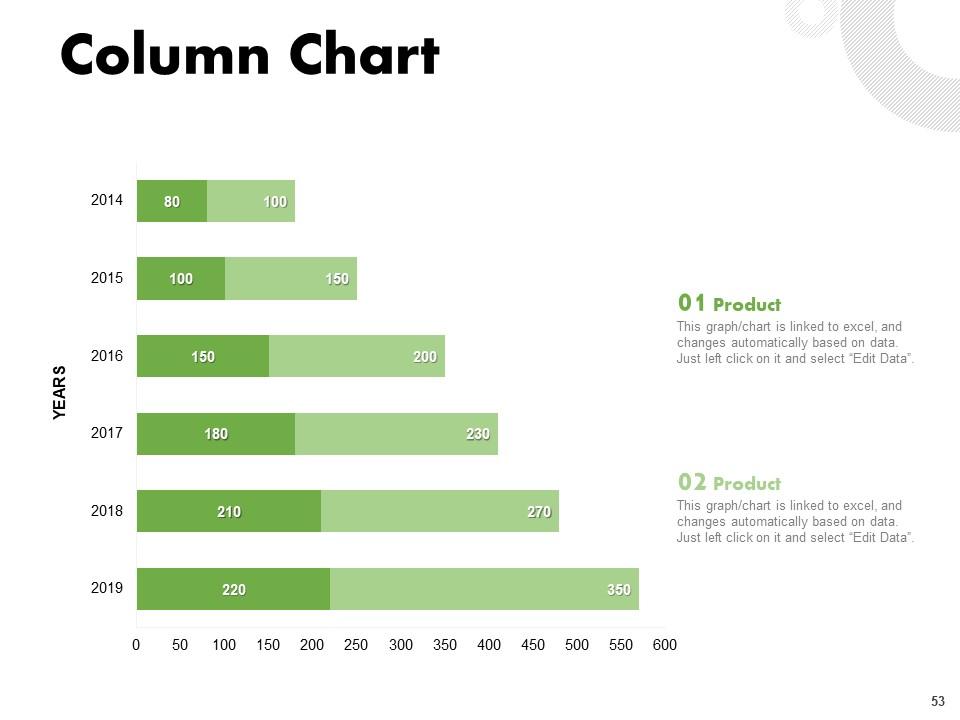
Slide 53: This slide displays Column Chart with product comparison.
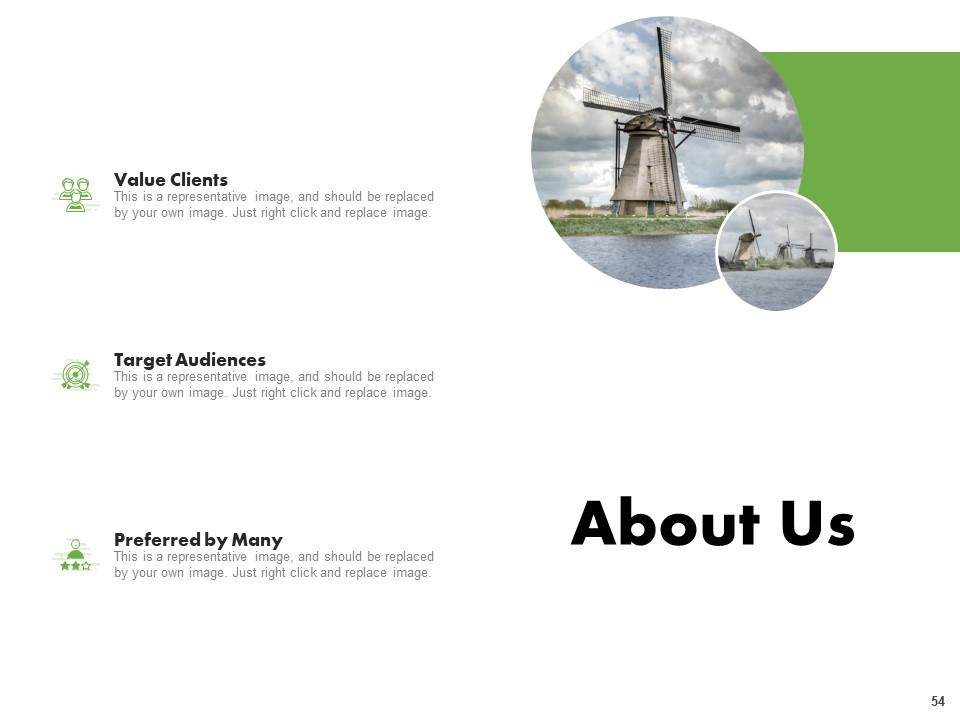
Slide 54: This is about us slide to showcase the company specifications.
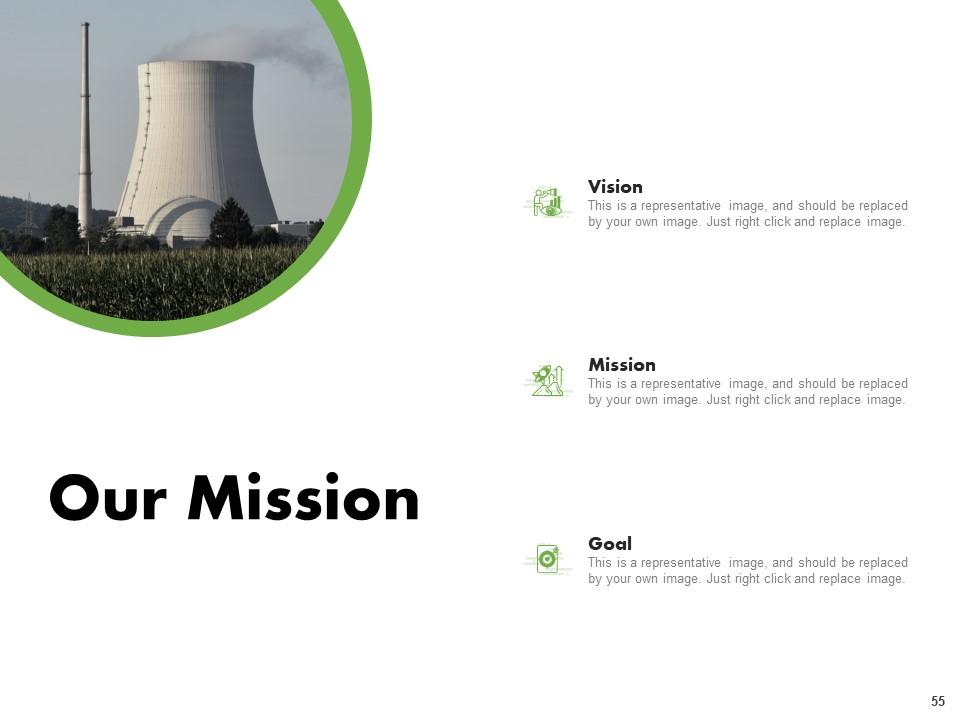
Slide 55: This is our mission slide to showcase company mission.
Slide 56: This is our goal slide to showcase company goals.
Slide 57: This is financial slide.
Slide 58: This is Our team slide with names and designation.
Slide 59: This is location slide with percentage of male and female in a particular country.
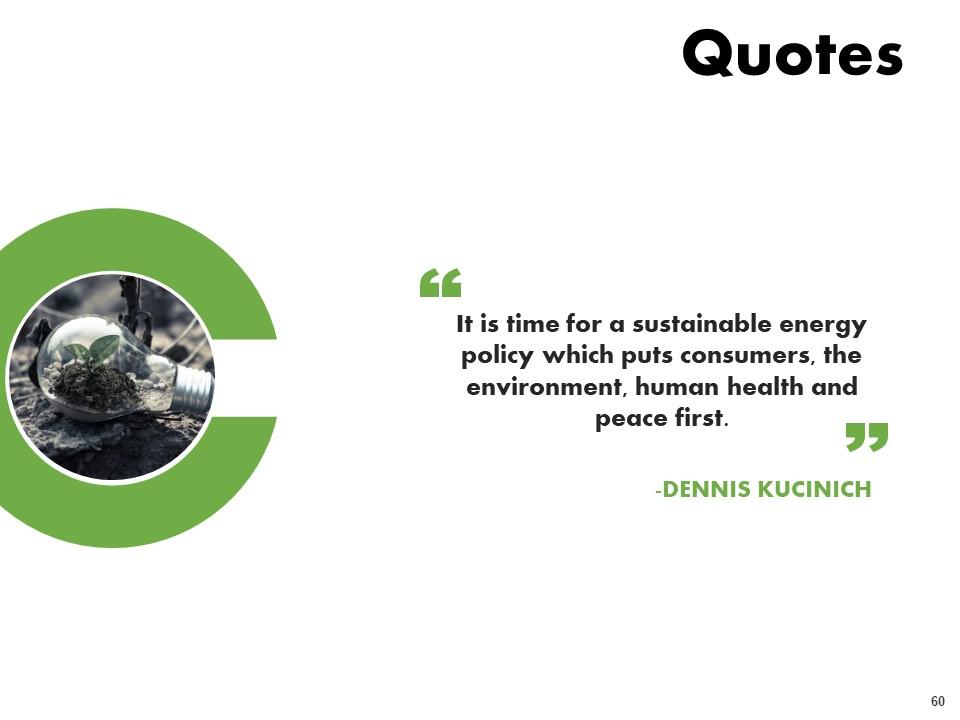
Slide 60: This is quote slide.
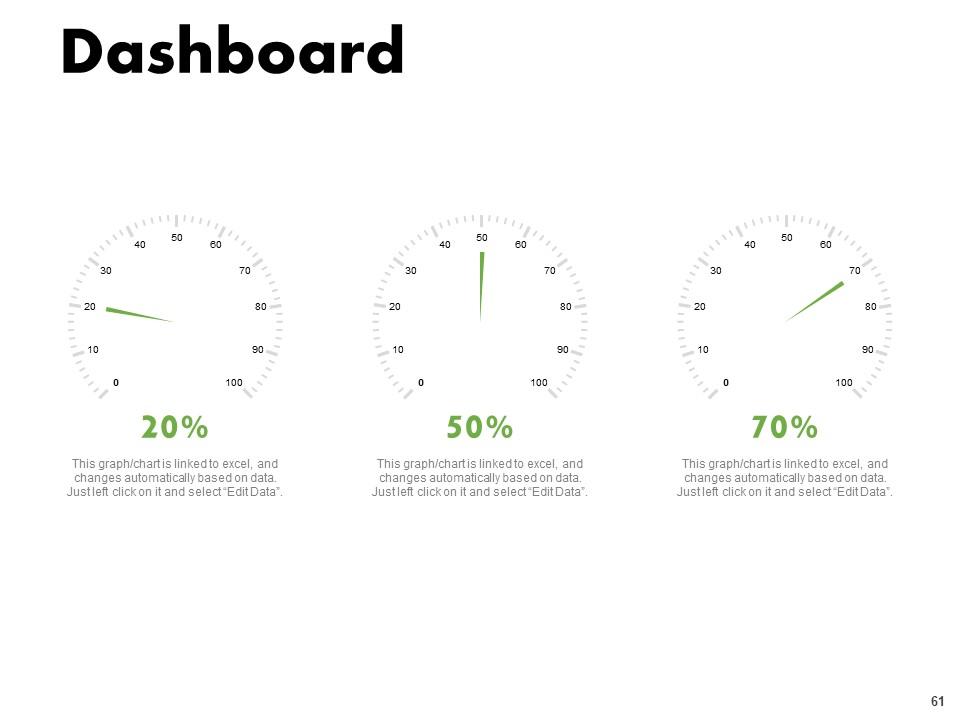
Slide 61: This is dashboard slide with percentage.
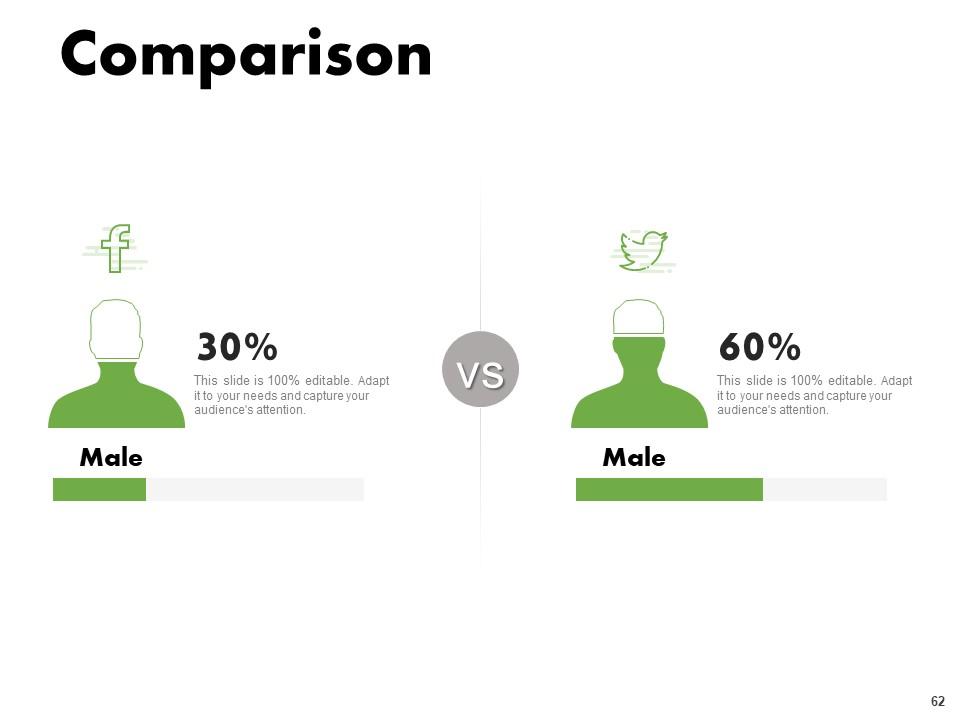
Slide 62: This slide showcases comparison between male and female users of facebook and twitter.
Slide 63: This is venn slide.
Slide 64: This is contact us slide with address, email address and contact number.
Sustainability And Environmental Management Powerpoint Presentation Slides with all 64 slides:
Use our Sustainability And Environmental Management Powerpoint Presentation Slides to effectively help you save your valuable time. They are readymade to fit into any presentation structure.
-
The Designed Graphic are very professional and classic.
-
Wonderful templates design to use in business meetings.
-
Perfect template with attractive color combination.
-
Helpful product design for delivering presentation.


