Top 10 Sustainability KPI Dashboard PowerPoint Templates with Professional Designs
Save time and engage your audience with our fully editable PowerPoint PPT Templates and Slides.
-

KPI Dashboard Infographic Bundle Powerpoint Ppt Templates And Slides
Introduce your topic and host expert discussion sessions with this KPI Dashboard Infographic Bundle Powerpoint Ppt Templates And Slides. This template is designed using high-quality visuals, images, graphics, etc, that can be used to showcase your expertise. Different topics can be tackled using the thirty slides included in this template. You can present each topic on a different slide to help your audience interpret the information more effectively. Apart from this, this PPT slideshow is available in two screen sizes, standard and widescreen making its delivery more impactful. This will not only help in presenting a birds-eye view of the topic but also keep your audience engaged. Since this PPT slideshow utilizes well-researched content, it induces strategic thinking and helps you convey your message in the best possible manner. The biggest feature of this design is that it comes with a host of editable features like color, font, background, etc. So, grab it now to deliver a unique presentation every time.
-

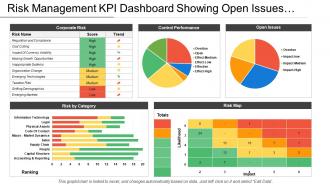
Risk Management Kpi Dashboard Showing Open Issues And Control Performance
Presenting this set of slides with name - Risk Management Kpi Dashboard Showing Open Issues And Control Performance. This is a five stage process. The stages in this process are Risk Management, Risk Assessment, Project Risk.
-
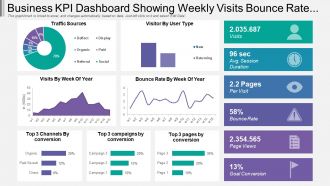
Business Kpi Dashboard Snapshot Showing Weekly Visits Bounce Rate And Traffic Source
Presentation graphic is totally compatible with Google slides. Multiple display options i.e. standard and widescreen. 100 percent editable designs to show your creativity. Similar designs available with different nodes and stages. Easy to download and convert into JPEG or PDF format. Alteration can be done in color, text and shape. Pre-designed PPT slide just download and insert it in the presentation. Quick download with easy to save. Choice to add company logo and replace text as required. High resolution quality ensures no pixilation.
-
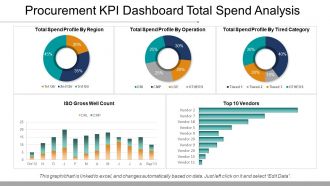
Procurement Kpi Dashboard Total Spend Analysis Ppt Samples
Presenting procurement kpi dashboard total spend analysis ppt samples. This is a procurement kpi dashboard total spend analysis ppt samples. This is a five stage process. The stages in this process are business, strategy, growth, finance, chart and graph.
-
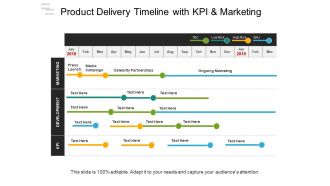
Product delivery timeline with kpi and marketing
Presenting product delivery timeline with kpi and marketing. Presenting product delivery timeline with kpi and marketing. This is a product delivery timeline with kpi and marketing. This is a five stage process. The stages in this process are delivery timeline, delivery roadmap, delivery period.
-
Business Intelligence KPI Dashboard Training Ppt
Presenting Business Intelligence KPI Dashboard. Our PowerPoint experts have included all the necessary templates, designs, icons, graphs, and other essential material. This deck is well crafted by extensive research. Slides consist of amazing visuals and appropriate content. These PPT slides can be instantly downloaded with just a click. Compatible with all screen types and monitors. Supports Google Slides. Premium Customer Support is available. Suitable for use by managers, employees, and organizations. These slides are easily customizable. You can edit the color, text, icon, and font size to suit your requirements.
-
KPI Dashboard To Evaluate Customer Service Client Assistance Plan To Solve Issues Strategy SS V
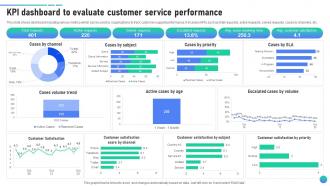
This slide shows dashboard including various metrics which can be used by organizations to track customer support performance. It includes KPIs such as total requests, active requests, solved requests, cases by channels, etc. Present the topic in a bit more detail with this KPI Dashboard To Evaluate Customer Service Client Assistance Plan To Solve Issues Strategy SS V. Use it as a tool for discussion and navigation on Active Requests, Solved Requests. This template is free to edit as deemed fit for your organization. Therefore download it now.
-
Sales Strategy To Boost Kpi Dashboard To Track Sales Plan Performance Strategy SS V
This slide shows dashboard which can be used by organizations to measure the results of sales plan. It includes metrics such as sales per product, actual vs target sales, sales by region, sales by channel, etc. Present the topic in a bit more detail with this Sales Strategy To Boost Kpi Dashboard To Track Sales Plan Performance Strategy SS V. Use it as a tool for discussion and navigation on KPI Dashboard To Track, Sales Plan Performance, Actual Vs Target Sales, Sales By Region, Sales By Channel. This template is free to edit as deemed fit for your organization. Therefore download it now.
-
Kpi Dashboard To Evaluate Human Resources Performance Employee Engagement Plan To Increase Staff
This slide shows dashboard which can be used by organizations to measure the results of employee relation management. It includes metrics such as employee net promoter score, employee absenteeism and employee retention. Deliver an outstanding presentation on the topic using this KPI Dashboard To Evaluate Human Resources Performance Employee Engagement Plan To Increase Staff. Dispense information and present a thorough explanation of Absence Rate, Absence Cost, Productivity Rate using the slides given. This template can be altered and personalized to fit your needs. It is also available for immediate download. So grab it now.
-
Kpi Dashboard To Track Plan Performance Marketing Plan To Grow Product Strategy SS V
This slide shows dashboard which can be used by organizations to measure the results of sales plan. It includes metrics such as sales per product, actual vs target sales, sales by region, sales by channel, etc. Present the topic in a bit more detail with this Kpi Dashboard To Track Plan Performance Marketing Plan To Grow Product Strategy SS V. Use it as a tool for discussion and navigation on Sales Per Product, Actual Vs Target Sales. This template is free to edit as deemed fit for your organization. Therefore download it now.
-
CRM And Sales Automation KPI Dashboard
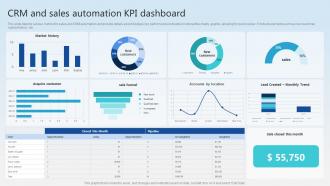
This slide depicts various metrics for sales and CRM automation and provide details about displays key performance indicators in interactive charts, graphs, allowing for quick review. It include elements such as new customer, market history, etc. Presenting our well structured CRM And Sales Automation KPI Dashboard. The topics discussed in this slide are Acquire Costumer, Sale Funnel, Market History. This is an instantly available PowerPoint presentation that can be edited conveniently. Download it right away and captivate your audience.
-
Sustainability KPI Dashboard For Environmental Impact Tracking PPT Graphics AT
Step up your game with our enchanting Sustainability KPI Dashboard For Environmental Impact Tracking PPT Graphics AT deck, guaranteed to leave a lasting impression on your audience. Crafted with a perfect balance of simplicity, and innovation, our deck empowers you to alter it to your specific needs. You can also change the color theme of the slide to mold it to your companys specific needs. Save time with our ready-made design, compatible with Microsoft versions and Google Slides. Additionally, its available for download in various formats including JPG, JPEG, and PNG. Outshine your competitors with our fully editable and customized deck.
-
ESG Sustainability KPI Dashboard Insights PPT Mockup AT
While your presentation may contain top notch content, if it lacks visual appeal, you are not fully engaging your audience. Introducing our ESG Sustainability KPI Dashboard Insights PPT Mockup AT deck, designed to engage your audience. Our complete deck boasts a seamless blend of Creativity and versatility. You can effortlessly customize elements and color schemes to align with your brand identity. Save precious time with our pre designed template, compatible with Microsoft versions and Google Slides. Plus, its downloadable in multiple formats like JPG, JPEG, and PNG. Elevate your presentations and outshine your competitors effortlessly with our visually stunning 100 percent editable deck.
-
Eco Sustainability KPI Dashboard Overview PPT Mockup AT
Step up your game with our enchanting Eco Sustainability KPI Dashboard Overview PPT Mockup AT deck, guaranteed to leave a lasting impression on your audience. Crafted with a perfect balance of simplicity, and innovation, our deck empowers you to alter it to your specific needs. You can also change the color theme of the slide to mold it to your companys specific needs. Save time with our ready made design, compatible with Microsoft versions and Google Slides. Additionally, its available for download in various formats including JPG, JPEG, and PNG. Outshine your competitors with our fully editable and customized deck.
-
Corporate Sustainability KPI Dashboard Kit PPT Slides AT
Do not compromise on a template that erodes your messages impact. Introducing our engaging Corporate Sustainability KPI Dashboard Kit PPT Slides AT complete deck, thoughtfully crafted to grab your audiences attention instantly. With this deck, effortlessly download and adjust elements, streamlining the customization process. Whether you are using Microsoft versions or Google Slides, it fits seamlessly into your workflow. Furthermore, it is accessible in JPG, JPEG, PNG, and PDF formats, facilitating easy sharing and editing. Not only that you also play with the color theme of your slides making it suitable as per your audiences preference.
-
Environmental Sustainability KPI Dashboard PPT Graphics AT
While your presentation may contain top notch content, if it lacks visual appeal, you are not fully engaging your audience. Introducing our Environmental Sustainability KPI Dashboard PPT Graphics AT deck, designed to engage your audience. Our complete deck boasts a seamless blend of Creativity and versatility. You can effortlessly customize elements and color schemes to align with your brand identity. Save precious time with our pre designed template, compatible with Microsoft versions and Google Slides. Plus, its downloadable in multiple formats like JPG, JPEG, and PNG. Elevate your presentations and outshine your competitors effortlessly with our visually stunning 100 percent editable deck.
-
Sustainability KPI Dashboard Overview PPT Slides AT
Do not compromise on a template that erodes your messages impact. Introducing our engaging Sustainability KPI Dashboard Overview PPT Slides AT complete deck, thoughtfully crafted to grab your audiences attention instantly. With this deck, effortlessly download and adjust elements, streamlining the customization process. Whether you are using Microsoft versions or Google Slides, it fits seamlessly into your workflow. Furthermore, it is accessible in JPG, JPEG, PNG, and PDF formats, facilitating easy sharing and editing. Not only that you also play with the color theme of your slides making it suitable as per your audiences preference.
-
Ultimate Sustainability KPI Dashboard PPT Presentation AT
Do not compromise on a template that erodes your messages impact. Introducing our engaging Ultimate Sustainability KPI Dashboard PPT Presentation AT complete deck, thoughtfully crafted to grab your audiences attention instantly. With this deck, effortlessly download and adjust elements, streamlining the customization process. Whether you are using Microsoft versions or Google Slides, it fits seamlessly into your workflow. Furthermore, it is accessible in JPG, JPEG, PNG, and PDF formats, facilitating easy sharing and editing. Not only that you also play with the color theme of your slides making it suitable as per your audiences preference.
-
Green Sustainability KPI Dashboard PPT Mockup AT
Do not compromise on a template that erodes your messages impact. Introducing our engaging Green Sustainability KPI Dashboard PPT Mockup AT complete deck, thoughtfully crafted to grab your audiences attention instantly. With this deck, effortlessly download and adjust elements, streamlining the customization process. Whether you are using Microsoft versions or Google Slides, it fits seamlessly into your workflow. Furthermore, it is accessible in JPG, JPEG, PNG, and PDF formats, facilitating easy sharing and editing. Not only that you also play with the color theme of your slides making it suitable as per your audiences preference.
-
Modern Sustainability KPI Dashboard Pack PPT Graphics AT
While your presentation may contain top-notch content, if it lacks visual appeal, you are not fully engaging your audience. Introducing our Modern Sustainability KPI Dashboard Pack PPT Graphics AT deck, designed to engage your audience. Our complete deck boasts a seamless blend of Creativity and versatility. You can effortlessly customize elements and color schemes to align with your brand identity. Save precious time with our pre-designed template, compatible with Microsoft versions and Google Slides. Plus, its downloadable in multiple formats like JPG, JPEG, and PNG. Elevate your presentations and outshine your competitors effortlessly with our visually stunning 100 percent editable deck.
-
Environmental Sustainability KPI Dashboard Overview PPT Outline AT
Ditch the Dull templates and opt for our engaging Environmental Sustainability KPI Dashboard Overview PPT Outline AT deck to attract your audience. Our visually striking design effortlessly combines creativity with functionality, ensuring your content shines through. Compatible with Microsoft versions and Google Slides, it offers seamless integration of presentation. Save time and effort with our pre-designed PPT layout, while still having the freedom to customize fonts, colors, and everything you ask for. With the ability to download in various formats like JPG, JPEG, and PNG, sharing your slides has never been easier. From boardroom meetings to client pitches, this deck can be the secret weapon to leaving a lasting impression.
-
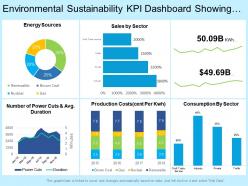
Environmental sustainability kpi dashboard showing total consumption sales energy sources
Presenting this set of slides with name - Environmental Sustainability Kpi Dashboard Showing Total Consumption Sales Energy Sources. This is a six stage process. The stages in this process are Environment Sustainability, Environment Continual, Environment Feasibility.
-
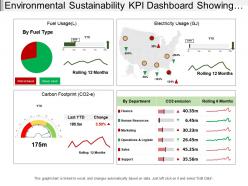
Environmental sustainability kpi dashboard showing carbon footprint and electricity usage
Presenting the environmental sustainability KPI dashboard PowerPoint slide. This presentation slide is fully editable in PowerPoint. It is customizable according to your requirement. The font color, style, size, diagram color and background color of slide can be changed as per your requirement. You can conveniently replace the sample content in text placeholders with your presentation content. This template is suitable for use with Google Slides. It can be saved in JPG or PDF formats. It is available in both standard size and wide screen size. Download it quickly at the click of a button.
-
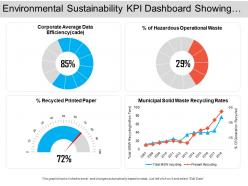
Environmental sustainability kpi dashboard showing corporate average data efficiency
Presenting this set of slides with name - Environmental Sustainability Kpi Dashboard Showing Corporate Average Data Efficiency. This is a four stage process. The stages in this process are Environment Sustainability, Environment Continual, Environment Feasibility.
-
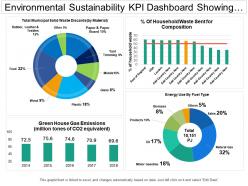
Environmental sustainability kpi dashboard showing municipal solid waste discard
Presenting this set of slides with name - Environmental Sustainability Kpi Dashboard Showing Municipal Solid Waste Discard. This is a four stage process. The stages in this process are Environment Sustainability, Environment Continual, Environment Feasibility.
-
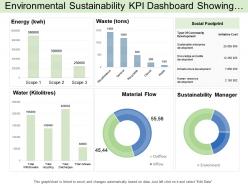
Environmental sustainability kpi dashboard showing social footprint and supply chain category
Presenting this set of slides with name - Environmental Sustainability Kpi Dashboard Showing Social Footprint And Supply Chain Category. This is a six stage process. The stages in this process are Environment Sustainability, Environment Continual, Environment Feasibility.
-
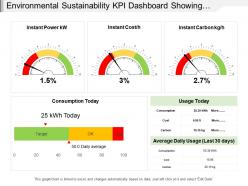
Environmental sustainability kpi dashboard showing instant power cost carbon and consumption
Presenting this set of slides with name - Environmental Sustainability Kpi Dashboard Showing Instant Power Cost Carbon And Consumption. This is a three stage process. The stages in this process are Environment Sustainability, Environment Continual, Environment Feasibility.
-
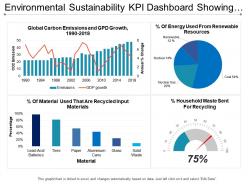
Environmental sustainability kpi dashboard showing global carbon emission and gdp growth
Presenting this set of slides with name - Environmental Sustainability Kpi Dashboard Showing Global Carbon Emission And Gdp Growth. This is a four stage process. The stages in this process are Environment Sustainability, Environment Continual, Environment Feasibility.
-
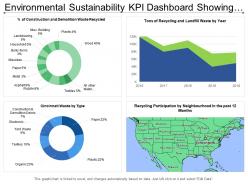
Environmental sustainability kpi dashboard showing recycling participation by neighborhood
Presenting this set of slides with name - Environmental Sustainability Kpi Dashboard Showing Recycling Participation By Neighborhood. This is a four stage process. The stages in this process are Environment Sustainability, Environment Continual, Environment Feasibility.
-
CSR KPI Dashboard For Sustainability PPT Information AT
Do not compromise on a template that erodes your messages impact. Introducing our engaging CSR KPI Dashboard For Sustainability PPT Information AT complete deck, thoughtfully crafted to grab your audiences attention instantly. With this deck, effortlessly download and adjust elements, streamlining the customization process. Whether you are using Microsoft versions or Google Slides, it fits seamlessly into your workflow. Furthermore, it is accessible in JPG, JPEG, PNG, and PDF formats, facilitating easy sharing and editing. Not only that you also play with the color theme of your slides making it suitable as per your audiences preference.
-
Agriculture KPI Dashboard For Sustainability PPT Sample AT
Ditch the Dull templates and opt for our engaging Agriculture KPI Dashboard For Sustainability PPT Sample AT deck to attract your audience. Our visually striking design effortlessly combines creativity with functionality, ensuring your content shines through. Compatible with Microsoft versions and Google Slides, it offers seamless integration of presentation. Save time and effort with our pre designed PPT layout, while still having the freedom to customize fonts, colors, and everything you ask for. With the ability to download in various formats like JPG, JPEG, and PNG, sharing your slides has never been easier. From boardroom meetings to client pitches, this deck can be the secret weapon to leaving a lasting impression.
-
Customer service dashboard snapshot measure sustainability key performance indicators
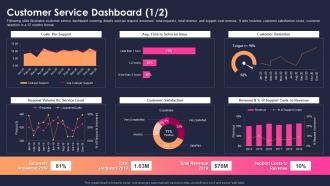
Following slide illustrates customer service dashboard covering details such as request answered, total requests, total revenue and support cost revenue. It also includes customer satisfaction score, customer retention in a 12 months format. Deliver an outstanding presentation on the topic using this Customer Service Dashboard Snapshot Measure Sustainability Key Performance Indicators. Dispense information and present a thorough explanation of Costs Per Support, Avg. Time To Solve Issue, Customer Retention, Request Volume Vs Service Level, Customer Satisfaction using the slides given. This template can be altered and personalized to fit your needs. It is also available for immediate download. So grab it now.
-
Cash flow dashboard snapshot measure sustainability key performance indicators
Following slide covers cash flow dashboard snapshot covering details like beginning cash on hand, cash going in, cash going out, profit or loss and ending cash on hand. It also includes detail of accounts receivable and payable. Present the topic in a bit more detail with this Cash Flow Dashboard Measure Sustainability Key Performance Indicators. Use it as a tool for discussion and navigation on Beginning Cash On Hand, Cash Going, Cash Going Out, Profit, Loss, Ending Cash Hand. This template is free to edit as deemed fit for your organization. Therefore download it now.
-
Measure sustainability key performance indicators customer service dashboard
This slide covers customer service dashboard. It includes weekly details of number of support incidents, average first response time, average resolution time, abandon rate, average waiting time and first contact resolution. Present the topic in a bit more detail with this Measure Sustainability Key Performance Indicators Customer Service Dashboard. Use it as a tool for discussion and navigation on Number support incident week, Resolution Time by Channel, Average First Response Time, Average Resolution Time, First Contact Resolution . This template is free to edit as deemed fit for your organization. Therefore download it now.
-
Measure sustainability key performance indicators customer satisfaction dashboard
Following slide shows customer satisfaction dashboard covering net promoter score. It also includes customer retention metrics with a 12-month format. Deliver an outstanding presentation on the topic using this Measure Sustainability Key Performance Indicators Customer Satisfaction Dashboard. Dispense information and present a thorough explanation of Net Promoter Score, Customer Retention, Promoters, Passives, Detractors using the slides given. This template can be altered and personalized to fit your needs. It is also available for immediate download. So grab it now.
-
Measure sustainability key performance indicators cash flow dashboard
Mentioned slide covers cash flow dashboard. It shows detailed cash flow status in a 12 months format and working capital with accounts receivable and payable details. Present the topic in a bit more detail with this Measure Sustainability Key Performance Indicators Cash Flow Dashboard. Use it as a tool for discussion and navigation on Cash Flow, Days Sales Outstanding, Projected, Working Capital. This template is free to edit as deemed fit for your organization. Therefore download it now.
-
Customer satisfaction dashboard snapshot measure sustainability key performance indicators
Mentioned slide covers customer satisfaction dashboard with a 12-month format. It includes customer satisfaction details by region and by district. Present the topic in a bit more detail with this Customer Satisfaction Dashboard Snapshot Measure Sustainability Key Performance Indicators. Use it as a tool for discussion and navigation on Best Demonstrated, Worst Demonstrated, Avg Variance Target. This template is free to edit as deemed fit for your organization. Therefore download it now.
-
Measure sustainability key performance indicators financial performance indicator dashboard snapshot
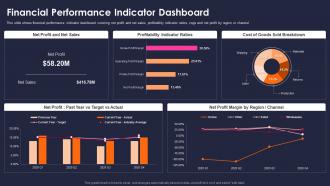
This slide shows financial performance indicator dashboard covering net profit and net sales, profitability indicator ratios, cogs and net profit by region or channel. Deliver an outstanding presentation on the topic using this Measure Sustainability Key Performance Indicators Financial Performance Indicator Dashboard Snapshot. Dispense information and present a thorough explanation of Net Profit and Net Sales, Profitability Indicator Ratios, Cost of Goods Sold Breakdown, Net Profit, Past Year vs Target vs Actual using the slides given. This template can be altered and personalized to fit your needs. It is also available for immediate download. So grab it now.
-
Measure sustainability key performance indicators real time utilization dashboard
This slide covers real time utilization dashboard covering logged time such as billable, non-billable, estimated time and scheduled. It also include details of allotted hours to each employee and weekly hours for the assignment. Present the topic in a bit more detail with this Measure Sustainability Key Performance Indicators Real Time Utilization Dashboard. Use it as a tool for discussion and navigation on Logged Time, Estimated Time, Nonbillable, Billable. This template is free to edit as deemed fit for your organization. Therefore download it now.
-
Measure sustainability key performance indicators customer churn rate dashboard
Mentioned slide covers customer churn rate dashboard. It includes details of monthly customer churn rate, accounts opened, churned accounts demographics and churn heatmap. Deliver an outstanding presentation on the topic using this Measure Sustainability Key Performance Indicators Customer Churn Rate Dashboard. Dispense information and present a thorough explanation of Monthly Customer, Churn Rate, Demographics, Churned Accounts 2020 using the slides given. This template can be altered and personalized to fit your needs. It is also available for immediate download. So grab it now.
-
Measure sustainability key performance indicators customer lifetime value dashboard
This slide covers customer lifetime value dashboard. It covers details of average customer lifetime and average lifetime value in a 12 months format. Present the topic in a bit more detail with this Measure Sustainability Key Performance Indicators Customer Lifetime Value Dashboard. Use it as a tool for discussion and navigation on Average Customer Lifetime, Average Lifetime Value. This template is free to edit as deemed fit for your organization. Therefore download it now.
-
Measure sustainability key performance indicators profit margin measuring kpi dashboard
Following slide illustrates profit margin dashboard with a 12 months format. It also includes gross profit margin, operating profit margin and net profit margin. Deliver an outstanding presentation on the topic using this Measure Sustainability Key Performance Indicators Profit Margin Measuring KPI Dashboard. Dispense information and present a thorough explanation of Gross Profit Margin, Operating Profit Margin, Net Profit Margin, 2020 using the slides given. This template can be altered and personalized to fit your needs. It is also available for immediate download. So grab it now.
-
Measure sustainability key performance indicators revenue and employment cost dashboard
Mentioned slide covers revenue and employment cost dashboard. It includes details like full time employee number, total employment cost, total revenue and average revenue per FTE. Present the topic in a bit more detail with this Measure Sustainability Key Performance Indicators Revenue And Employment Cost Dashboard. Use it as a tool for discussion and navigation on Full Time Employee, Total Revenue, Total Employee Cost, Average Revenue Per FTF. This template is free to edit as deemed fit for your organization. Therefore download it now.
-
Sustainable Performance Kpis Dashboard PPT Structure AT
Ditch the Dull templates and opt for our engaging Sustainable Performance Kpis Dashboard PPT Structure AT deck to attract your audience. Our visually striking design effortlessly combines creativity with functionality, ensuring your content shines through. Compatible with Microsoft versions and Google Slides, it offers seamless integration of presentation. Save time and effort with our pre-designed PPT layout, while still having the freedom to customize fonts, colors, and everything you ask for. With the ability to download in various formats like JPG, JPEG, and PNG, sharing your slides has never been easier. From boardroom meetings to client pitches, this deck can be the secret weapon to leaving a lasting impression.
-
Sustainability KPI With Benchmarks PPT Graphics AT
Ditch the Dull templates and opt for our engaging Sustainability KPI With Benchmarks PPT Graphics AT deck to attract your audience. Our visually striking design effortlessly combines creativity with functionality, ensuring your content shines through. Compatible with Microsoft versions and Google Slides, it offers seamless integration of presentation. Save time and effort with our pre-designed PPT layout, while still having the freedom to customize fonts, colors, and everything you ask for. With the ability to download in various formats like JPG, JPEG, and PNG, sharing your slides has never been easier. From boardroom meetings to client pitches, this deck can be the secret weapon to leaving a lasting impression.
-
Actionable Insights From Sustainability KPI Data PPT Structure AT
Ditch the Dull templates and opt for our engaging Actionable Insights From Sustainability KPI Data PPT Structure AT deck to attract your audience. Our visually striking design effortlessly combines creativity with functionality, ensuring your content shines through. Compatible with Microsoft versions and Google Slides, it offers seamless integration of presentation. Save time and effort with our pre designed PPT layout, while still having the freedom to customize fonts, colors, and everything you ask for. With the ability to download in various formats like JPG, JPEG, and PNG, sharing your slides has never been easier. From boardroom meetings to client pitches, this deck can be the secret weapon to leaving a lasting impression.
-
Environmental Impact Kpis Dashboard And Metrics PPT Information AT
Ditch the Dull templates and opt for our engaging Environmental Impact Kpis Dashboard And Metrics PPT Information AT deck to attract your audience. Our visually striking design effortlessly combines creativity with functionality, ensuring your content shines through. Compatible with Microsoft versions and Google Slides, it offers seamless integration of presentation. Save time and effort with our pre designed PPT layout, while still having the freedom to customize fonts, colors, and everything you ask for. With the ability to download in various formats like JPG, JPEG, and PNG, sharing your slides has never been easier. From boardroom meetings to client pitches, this deck can be the secret weapon to leaving a lasting impression.
-
Sustainability Roadmap With SMART Kpis PPT Demonstration AT
Step up your game with our enchanting Sustainability Roadmap With SMART Kpis PPT Demonstration AT deck, guaranteed to leave a lasting impression on your audience. Crafted with a perfect balance of simplicity, and innovation, our deck empowers you to alter it to your specific needs. You can also change the color theme of the slide to mold it to your companys specific needs. Save time with our ready made design, compatible with Microsoft versions and Google Slides. Additionally, its available for download in various formats including JPG, JPEG, and PNG. Outshine your competitors with our fully editable and customized deck.
-
Green KPI Tracker For Sustainability Goals PPT Structure AT
Do not compromise on a template that erodes your messages impact. Introducing our engaging Green KPI Tracker For Sustainability Goals PPT Structure AT complete deck, thoughtfully crafted to grab your audiences attention instantly. With this deck, effortlessly download and adjust elements, streamlining the customization process. Whether you are using Microsoft versions or Google Slides, it fits seamlessly into your workflow. Furthermore, it is accessible in JPG, JPEG, PNG, and PDF formats, facilitating easy sharing and editing. Not only that you also play with the color theme of your slides making it suitable as per your audiences preference.
-
Sustainability Waste Kpis Dashboard PPT Structure AT
While your presentation may contain top-notch content, if it lacks visual appeal, you are not fully engaging your audience. Introducing our Sustainability Waste Kpis Dashboard PPT Structure AT deck, designed to engage your audience. Our complete deck boasts a seamless blend of Creativity and versatility. You can effortlessly customize elements and color schemes to align with your brand identity. Save precious time with our pre-designed template, compatible with Microsoft versions and Google Slides. Plus, its downloadable in multiple formats like JPG, JPEG, and PNG. Elevate your presentations and outshine your competitors effortlessly with our visually stunning 100 percent editable deck.
-
Sustainability Kpis To Drive Renewable Energy PPT Presentation AT
While your presentation may contain top notch content, if it lacks visual appeal, you are not fully engaging your audience. Introducing our Sustainability Kpis To Drive Renewable Energy PPT Presentation AT deck, designed to engage your audience. Our complete deck boasts a seamless blend of Creativity and versatility. You can effortlessly customize elements and color schemes to align with your brand identity. Save precious time with our pre designed template, compatible with Microsoft versions and Google Slides. Plus, its downloadable in multiple formats like JPG, JPEG, and PNG. Elevate your presentations and outshine your competitors effortlessly with our visually stunning 100 percent editable deck.
-
Key Sustainability Kpis For Monitoring Renewable Energy Usage PPT Information AT
Ditch the Dull templates and opt for our engaging Key Sustainability Kpis For Monitoring Renewable Energy Usage PPT Information AT deck to attract your audience. Our visually striking design effortlessly combines creativity with functionality, ensuring your content shines through. Compatible with Microsoft versions and Google Slides, it offers seamless integration of presentation. Save time and effort with our pre-designed PPT layout, while still having the freedom to customize fonts, colors, and everything you ask for. With the ability to download in various formats like JPG, JPEG, and PNG, sharing your slides has never been easier. From boardroom meetings to client pitches, this deck can be the secret weapon to leaving a lasting impression.
-
Integrating Sustainability Kpis Into Business Strategy And Reporting PPT Mockup AT
Ditch the Dull templates and opt for our engaging Integrating Sustainability Kpis Into Business Strategy And Reporting PPT Mockup AT deck to attract your audience. Our visually striking design effortlessly combines creativity with functionality, ensuring your content shines through. Compatible with Microsoft versions and Google Slides, it offers seamless integration of presentation. Save time and effort with our pre-designed PPT layout, while still having the freedom to customize fonts, colors, and everything you ask for. With the ability to download in various formats like JPG, JPEG, and PNG, sharing your slides has never been easier. From boardroom meetings to client pitches, this deck can be the secret weapon to leaving a lasting impression.
-
Interactive CSR KPI Dashboard PPT Graphics AT
Ditch the Dull templates and opt for our engaging Interactive CSR KPI Dashboard PPT Graphics AT deck to attract your audience. Our visually striking design effortlessly combines creativity with functionality, ensuring your content shines through. Compatible with Microsoft versions and Google Slides, it offers seamless integration of presentation. Save time and effort with our pre designed PPT layout, while still having the freedom to customize fonts, colors, and everything you ask for. With the ability to download in various formats like JPG, JPEG, and PNG, sharing your slides has never been easier. From boardroom meetings to client pitches, this deck can be the secret weapon to leaving a lasting impression.
-
Measure your sustainability with key performance indicators powerpoint presentation slides
Deliver an informational PPT on various topics by using this Measure Your Sustainability With Key Performance Indicators Powerpoint Presentation Slides. This deck focuses and implements best industry practices, thus providing a birds-eye view of the topic. Encompassed with fourty five slides, designed using high-quality visuals and graphics, this deck is a complete package to use and download. All the slides offered in this deck are subjective to innumerable alterations, thus making you a pro at delivering and educating. You can modify the color of the graphics, background, or anything else as per your needs and requirements. It suits every business vertical because of its adaptable layout.
-
Modern Corporate Social Responsibility KPI Dashboard PPT Mockup AT
Ditch the Dull templates and opt for our engaging Modern Corporate Social Responsibility KPI Dashboard PPT Mockup AT deck to attract your audience. Our visually striking design effortlessly combines creativity with functionality, ensuring your content shines through. Compatible with Microsoft versions and Google Slides, it offers seamless integration of presentation. Save time and effort with our pre-designed PPT layout, while still having the freedom to customize fonts, colors, and everything you ask for. With the ability to download in various formats like JPG, JPEG, and PNG, sharing your slides has never been easier. From boardroom meetings to client pitches, this deck can be the secret weapon to leaving a lasting impression.
-
Key Sustainability Kpis For Reducing Carbon Footprint Goals PPT Structure AT
Ditch the Dull templates and opt for our engaging Key Sustainability Kpis For Reducing Carbon Footprint Goals PPT Structure AT deck to attract your audience. Our visually striking design effortlessly combines creativity with functionality, ensuring your content shines through. Compatible with Microsoft versions and Google Slides, it offers seamless integration of presentation. Save time and effort with our pre-designed PPT layout, while still having the freedom to customize fonts, colors, and everything you ask for. With the ability to download in various formats like JPG, JPEG, and PNG, sharing your slides has never been easier. From boardroom meetings to client pitches, this deck can be the secret weapon to leaving a lasting impression.
-
Measure Sustainability Key Performance Indicators PPT Sample AT
Step up your game with our enchanting Measure Sustainability Key Performance Indicators PPT Sample AT deck, guaranteed to leave a lasting impression on your audience. Crafted with a perfect balance of simplicity, and innovation, our deck empowers you to alter it to your specific needs. You can also change the color theme of the slide to mold it to your companys specific needs. Save time with our ready-made design, compatible with Microsoft versions and Google Slides. Additionally, its available for download in various formats including JPG, JPEG, and PNG. Outshine your competitors with our fully editable and customized deck.
-
Sustainability Metrics And Kpis Measuring Environmental Business Performance PPT Designs AT
Do not compromise on a template that erodes your messages impact. Introducing our engaging Sustainability Metrics And Kpis Measuring Environmental Business Performance PPT Designs AT complete deck, thoughtfully crafted to grab your audiences attention instantly. With this deck, effortlessly download and adjust elements, streamlining the customization process. Whether you are using Microsoft versions or Google Slides, it fits seamlessly into your workflow. Furthermore, it is accessible in JPG, JPEG, PNG, and PDF formats, facilitating easy sharing and editing. Not only that you also play with the color theme of your slides making it suitable as per your audiences preference.
-
Measuring Progress Sustainability Kpis And Reporting PPT Slides AT
While and your and presentation and may and contain and top-notch and content, and if and it and lacks and visual and appeal, and you and are and not and fully and engaging and your and audience. and Introducing and our and Measuring and Progress and Sustainability and Kpis and And and Reporting and PPT and Slides and AT and deck, and designed and to and engage and your and audience. and Our and complete and deck and boasts and a and seamless and blend and of and Creativity and and and versatility. and You and can and effortlessly and customize and elements and and and color and schemes and to and align and with and your and brand and identity. and Save and precious and time and with and our and pre-designed and template, and compatible and with and Microsoft and versions and and and Google and Slides. and Plus, and its and downloadable and in and multiple and formats and like and JPG, and JPEG, and and and PNG. and Elevate and your and presentations and and and outshine and your and competitors and effortlessly and with and our and visually and stunning and 100 and percent and editable and deck.