


The generic value chain powerpoint presentation slide template




Try Before you Buy Download Free Sample Product
 Impress Your
 Audience
 100%
100% Editable
 Save Hours
 of Time


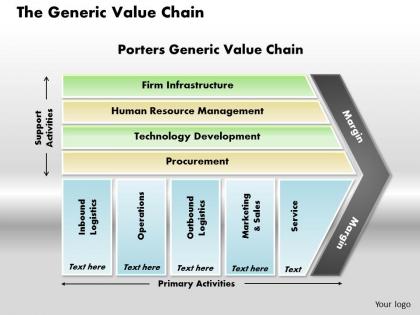
Here is our generic value chain PowerPoint Slide. As we all know that there is a chain of events which occur in a company right from the procurement of raw materials to the delivery of goods as well as the post sales service. This chain is made up of 9 steps and the process can be changed in any of the nine steps to add further value to the final product. So, here are we presenting our beautifully designed value chain info graphic slide. The first 4 are the support activities i.e. firm infrastructure, human resource management, technology development and procurement and the remaining 5 i.e. inbound logistics, operations, outbound logistics, marketing and sales, service are the primary activities. Both, the primary as well as the secondary activities are necessary for the firm to survive. So, there is importance of all the activities in a firm which help in achieving the goals of the firm. So, quickly download and start using this amazing PPT Slide Design. Feel absolutely gleeful with our The Generic Value Chain Powerpoint Presentation Slide Template. Be assured of excellent fortune.
People who downloaded this PowerPoint presentation also viewed the following :
The generic value chain powerpoint presentation slide template with all 5 slides:
Rise above the din with our The Generic Value Chain Powerpoint Presentation Slide Template. Your thoughts will grow above it all.
FAQs for The generic value chain powerpoint
The key components of a generic value chain include inbound logistics, operations, outbound logistics, marketing and sales, service, procurement, technology development, human resource management, and firm infrastructure. These interconnected activities streamline business processes by optimizing resource allocation, enhancing operational efficiency, and improving customer experiences, ultimately delivering competitive advantage and sustainable profitability for organizations across industries.
Value chain analysis helps identify cost reduction opportunities by examining each activity's cost structure, resource utilization, and efficiency levels across primary and support functions. Through systematic evaluation, organizations can pinpoint redundancies, eliminate non-value-adding processes, and optimize resource allocation, with many companies finding that streamlining procurement, production, and logistics activities delivers significant operational savings and enhanced competitive positioning.
Technology revolutionizes generic value chains by automating operations, enhancing data analytics, streamlining supply chain management, and improving customer relationship systems. Through AI and IoT integration, manufacturers and retailers achieve faster production cycles, reduced operational costs, and superior customer experiences, while enabling real-time decision-making that delivers significant competitive advantages.
Manufacturing value chains emphasize physical processes like inbound logistics, operations, and outbound logistics, while service-based chains focus on human capital, technology infrastructure, and customer relationship management. Manufacturing companies prioritize supply chain optimization and production efficiency, whereas service industries like banks or consulting firms emphasize knowledge management, service delivery, and customer experience enhancement.
PowerPoint templates for value chain presentations offer consistent formatting, professional design, time-saving efficiency, and clear visual structure that enhances audience comprehension. These templates streamline complex process mapping by providing pre-designed frameworks, standardized layouts, and strategic visual elements, with many organizations finding that professional templates ultimately deliver more impactful stakeholder communications and faster presentation development.
Businesses can customize generic value chain templates by modifying activity categories, adding industry-specific processes, adjusting resource allocations, and incorporating unique operational workflows. Companies in manufacturing, retail, and financial services often tailor primary activities like operations and marketing while enhancing support functions, ultimately creating strategic frameworks that reflect their competitive advantages and operational realities.
Common mistakes include overcomplicating diagrams with excessive detail, failing to quantify cost and value at each stage, neglecting competitive benchmarking, and presenting static analysis without improvement recommendations. Many organizations find that successful value chain presentations focus on 3-4 critical activities, use clear visual hierarchies, and connect each stage to specific business outcomes, ultimately delivering actionable insights rather than theoretical frameworks.
A value chain framework supports strategic planning by identifying competitive advantages, analyzing cost structures, and revealing optimization opportunities across primary and support activities. Through systematic evaluation of operations, organizations streamline processes, enhance customer value delivery, and allocate resources more effectively, with many finding that this comprehensive approach ultimately delivers improved margins and sustainable market positioning.
A value chain PowerPoint template should include sequential process boxes with directional arrows, clear activity labels for primary and support functions, customizable color coding for different departments, and visual hierarchy through consistent typography and spacing. These elements streamline complex business operations by enhancing clarity, enabling stakeholder alignment, and facilitating strategic discussions, with many organizations finding that well-designed templates accelerate decision-making processes.
Presenters can effectively communicate value chain insights by using clear visual frameworks, highlighting key performance metrics, demonstrating cost-benefit relationships, and connecting activities to competitive advantages. Through structured templates and data visualization, stakeholders can easily understand operational dependencies, resource allocation impacts, and strategic opportunities, while presenters maintain engagement by focusing on actionable outcomes and measurable business improvements.
A high-quality value chain PowerPoint template should include customizable process flow diagrams, editable text boxes for each activity stage, color-coded sections for primary and support activities, and data visualization elements like charts and metrics dashboards. These features enable organizations to clearly map their operational processes, identify cost drivers and efficiency opportunities, and present strategic analyses to stakeholders, ultimately delivering enhanced clarity in process optimization and competitive positioning.
A generic value chain template facilitates collaboration by providing a standardized framework for cross-functional teams to visualize processes, identify interdependencies, and align on strategic priorities across departments. This shared visualization enables teams to streamline communication, coordinate resource allocation more effectively, and identify optimization opportunities collectively, ultimately enhancing operational efficiency and strategic decision-making.
Global supply chains significantly expand the generic value chain model by distributing primary and support activities across multiple countries, creating opportunities for cost optimization, specialized expertise, and market access while introducing complexity in coordination, risk management, and quality control. This geographic dispersion enables companies to leverage comparative advantages in different regions, with manufacturing often moving to lower-cost countries and R&D concentrating in innovation hubs, ultimately delivering competitive advantages through strategic resource allocation.
Case studies enhance value chain presentations by providing real-world validation, demonstrating practical applications across different industries, and showcasing measurable outcomes at each chain stage. These concrete examples enable audiences to visualize implementation strategies, understand potential challenges and solutions, while ultimately delivering credible proof of concept that transforms theoretical frameworks into actionable business intelligence.
Organizations measure value chain effectiveness through key performance indicators like cost reduction percentages, cycle time improvements, quality metrics, customer satisfaction scores, and return on investment calculations. Many companies implement dashboard systems tracking operational efficiency, supplier performance, and delivery timelines, while conducting regular benchmarking against industry standards, ultimately enabling data-driven optimization and sustained competitive advantage.
-
Best Representation of topics, really appreciable.
-
Awesome use of colors and designs in product templates.