


Value Chain Analysis Powerpoint Presentation Slides





Try Before you Buy Download Free Sample Product
 Impress Your
 Audience
 100%
100% Editable
 Save Hours
 of Time


Introducing content-ready presentation for business professionals on value chain analysis PowerPoint presentation slides. These ready-made demand chain PPT illustrations help you to add value to your products and services. The more value you create, the more people will be attracted to buy products from you at a good price. Our predesigned porter’s value chain model presentation templates cover all the necessary slides such as expense chain analysis framework, marketing & sales, services, technology development, cost advantage, differentiator advantage, financial comparison, etc. Our supply chain management PPT template builds a competitive advantage by delivering maximum value for the least possible total cost. This expense chain analysis PowerPoint show can be put to use in other templates as well such as strategic management, inventory management, demand forecasting, marketing strategy, GVC, value chain management capability, product lifecycle, inbound logistics, strategic planning, human resources development, business value proposition, brand cost chain and supply chain management. Download our value chain analysis PowerPoint presentation templates!. Attract bigger crowds with our Value Chain Analysis Powerpoint Presentation Slides. More folks will frequent your events.
People who downloaded this PowerPoint presentation also viewed the following :
Content of this Powerpoint Presentation
Slide 1: This slide introduces Value Chain Analysis with imagery. State your company name and get started.
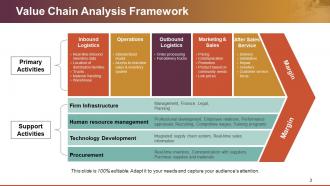
Slide 2: This slide presents Value Chain Analysis Framework showing- Primary Activities, Support Activities.
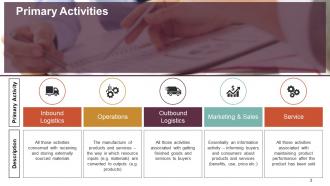
Slide 3: This slide showcases Primary Activities with Description. We have mentioned 5 primary activities. You can make use of these or add your own.
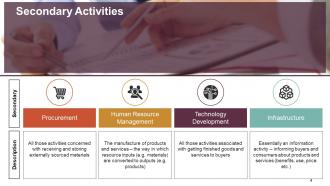
Slide 4: This slide showcases Secondary Activities with Description involving- Procurement, Human Resource Management, Technology Development, Infrastructure.
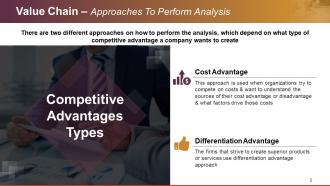
Slide 5: This slide shows Value Chain – Approaches To Perform Analysis with Cost Advantage and Differentiation Advantage.
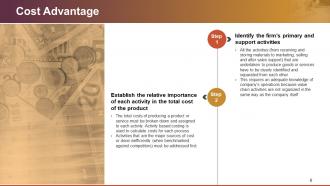
Slide 6: This slide shows 2 steps to Cost Advantage- Step 1 Identify the firm’s primary and support activities, Step 2 Establish the relative importance of each activity in the total cost of the product.
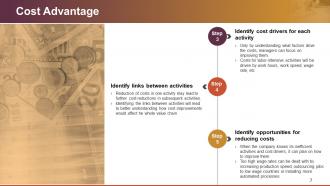
Slide 7: This is also a Cost Advantage slide showing- Step 3 Identify cost drivers for each activity, Step 4 Identify links between activities, Step 5 Identify opportunities for reducing costs.
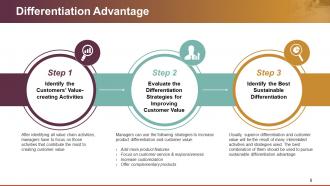
Slide 8: This slide shows Differentiation Advantage. We have mentioned 3 steps here, you can use them or add your own as per need.
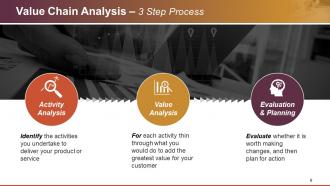
Slide 9: This slide showcases Value Chain Analysis – 3 Step Process- Activity Analysis, Value Analysis, Evaluation & Planning.
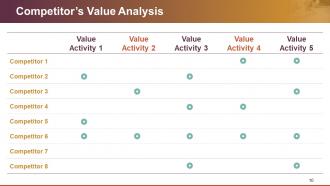
Slide 10: This is Competitor’s Value Analysis slide to state the following 2 factors- Value Activity, Competitor.
Slide 11: This is a Coffee Break image slide to halt. Alter/ modify as per need.
Slide 12: This slide forwards to Graphs &Charts. Alter/ modify as per need.
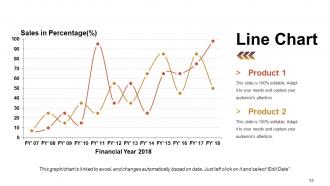
Slide 13: This slide presents a Line Chart for showcasing product/ company growth, comparison etc.
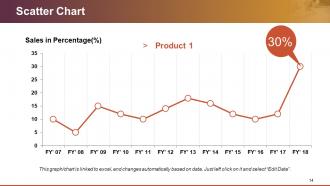
Slide 14: This is a Scatter Chart slide to present product/ entity comparison, specifications etc.
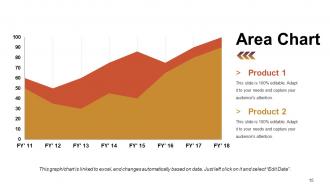
Slide 15: This is an Area Chart slide to present product/ entity comparison, information etc.
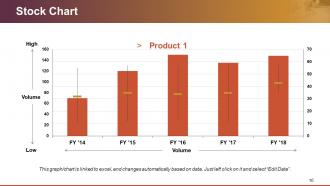
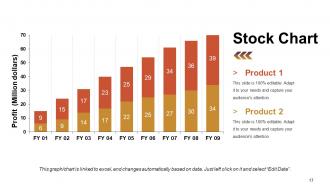
Slide 16: This slide presents a Stock Chart to show product/ entity growth, comparison etc.
Slide 17: This slide also presents a Stock Chart to show product/ entity growth, comparison etc.
Slide 18: This slide is titled Additional Slides to move forward. You can change the slide content as per need.
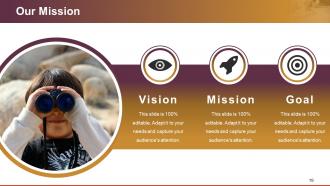
Slide 19: This slide showcases Our Mission. Show your company mission and goals here.
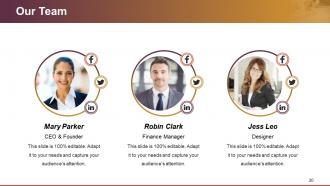
Slide 20: This slide showcases Our Team with Name and Designation to fill.
Slide 21: This is Our Goal slide. State your goals here.
Slide 22: This is an About Us slide. State team/ company specifications here.
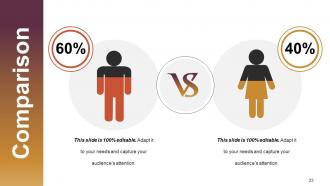
Slide 23: This is a Comparison slide to show comparison of two entities.
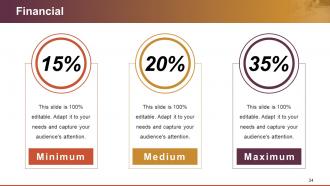
Slide 24: This is a Financial score slide to show financial aspects here.
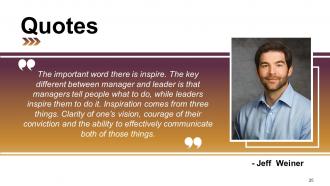
Slide 25: This is a Quotes slide to convey message, beliefs etc.
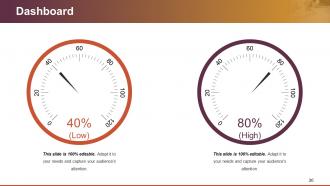
Slide 26: This is Dashboard slide to show information in percentages etc.
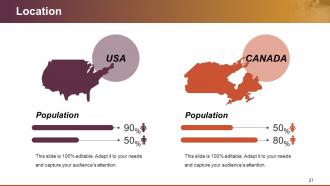
Slide 27: This is a Location slide with different country map imagery.
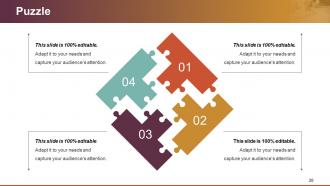
Slide 28: This is a Puzzle pieces image slide to show information, specifications etc.
Slide 29: This is a Target image slide. State targets, etc. here.
Slide 30: This is a Circular image slide. State specifications, information here.
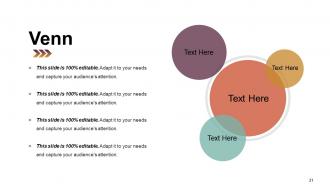
Slide 31: This is a Venn diagram image slide to show information, specifications etc.
Slide 32: This is a Mind map image slide to show information, specifications etc.
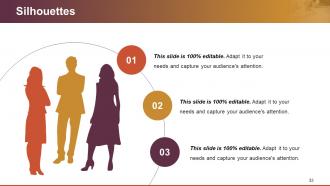
Slide 33: This is a Silhouettes slide to show information, specifications etc.
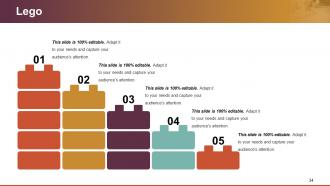
Slide 34: This is a LEGO slide with text boxes to show information.
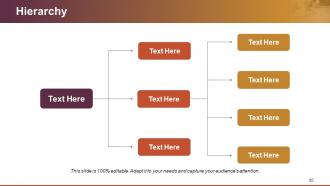
Slide 35: This is a Hierarchy slide to show information, organization structural specifications etc.
Slide 36: This is a Bulb or Idea image slide to show information, ideas, specifications etc.
Slide 37: This slide shows a Magnifying Glass with imagery and text boxes to go with.
Slide 38: This is a Thank You slide with Address# Street number, city, state, Email Address, Contact Numbers.
Value Chain Analysis Powerpoint Presentation Slides with all 38 slides:
Hatred diminishes greatly with our Value Chain Analysis Powerpoint Presentation Slides. They eliminate foolish differences.


FAQs for Value Chain Analysis
So there's two main buckets - primary activities (the stuff that directly touches your product/customers) and support activities. Primary includes inbound logistics, operations, outbound logistics, marketing & sales, and service. Pretty straightforward. Support activities are procurement, tech development, HR, and infrastructure. This is where it gets interesting though - most companies don't realize how much the support side is quietly draining their margins. I've seen businesses shocked when they actually map it out. Start by listing each activity and figure out what you're spending vs. what value you're actually getting back.
So basically you want to map out everything your company does from start to finish. There are two buckets - primary stuff (the core work like getting materials, making things, shipping, sales, customer service) and support stuff that makes it all possible (HR, tech, buying supplies, general management). I'd just walk through your whole process step by step, honestly. Start with raw materials and go all the way to helping customers after they buy. Then figure out what directly touches your product vs what supports those processes. Oh and don't be vague - instead of just "marketing," break it into actual tasks like generating leads or creating content. It's pretty straightforward once you dive in.
So value chain analysis basically breaks down every step in your business to show you where money's going down the drain. Map out your main activities first - that's the easy part. Then look at support stuff like HR or IT. What you're hunting for are redundant steps, bottlenecks, anything that doesn't actually add value. Most companies find way more waste than they expected, which is kinda depressing but also great? You'll also spot which tasks could be outsourced cheaper or automated. The cool thing is seeing how different activities connect - those connections usually reveal the best cost-cutting opportunities. Honestly, you'll probably find something worth fixing in the first hour.
Honestly, value chain analysis is way more useful than it sounds. Break down everything you do - operations, marketing, customer service, plus the behind-the-scenes stuff like HR and tech. Figure out which 2-3 things you're genuinely better at than your competition. Those are your goldmines. Pour more money and attention into making those areas even stronger. The stuff you suck at? Maybe outsource it or just accept it's not your thing. I mean, you can't be amazing at everything, right? Focus on what competitors can't easily steal from you.
Tech basically multiplies your efficiency everywhere - automating boring stuff, giving you real-time data, making departments actually talk to each other. Way better than spreadsheet hell, trust me. AI can forecast demand, IoT sensors track inventory, cloud platforms connect suppliers straight to production schedules. But here's the thing - don't just grab whatever's trendy. Map out where you're bleeding time or cash first. Then find specific tools for those exact problems. I've seen too many companies buy shiny tech that doesn't solve their actual bottlenecks.
Start by mapping out all your business activities - both the main stuff and support functions. This shows you exactly where you're crushing it and where you're... well, not. Honestly, it's pretty eye-opening once you see it all laid out. Then use those insights to guide your strategy. Double down on what you do best, fix the weak spots dragging you down. The whole point is matching your strategic moves to what the analysis actually tells you about your strengths and gaps. Makes way more sense than just guessing, right?
Look, you want metrics that actually tell you if something's working, not just fancy numbers for reports. Track supplier reliability and inventory turnover for inbound stuff. Quality rates and unit costs matter most for operations. Delivery times and shipping accuracy for outbound - that's pretty straightforward. Marketing is where it gets messy though. Skip the vanity metrics and focus on lead conversion rates and what it costs to get customers. Response times and satisfaction scores work for service. Honestly, just pick 2-3 solid ones per area and actually make decisions with them instead of collecting data for no reason.
So manufacturing is pretty straightforward - you've got materials coming in, getting transformed, then shipped out. Services are way messier though. Like when you go to a doctor or hire a consultant, the "product" is happening right there in real time through conversation and expertise. You can literally watch parts move through a factory assembly line, but with services? The value chain is all about customer interactions and knowledge sharing instead of physical stuff. Honestly, services are harder to map out because of this. For your analysis, just track where customers actually touch the business in services vs following material flows in manufacturing.
So globalization basically lets companies spread their operations everywhere to cut costs and find better talent. Raw materials from Africa, manufacturing in Asia, selling in Europe - you get the idea. It's pretty genius actually because you can chase the best deals: cheap labor here, cutting-edge tech there, closer shipping routes somewhere else. But honestly? The coordination is a nightmare. Currency swings, political drama, trying to manage teams across 12 time zones. When you're planning this stuff, figure out what absolutely needs to stay under one roof versus what you can scatter around the world.
So basically, map out everywhere you actually interact with customers and figure out what's pissing them off. Go through your whole process - logistics, operations, delivery, marketing, customer service. Maybe your product is great but your shipping updates are garbage (honestly, this drives me crazy as a customer). The trick is focusing on stuff that actually affects the customer experience, not just what makes your internal processes smoother. Walk through one customer's journey this week and you'll spot the obvious fixes. Some will be quick wins, others... well, that's a different conversation.
Honestly, the worst thing you can do is try to map out everything at once. I've watched people burn weeks on processes that literally don't matter to customers. Focus on maybe 5-7 activities that actually create value first. Another trap? Using those cookie-cutter industry benchmarks without thinking about your own situation. And definitely don't just look inward - you need to understand how customers actually see value, not just what you think matters. I learned this the hard way on a project last year. Start small, then dig deeper once you've got the basics down.
Look, value chain analysis sounds fancy but it's basically mapping out every step of your business - from getting materials to delivering to customers. Then you hunt for where you're bleeding money or missing chances to stand out. Honestly, most small businesses have like 2-3 obvious problem spots once you actually look. Just grab some paper and sketch out your main processes first. You'd be shocked what pops out immediately. It's kind of like having X-ray vision for your operations, which sounds dramatic but whatever - it works. Focus on the areas that'll give you the biggest impact without burning through cash.
So basically you map out everything your company does, then get brutally honest about what you're actually good at versus what's just eating up time and money. For each thing, ask yourself: "Does this give us a real edge, or are we just doing it out of habit?" HR, IT, logistics - that stuff's usually low-hanging fruit for outsourcing. Though honestly, sometimes even core business functions make sense if someone else is just way better at them. The whole point is doubling down on your strengths and letting specialists handle everything else. Works pretty well most of the time.
So supply chain management tracks the physical stuff - materials moving from suppliers to you to customers. Value chain analysis is different though, it examines every single activity that adds value along the way. One's about "what moves where," the other's about "how does this actually create value." Here's where it gets interesting - you can use value chain insights to make way smarter supply chain choices. Like maybe your cheapest supplier isn't actually your best supplier if they're creating bottlenecks or quality issues. It's about finding suppliers who deliver real value, not just rock-bottom prices.
So value chain analysis is basically mapping out your whole business process - from getting raw materials to dealing with customers after they buy. Once you've got that mapped out, you can see where you're wasting money or where things get stuck. The cool part is spotting gaps where nobody's solving customer problems yet. I always think it's like detective work for your business processes, honestly. You'll also notice where competitors are weak or where new tech could give you a real advantage. Just start by sketching out how things work now, then get creative about improving each step.
-
Really helpful
-
Easily Editable.
-
It saves your time and decrease your efforts in half.