


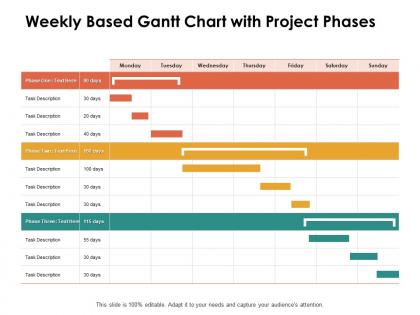
Weekly based gantt chart with project phases ppt powerpoint presentation gallery outline




Try Before you Buy Download Free Sample Product
 Impress Your
 Audience
 100%
100% Editable
 Save Hours
 of Time


Generate intensity of focus with our Weekly Based Gantt Chart With Project Phases Ppt Powerpoint Presentation Gallery Outline. Concentrate on the job.
People who downloaded this PowerPoint presentation also viewed the following :
Weekly based gantt chart with project phases ppt powerpoint presentation gallery outline with all 2 slides:
Be the first choice for the job with our Weekly Based Gantt Chart With Project Phases Ppt Powerpoint Presentation Gallery Outline. Impress folks with your exemplary credentials.

FAQs for Weekly based gantt chart with project phases ppt powerpoint
Weekly Gantt charts deliver enhanced project visibility, improved resource allocation, better deadline tracking, streamlined team coordination, and clearer task dependencies within shorter timeframes. These visual tools enable project managers to quickly identify bottlenecks, adjust workflows, and maintain momentum, with many organizations finding that weekly planning cycles significantly improve project delivery rates and team accountability.
A weekly Gantt chart improves team collaboration by providing shared visibility into task dependencies, deadlines, and individual responsibilities, while enabling real-time progress tracking and resource coordination. This transparency helps teams identify potential bottlenecks early, streamline handoffs between departments, and maintain alignment on priorities, ultimately delivering faster project completion and enhanced accountability across all team members.
**INPUT**: What tools or software are best suited for creating weekly Gantt charts? **OUTPUT**: Popular weekly Gantt chart tools include Microsoft Project, Asana, Trello, Monday.com, and Smartsheet, each offering different features for project visualization and team collaboration. These platforms streamline project management by enabling real-time updates, resource allocation tracking, and milestone monitoring, with many organizations finding that cloud-based solutions like Asana and Monday.com deliver enhanced accessibility and team coordination. [Word count: 58 words]
Determining appropriate detail levels involves balancing task granularity with chart readability, focusing on deliverables that can be completed within the weekly timeframe, and considering your audience's needs. Start with major milestones and break them into 1-3 day tasks, with project managers finding that including dependencies, resource assignments, and critical path activities delivers optimal clarity while avoiding overwhelming stakeholders with excessive micro-tasks.
Strategies for adjusting weekly Gantt charts during timeline shifts include reassessing task dependencies, reallocating resources, compressing critical path activities, and implementing parallel task execution where feasible. Project managers can streamline these adjustments by leveraging dynamic scheduling software, maintaining buffer time allocations, and conducting rapid stakeholder alignment sessions, ultimately enabling teams to maintain project momentum while adapting to changing requirements and delivery expectations.
Color-coding enhances weekly Gantt chart effectiveness by improving visual clarity, enabling instant status recognition, and streamlining team communication across complex projects. Through strategic color assignments for priorities, departments, or completion stages, project managers can quickly identify bottlenecks, resource conflicts, and critical deadlines, ultimately delivering faster decision-making and enhanced operational efficiency.
Common mistakes include overloading the chart with excessive detail, failing to account for realistic time buffers, neglecting team capacity constraints, and poor task dependency mapping. These oversights can lead to unrealistic schedules and project delays, with many project managers finding that maintaining clear visual hierarchy, regular updates, and stakeholder communication ultimately delivers more accurate planning and enhanced team coordination.
Weekly Gantt charts provide moderate detail for tactical planning, offering more granularity than monthly charts while maintaining broader perspective than daily charts. They excel at tracking weekly milestones, resource allocation, and team coordination across projects lasting several weeks to months, with many project managers finding that weekly views balance detailed task management with strategic oversight, ultimately enabling better decision-making and workflow optimization.
Stakeholders can leverage weekly Gantt charts for streamlined progress reporting, milestone tracking, resource allocation updates, risk identification, and transparent communication across teams. These visual tools enable project managers to deliver concise status reports, while executives and team members can quickly assess project health, upcoming deadlines, and potential bottlenecks, ultimately enhancing decision-making and accountability.
Tasks should be prioritized in weekly Gantt charts by considering deadline urgency, resource dependencies, stakeholder impact, and strategic business value. Organizations typically sequence critical path activities first, followed by resource-constrained tasks, with many project managers finding that this approach streamlines workflow coordination, minimizes bottlenecks, and ultimately delivers more predictable project outcomes across teams.
Milestones in weekly Gantt charts serve as critical checkpoints that mark key deliverables, project phases, or decision points within the week's timeline. They enhance project visibility by providing clear progress indicators, enabling teams to track accomplishments, identify potential delays, and maintain momentum, with many organizations finding that strategic milestone placement significantly improves weekly planning accuracy and stakeholder communication.
Weekly Gantt charts can be effectively integrated with Agile and Scrum methodologies through sprint planning visualization, backlog tracking, and iterative timeline management. This strategic combination enables teams to maintain Agile flexibility while delivering enhanced project visibility, streamlined stakeholder communication, and improved resource allocation, with many software development teams finding that hybrid approaches ultimately deliver faster delivery cycles and better project outcomes.
Best practices for sharing weekly Gantt charts with remote teams include using cloud-based project management platforms, establishing regular update schedules, ensuring real-time collaboration capabilities, providing mobile accessibility, and implementing clear notification systems. These approaches streamline communication by enabling instant visibility into project progress, facilitating seamless updates across time zones, and maintaining team alignment, with many distributed organizations finding that centralized digital access ultimately enhances accountability and project coordination.
Feedback can be effectively incorporated by scheduling regular check-ins, using collaborative software that allows real-time updates, and establishing clear communication channels for reporting delays or resource needs. Through digital Gantt tools, project managers can quickly adjust timelines, reallocate resources, and modify dependencies based on team input, ultimately ensuring projects stay aligned with realistic capacity and emerging priorities.
Weekly Gantt charts enable tracking of task completion percentages, milestone achievement rates, resource utilization efficiency, schedule variance, and budget adherence metrics. These visual tools streamline project monitoring by highlighting critical path deviations, team productivity patterns, and deadline compliance across departments, with many organizations finding that weekly tracking delivers enhanced accountability, faster issue resolution, and improved stakeholder communication.
No Reviews