


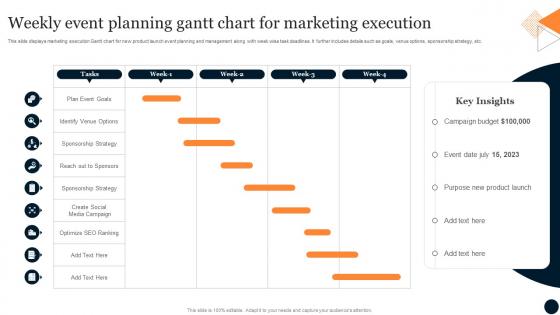
Weekly Event Planning Gantt Chart For Marketing Execution




Try Before you Buy Download Free Sample Product
 Impress Your
 Audience
 100%
100% Editable
 Save Hours
 of Time


This slide displays marketing execution Gantt chart for new product launch event planning and management along with week wise task deadlines. It further includes details such as goals, venue options, sponsorship strategy, etc.
People who downloaded this PowerPoint presentation also viewed the following :
Weekly Event Planning Gantt Chart For Marketing Execution with all 6 slides:
Use our Weekly Event Planning Gantt Chart For Marketing Execution to effectively help you save your valuable time. They are readymade to fit into any presentation structure.





FAQs for Weekly Event Planning Gantt Chart
So basically, you've got your tasks listed down the left side, then these horizontal bars show how long each one takes across the timeline up top. The arrows between tasks? Those are dependencies - super helpful once you figure them out since they show what has to finish before other stuff can start. There are also little diamond shapes for milestones and sometimes resource info if it's fancy. I'd say just focus on the timeline and bars first - that's like 80% of what you need. The rest clicks pretty fast after that. Oh, and the dependency arrows can get messy on big projects but they're honestly the most useful part.
Gantt charts are basically your project's visual timeline - shows you what's happening when and helps catch bottlenecks before they kill your deadline. The best part? You can see which tasks depend on others and who's doing what. I swear it's like having GPS for your project. Everyone stays on the same page because they can actually see the big picture instead of just guessing. Oh, and you'll know right away if you're falling behind schedule. My advice is start simple though - just map out your main milestones and key dependencies first, then build from there.
Yeah totally! Sprint-level Gantt charts work way better than trying to map your whole project. I'd stick to 2-4 week chunks and update them constantly - priorities change like crazy in Agile. Honestly, I've seen people get way too attached to their original timelines and it never ends well. Use them to show dependencies between user stories and track sprint goals, but keep it simple. The whole point is they're living documents that'll shift around. Don't overthink it though - when things change (and they will), just roll with it.
Honestly, Microsoft Project is still king if you're dealing with crazy complex stuff and dependencies. But most people don't need all that - Asana's been my go-to lately since my whole team lives in there anyway. Monday.com's solid too for collaboration. TeamGantt has a free version that's pretty decent, or you could just grab an Excel template if you're keeping it simple. Oh, and Smartsheet's like the middle ground - way easier than Project but more features than the basic ones. I'd probably just start with whatever tool your team already knows, then see if you actually need the fancy scheduling stuff later.
Honestly, Gantt charts are a lifesaver for keeping everyone on the same page. You can see exactly who's doing what and when, plus how all the tasks connect to each other. No more awkward meetings where people are like "wait, what's your timeline again?" The best part? You'll spot problems way before they blow up. When someone falls behind, you can instantly see which other tasks get affected. I'd update yours every week during standup meetings - keeps everyone aligned and people can jump in early if they see potential issues coming. Way better than scrambling last minute.
Don't get crazy detailed from the start - you'll waste hours tweaking every little thing when stuff inevitably changes. Dependencies are huge though, that's where projects actually fall apart. I've seen people treat Gantt charts like some sacred document, but really you should be updating them all the time. Build in buffer time too because something will definitely go sideways. Start high-level with your major milestones first. Oh and don't let anyone convince you it's some binding contract - it's just a planning tool that should evolve with your project.
Honestly, Gantt charts are perfect for this. Color-code your team members first - makes everything way clearer. Then you'll spot overlapping bars instantly when someone's double-booked. The visual timeline shows exactly where people are swamped versus sitting around doing nothing (which always bugs me). Just drag tasks around to even things out. Short bursts work better than marathon sessions anyway. You can also catch bottlenecks before they wreck your whole project. Look for those obvious gaps and overlaps - they tell the whole story.
Honestly, once you go digital with Gantt charts, there's no going back. Updates happen instantly - no more erasing and redrawing when timelines shift. Your whole team sees the same live version, which is huge for staying in sync. Comments, notifications, dependency tracking... all that stuff you can't do on paper. Resource management becomes way easier too. I'd say start with just one smaller project to test it out - you'll probably be surprised how much smoother things run. The time savings alone make it worth switching.
Honestly, Gantt charts are amazing for this stuff. Those visual bars show exactly where each task should be right now, and you can see progress filling up in real time. When something's falling behind, it's super obvious because you're comparing what was planned vs what's actually happening. The deadline tracking part is built right in too - dependencies, bottlenecks, all that drama becomes visible before it screws you over. Oh, and definitely start with your big milestones first, then work backwards from your final deadline. Trust me, it's like having a project dashboard that actually tells the truth for once!
Honestly, group your related tasks into bigger summary phases first - it'll hide all the messy details underneath. Color coding is your best friend here; assign different colors to teams or work types so you can actually see what's going on. Filter out the done stuff or narrow down to specific timeframes when things get crazy cluttered. Here's what I learned the hard way though - sometimes you just gotta split massive projects into separate charts by phase or team instead of shoving everything into one monster view. People's brains can only handle so much info at once, you know? Show them what they need to see, not every tiny subtask.
Look, dependencies are what make Gantt charts actually useful instead of just pretty timelines. Link your tasks together and you'll see exactly how one delay screws up everything downstream - design runs long, then dev gets pushed, testing gets squeezed, the whole thing cascades. Super helpful for catching bottlenecks early. Plus you can spot your critical path tasks, the ones that'll tank your deadline if they slip. Honestly took me way too long to figure this out when I started doing project management. Trust me, connect those dependencies from day one.
Honestly, Gantt charts are lifesavers for dealing with stakeholders. You can show project timelines and progress without drowning people in boring spreadsheets. Perfect for meetings - just point to what's on track versus what's behind. Those colorful progress bars? Stakeholders eat that stuff up, makes them think their money's actually doing something lol. Just keep updating it regularly or you'll be awkwardly explaining why nothing matches reality. Oh, and always print a backup copy because your laptop will definitely crash right when you need it most.
Yeah definitely! Gantt charts play nice with pretty much any framework you're using. Waterfall's obviously a natural fit, but they work great for Agile sprint planning too. Even Scrum teams use them for release planning - honestly didn't expect that when I first started using them. Tools like Asana or Monday make the whole integration thing super smooth. Just don't get too attached to your timeline if you're doing Agile stuff since things'll move around constantly. Kanban works well for longer roadmaps too. Start basic and build up from there once your team's comfortable.
Dude, color coding is a game changer - your brain just processes it way faster. Like, I'll use blue for dev work, green for testing, red for anything that's gonna make me panic if it's late. Your team can instantly see what's theirs vs what marketing or whoever is supposed to handle. Honestly saved my butt so many times when stakeholders ask random questions in meetings. Just don't go crazy with it though. Stick to maybe 3-4 colors or it looks like a rainbow threw up on your screen.
Honestly, I'd update it weekly or whenever something major shifts. Don't just shuffle dates around to make it look pretty - we both know that never fools anyone. Track what's actually happening vs what you planned. Color coding is your friend here - makes it super obvious what's done, what's dragging, and what's on track. Keep your stakeholders posted when stuff changes or gets delayed. The key thing though? Don't let it turn into one of those dusty files nobody touches. If it doesn't reflect reality, people will just ignore it completely.
-
If you have visited their site and failed to find the products, try reaching the customer service because it will be the case that you didn't use the search bar well.
-
“Ample and amazing variety of templates available, really helpful for making professional PPT for day to day workings.”