


Aj seven staged icons timeline diagram powerpoint template





Try Before you Buy Download Free Sample Product
 Impress Your
 Audience
 100%
100% Editable
 Save Hours
 of Time


PowerPoint presentation is the quickest and easiest way to create and present visuals. Bearing this in mind we have prepared PPT slide designs of Aj seven staged icons to elucidate the concept of business timeline formation. Further using this presentation template you can build quality presentation for seven stage timeline, RM road mapping, AP timeline text info graphics for text representation, six staged app diagram and many more. Our experts have designed ready to use seven staged icons timeline diagram especially for executives involved in conceptualizing AJ seven staged business timeline information.
People who downloaded this PowerPoint presentation also viewed the following :
Content of this Powerpoint Presentation
Description:
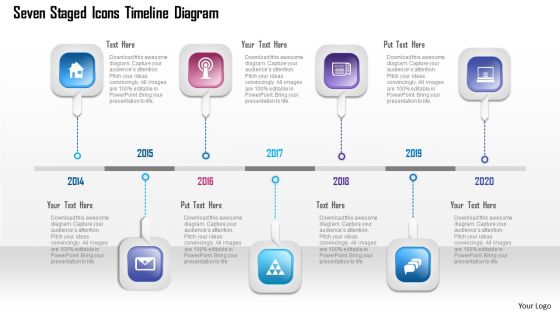
The image is of a PowerPoint slide titled "Seven Staged Icons Timeline Diagram," which is designed to showcase a timeline or roadmap of events, milestones, or steps in a process from the year 2014 to 2020. Each year is marked by a different icon and has a space for descriptive text to explain what the icon represents or the milestone achieved in that year.
Here's a breakdown of the text elements:
2014: Features an icon that resembles a home or location, which could indicate a starting point or foundation establishment. The text placeholder says "Your Text Here," prompting you to add specific details related to the year.
2015 to 2020: Each year is represented by a unique icon, including a location pin, a triangle inside a circle, a newspaper icon, a document icon, and a Wi-Fi signal icon. These could represent different focus areas or achievements for each year, like location expansion, launching a new initiative, getting media coverage, publishing important documents, and enhancing digital presence.
Placeholder Text: Repeated "Put Text Here" and "Your Text Here" prompts indicate where to customize the slide with specific information relevant to each year's achievements or objectives.
Use Cases:
This slide can be adapted for use in various industries to outline key historical milestones, future goals, or progress timelines:
1. Real Estate:
Use: Showcasing property development milestones.
Presenter: Real Estate Developer.
Audience: Investors, and stakeholders.
2. Marketing:
Use: Laying out marketing campaign timelines.
Presenter: Marketing Manager.
Audience: Marketing team, clients.
3. Technology:
Use: Illustrating product development stages.
Presenter: Product Manager.
Audience: Development team, investors.
4. Publishing:
Use: Highlighting significant publication dates.
Presenter: Editor-in-Chief.
Audience: Editorial team, publishers.
5. Non-Profit:
Use: Detailing project milestones and outreach expansion.
Presenter: Program Director.
Audience: Donors, volunteers, beneficiaries.
6. Education:
Use: Mapping out curriculum development or institutional milestones.
Presenter: Academic Coordinator.
Audience: Faculty, educational stakeholders.
7. Healthcare:
Use: Timeline of healthcare initiatives and facility upgrades.
Presenter: Healthcare Administrator.
Audience: Medical staff, board members.
Aj seven staged icons timeline diagram powerpoint template with all 5 slides:
Our Aj Seven Staged Icons Timeline Diagram Powerpoint Template don't allow you to feel helpless. They are adept at finding appropriate answers.
FAQs for Aj seven staged icons timeline
The AJ seven-staged icons timeline diagram PowerPoint template features customizable visual icons, sequential milestone tracking, professional color schemes, editable text placeholders, and scalable design elements. These components streamline project presentations by enabling clear progress visualization, enhanced stakeholder communication, and strategic timeline management, with many organizations finding that structured visual timelines significantly improve project transparency and team alignment.
The seven-staged timeline diagram enhances presentation clarity by organizing complex processes into sequential, digestible segments, enabling audiences to follow project phases, strategic rollouts, or development cycles more effectively. This visual approach streamlines information delivery, reduces cognitive load, and improves audience retention, with many presenters finding that structured timelines ultimately deliver stronger stakeholder engagement and clearer decision-making outcomes.
Seven-staged timeline diagrams prove most beneficial for comprehensive project lifecycles, strategic planning phases, product development cycles, organizational transformation initiatives, and multi-quarter business rollouts. These templates excel in scenarios requiring detailed milestone tracking, such as software implementation projects, market expansion strategies, or compliance programs, where stakeholders need clear visualization of sequential progress and interdependent phases to ensure successful execution.
This timeline template effectively represents project phases, strategic planning processes, product development cycles, employee onboarding sequences, and compliance implementation stages. Through its seven-stage structure, organizations can visualize complex workflows like software deployment, marketing campaign rollouts, or operational transformations, while enabling stakeholders to track progress milestones and maintain strategic alignment throughout extended business initiatives.
Icons in the timeline enhance audience engagement by creating visual anchors that make complex information more digestible, memorable, and scannable at a glance. Through strategic visual storytelling, presentations become more compelling and accessible, with many organizations finding that icon-driven timelines significantly improve audience retention, accelerate comprehension, and ultimately deliver more impactful communication experiences across diverse stakeholder groups.
Yes, the AJ seven-staged timeline diagram PowerPoint template offers extensive customization capabilities, allowing you to modify colors, icons, text, and visual elements to align with specific industry requirements and branding guidelines. This flexibility enables organizations across sectors like healthcare, manufacturing, financial services, and technology to adapt the template for project phases, product launches, or strategic planning processes, ultimately delivering professional presentations that resonate with industry-specific audiences and stakeholders.
When utilizing this template, consider visual hierarchy through consistent sizing and spacing, color contrast for readability, and logical flow that guides viewers left-to-right through your timeline stages. Balance textual content with white space, ensure icons align with corresponding content themes, and maintain brand consistency through fonts and colors, while adapting the seven stages to match your specific project milestones or process requirements.
Presenters can ensure visual appeal by using consistent color schemes, balanced spacing, clear typography, and strategic icons that reinforce each stage's content while maintaining readability. The seven-staged format enables systematic information flow through logical progression, with each timeline element delivering concise key points, ultimately creating presentations that engage audiences while communicating complex processes effectively across business and educational contexts.
Best practices for integrating timeline diagrams include maintaining consistent visual branding, strategically positioning the timeline within your presentation flow, using progressive disclosure to reveal stages incrementally, and ensuring clear connections to surrounding content through transitional slides. These approaches enhance audience comprehension by creating seamless narrative continuity, reducing cognitive overload, and reinforcing key milestones, with many organizations finding that well-integrated timelines significantly improve stakeholder engagement and project understanding.
The seven-stage format enhances chronological storytelling by providing structured progression through extended narratives, complex project lifecycles, detailed process flows, and comprehensive strategic initiatives. This approach enables presenters to maintain audience engagement across longer timelines while ensuring logical flow, with many organizations finding that seven stages effectively balance thoroughness with digestibility, ultimately delivering clearer communication and stronger stakeholder buy-in.
PowerPoint, Google Slides, Keynote, and Canva are the primary tools for editing AJ seven-staged timeline diagrams, with each offering drag-and-drop functionality, color customization, and text modification capabilities. These platforms enable seamless template personalization through intuitive interfaces, with many businesses finding that PowerPoint delivers the most comprehensive editing features for professional presentations.
The timeline adapts seamlessly through responsive design features, scalable graphics, and flexible formatting that ensures clarity across different screen sizes and projection methods. Virtual presentations benefit from enhanced zoom capabilities and clickable navigation, while in-person formats leverage high-resolution printing and large-scale visibility, with many organizations finding that this dual compatibility streamlines presentation preparation and delivers consistent messaging regardless of audience format.
Common pitfalls include overcrowding slides with excessive text, using inconsistent formatting across timeline elements, selecting poor color contrasts that reduce readability, and failing to align content with audience expertise levels. Many presenters also rush through complex timelines without adequate explanation, ignore logical sequence flow, and neglect to emphasize critical milestones, ultimately delivering confusing narratives rather than clear, actionable insights that drive decision-making.
Color choice significantly impacts timeline effectiveness by enhancing visual hierarchy, improving information retention, creating emotional responses, and ensuring accessibility across diverse audiences. Strategic color implementation helps distinguish timeline phases, guide viewer attention through chronological flow, and reinforce brand consistency, with many organizations finding that thoughtful color palettes increase audience engagement and comprehension rates by up to forty percent.
User feedback consistently highlights this template's intuitive design, clear visual progression, and professional appearance that enhances presentation clarity and audience engagement. Many presenters find that the seven-stage format streamlines complex project timelines, strategic planning processes, and milestone tracking, while the customizable icons and color schemes enable seamless branding integration, ultimately delivering more impactful presentations.
-
Very unique and reliable designs.
-
Topic best represented with attractive design.