


Diapositives de présentation PowerPoint sur le plan d'affaires annuel






Try Before you Buy Download Free Sample Product
 Impress Your
 Audience
 100%
100% Editable
 Save Hours
 of Time


Gérez efficacement votre entreprise en utilisant ces diapositives de présentation PowerPoint sur le plan d'affaires annuel. À l'aide de ce modèle de plan d'affaires PPT, un gestionnaire peut définir les stratégies afin de répondre à ses besoins actuels et futurs. Générez un rapport KPI en fonction des revenus, des coûts de vente, de la marge brute, des dépenses d'exploitation, etc. en utilisant le jeu complet de présentation PowerPoint de planification financière. Vous pouvez mettre en évidence les défis qui restreignent le chemin pour atteindre votre cible, à l'aide de diapositives PPT de planification stratégique. Cette présentation PowerPoint de plan d'affaires annuel contient une feuille de route avec laquelle vous pouvez expliquer le cycle économique pour augmenter la productivité. Vous pouvez présenter les différents indicateurs de performance clés à l'aide des diapositives visuelles PPT du plan opérationnel de l'entreprise. À l'aide de la plate-forme de présentation PowerPoint des initiatives de plan d'exploitation, vous pouvez créer un rapport sur la planification et la mise en œuvre financières. Par conséquent, téléchargez ce modèle PPT de planification stratégique prêt à l'emploi et gérez votre organisation avec une vision plus cohérente.
People who downloaded this PowerPoint presentation also viewed the following :
Contenu de cette présentation Powerpoint
Diapositive 1 : Cette diapositive présente le plan d'affaires annuel. Indiquez le nom de votre entreprise et commencez.
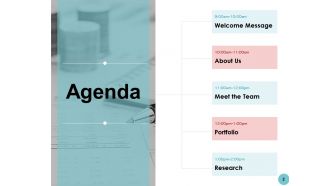
Diapositive 2 : Cette diapositive présente l'ordre du jour. Ajoutez votre agenda et utilisez-le.
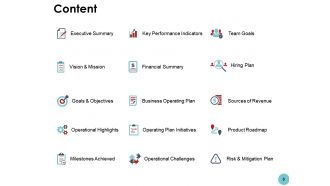
Diapositive 3 : Cette diapositive présente le contenu qui présente davantage le résumé, la vision et la mission, les buts et objectifs, les faits saillants opérationnels, le jalon atteint, l'indicateur de performance clé, le résumé financier, les défis opérationnels, les initiatives du plan d'exploitation, le plan d'exploitation de l'entreprise, l'équipe, les objectifs, l'embauche , Plan, Succès des revenus, Feuille de route du produit, Plan de risque et de migration.
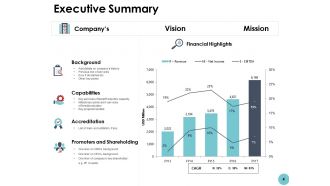
Diapositive 4 : Cette diapositive présente un résumé décrivant le contexte, les capacités, l'accréditation, les promoteurs et les actionnaires.
Diapositive 5 : Cette diapositive affiche Notre vision et notre mission avec des images et du texte connexes.
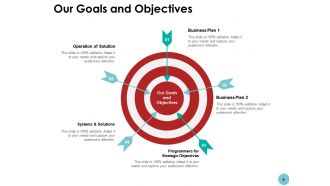
Diapositive 6 : Cette diapositive présente nos buts et objectifs avec les étapes suivantes : plan d'affaires, système et solutions, programmeurs pour les objectifs stratégiques, plan d'affaires, exploitation de la solution.
Diapositive 7 : Cette diapositive représente les faits saillants opérationnels sous forme de chronologie.
Diapositive 8 : Cette diapositive présente les jalons atteints avec des zones de texte.
Diapositive 9 : Cette diapositive présente les indicateurs de performance clés qui présentent davantage - le coût des marchandises vendues, le score net du promoteur, le pourcentage de ventes perdues pour les clients actifs, le taux de rétention des clients, les ventes journalières exceptionnelles.
Diapositive 10 : Cette diapositive montre le résumé financier : Plan de base vs. Plan étendu.
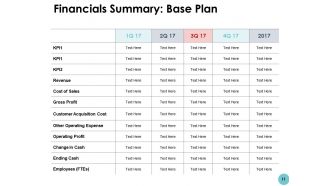
Diapositive 11 : Cette diapositive présente le résumé financier : Plan de base.
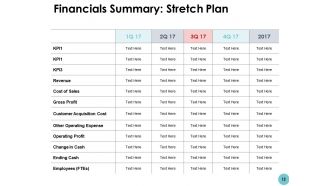
Diapositive 12 : Cette diapositive représente le résumé financier : Plan étendu.
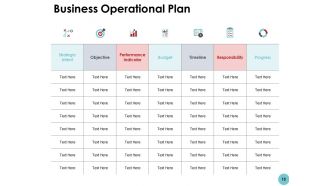
Diapositive 13 : Cette diapositive affiche le plan opérationnel de l'entreprise avec les catégories suivantes : intention stratégique, objectif, indicateur de performance, budget, calendrier, etc.
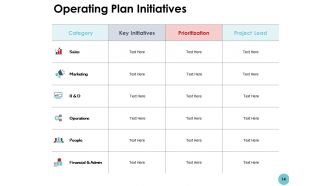
Diapositive 14 : Cette diapositive présente les initiatives du plan opérationnel sous forme de tableau avec les catégories, les initiatives clés, les priorités et les chefs de projet.
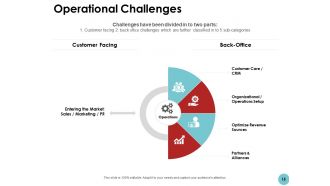
Diapositive 15 : Cette diapositive s'intitule Défis opérationnels et présente davantage : orientation client, back-office, opérations, entrée sur le marché, ventes / marketing / relations publiques, service client / CRM, partenaires et alliances, configuration organisationnelle / opérationnelle, optimisation des sources de revenus .
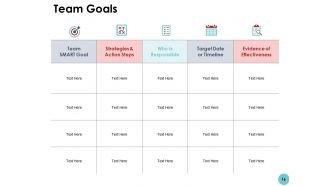
Diapositive 16 : Cette diapositive montre les objectifs de l'équipe avec un tableau pour différents domaines.
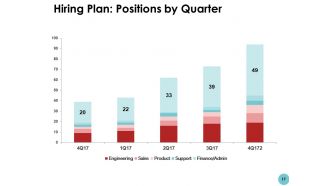
Diapositive 17 : Cette diapositive présente le plan de recrutement : postes par trimestre sous forme de graphique avec des catégories telles que : Finance, support, produit et marketing.
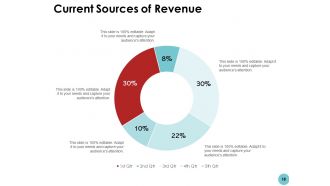
Diapositive 18 : Cette diapositive montre les sources de revenus actuelles avec des zones de texte supplémentaires.
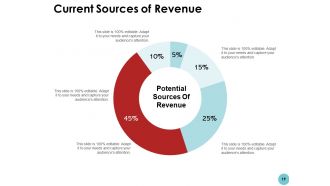
Diapositive 19 : Cette diapositive présente les sources potentielles de revenus à l'aide d'un diagramme circulaire.
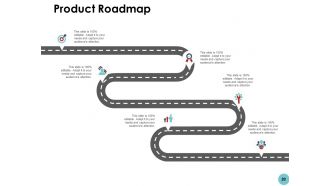
Diapositive 20 : Cette diapositive affiche la feuille de route du produit avec des zones de texte pour afficher des informations.
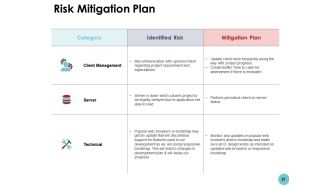
Diapositive 21 : Cette diapositive représente le plan d'atténuation des risques avec catégorie, risque identifié et plan d'atténuation.
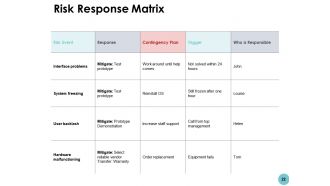
Diapositive 22 : Cette diapositive présente la matrice de réponse aux risques avec les catégories suivantes : événement à risque, réponse, déclencheur, etc.
Diapositive 23 : Cette diapositive affiche les icônes du plan d'affaires annuel.
Diapositive 24 : Cette diapositive est intitulée Diapositives supplémentaires pour aller de l'avant.
Diapositive 25 : Ceci est la diapositive Notre équipe avec les noms et la désignation.
Diapositive 26 : Ceci est la diapositive À propos de nous pour montrer les spécifications de l'entreprise, etc.
Diapositive 27 : Il s'agit d'une diapositive d'emplacement avec des cartes pour afficher les données relatives à différents emplacements.
Diapositive 28 : Il s'agit d'une diapositive de comparaison pour indiquer la comparaison entre les produits, les entités, etc.
Diapositive 29 : Il s'agit d'une diapositive de la chronologie. Afficher les informations relatives à la période de temps ici.
Diapositive 30 : Cette diapositive rappelle environ 15 minutes de pause-café.
Diapositive 31 : Cette diapositive affiche une idée créative pour énoncer une nouvelle idée et une idée créative.
Diapositive 32 : Il s'agit d'une diapositive Puzzle avec des zones de texte pour afficher des informations.
Diapositive 33 : Il s'agit d'une diapositive Venn avec des zones de texte.
Diapositive 34 : Il s'agit d'une diapositive financière. Montrez vos trucs liés aux finances ici.
Diapositive 35 : Cette diapositive montre Mind Map pour représenter des entités.
Diapositive 36 : Cette diapositive affiche Post it. Postez vos notes importantes ici.
Diapositive 37 : Il s'agit d'une diapositive de citations pour mettre en évidence ou indiquer quelque chose de spécifique.
Diapositive 38 : Cette diapositive montre un graphique à secteurs avec des données en pourcentage.
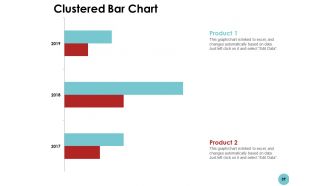
Diapositive 39 : Cette diapositive présente un graphique à barres groupées avec une comparaison de deux produits.
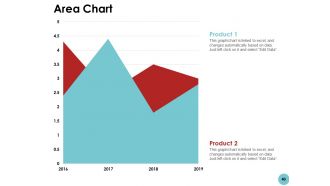
Diapositive 40 : Cette diapositive affiche un graphique en aires avec une comparaison de deux produits.
Diapositive 41 : Ceci est une diapositive de remerciement avec adresse, numéros de contact et adresse e-mail.
Diapositives de présentation Powerpoint du plan d'affaires annuel avec les 41 diapositives :
Identifiez les influences créatives avec nos diapositives de présentation Powerpoint du plan d'affaires annuel. Utilisez-les efficacement pour améliorer votre image.
-

Annual Business Plan
-
Agenda
-
Content
-
Executive Summary
-

Our Vision and Mission
-
Our Goals and Objectives
-
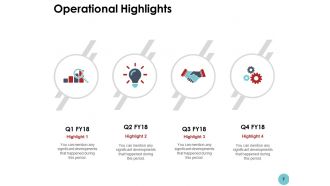
Operational Highlights
-
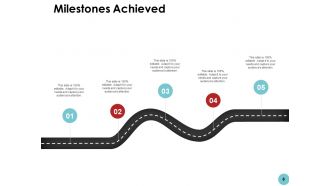
Milestones Achieved
-
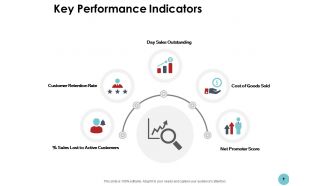
Key Performance Indicators
-
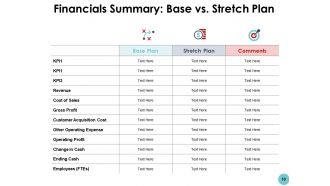
Financials Summary Base vs Stretch Plan
-
Financials Summary Base Plan
-
Financials Summary Stretch Plan
-
Business Operational Plan
-
Operating Plan Initiatives
-
Operational Challenges
-
Team Goals
-
Hiring Plan Positions by Quarter
-
Current Sources of Revenue
-
Current Sources of Revenue
-
Product Roadmap
-
Risk Mitigation Plan
-
Risk Response Matrix
-
Annual Business Plan Icons Slide
-

Additional slides
-

Our team
-

About Us
-

Location
-

Comparison Between Men and Women s Habits
-
Timeline
-

Coffee Time
-

Creative Idea
-
Puzzle
-
Venn
-

Financial
-

Mind Map
-

Post it
-

Quotes
-

Pie Chart
-
Clustered Bar Chart
-
Area Chart
-

Thank You
FAQs for Annual business plan
Look, you really just need five things for your business plan. Financial projections showing where money's coming from. Measurable goals with real numbers attached. Who exactly you're selling to and why they'd pick you over the competition. Then figure out how you'll actually deliver everything - that's your operations piece. Oh, and competitive positioning so you know where you fit. Most people way overcomplicate this stuff honestly. Just take last year's numbers if you have them and work forward from there. I always tell people to focus on the revenue streams first since that's what actually matters.
Take your big 3-5 year goals and work backwards - what has to happen this year to stay on track? I always start there because it's way easier than trying to plan everything at once. Break each major objective into concrete stuff you can actually measure over 12 months. Then build your budget and team priorities around those annual milestones instead of just chasing whatever shiny opportunity pops up. Here's the thing though - every big initiative should connect to at least one strategic goal. If it doesn't? Honestly, you're probably wasting time and should cut it.
Okay so you need three main things: revenue projections, expense budgets, and cash flow statements. Break your revenue down by product or customer type - makes tracking way easier later. Fixed costs like rent and salaries go in one bucket, variable stuff like marketing in another. Cash flow is honestly where most people mess up though. It's not about profit on paper, it's about actual money moving around. Also do a break-even analysis if you're launching something new - my cousin learned that one the hard way. Set up quarterly check-ins so you can pivot when things inevitably go sideways.
Honestly, I'd block out a whole afternoon for this - trust me, you'll get sucked into data rabbit holes otherwise. Start with industry reports and competitor analysis, plus whatever customer feedback you've got lying around. Focus on both the big picture stuff (economic changes, new regulations) and what's happening in your specific market. Pick your top 3-5 trends that actually matter. Then figure out which ones are opportunities vs threats for your business specifically. The key is weaving those insights into your actual strategic plans and budget decisions. Otherwise you're just doing research for research's sake, which is pretty useless.
Think of KPIs as your business scorecard - they tell you if you're winning or just treading water. Focus on 3-5 metrics that actually matter for your main goals. Revenue growth, customer numbers, stuff like that. Honestly, I've watched people create these massive dashboards with 20+ metrics that just collect digital dust. Monthly check-ins are where the real value is. When the numbers shift, you can pivot your approach instead of waiting till year-end to discover you're completely off course. Just make sure you're tracking things you can actually control - there's nothing worse than stressing over metrics you can't influence.
Honestly, I'd check it monthly if you can manage it - markets are crazy right now and things change fast. Quarterly reviews are the bare minimum, but those should be the deep ones where you're actually shifting strategies and moving money around based on what's working. Monthly check-ins can be super light, just eyeballing your key numbers and flagging anything weird. Set those calendar reminders right now though, because I swear this stuff always gets pushed aside when you're drowning in daily fires. Trust me, waiting a full quarter to look at your plan is how you end up scrambling to catch up.
Honestly, just stick with what your team already knows first - Google Workspace or Microsoft 365 are perfect for collaborative docs where everyone can jump in at once. Miro's amazing for those brainstorming sessions (I swear my team got obsessed with it last year). You could also try Asana or Monday.com to track who's doing what and when stuff's due. Don't overthink it though - adding one new tool max is probably smart so you don't overwhelm everyone during planning season.
Look at this year's numbers first - what worked, what didn't, and figure out why. I'd bump up your targets maybe 10-20% from where you are now. Those crazy ambitious goals just burn everyone out, honestly. Quarterly check-ins are clutch so you can pivot if things go sideways. For each big metric, I do two numbers: the "holy shit we crushed it" goal and the "okay we can live with this" baseline. Break everything down into stuff your team can actually do day-to-day. Stick those goals somewhere you'll actually see them and check progress monthly.
Honestly, the worst thing you can do is get way too excited about revenue numbers while totally lowballing your costs. I've watched so many people crash and burn on this one. Also don't be vague - saying "boost sales 20%" means nothing if you can't explain how. Oh, and here's something people always do wrong: they write this beautiful plan then never look at it again. Like, what's the point? Set realistic deadlines and make sure someone's actually responsible for each thing, or it'll just sit there collecting dust.
Figure out what scares you most first - money stuff, operations falling apart, market shifts, whatever. Build your mitigation plans right into quarterly goals and budget from the start. I always set aside 5-10% as a "shit happens" fund because it does. Check in regularly throughout the year since everything changes constantly. Document your plans so when things go wrong (and they will), your team isn't scrambling to figure out what to do. The whole trick is being ahead of problems instead of always chasing them after they've already hit.
Honestly, I'd start with an anonymous survey - people are way more honest when they can't be traced back. One-on-ones with your direct reports are gold too, that's where the real insights come out. Focus groups are solid but take forever to set up (learned that the hard way). Quick Slack polls work great for fast pulse checks on specific stuff. Different people share feedback differently, so maybe try 2-3 approaches? Some folks will never speak up in groups but they'll write paragraphs in a survey. Cast the wide net first with something simple, then get specific.
Honestly, tech saves me so much time with planning stuff. I swear by Asana for breaking everything into actual tasks with due dates - way better than my old messy to-do lists. Financial software handles all the forecasting automatically too, which is huge because Excel makes me want to cry. Your team can update everything in real-time on cloud platforms, so you're not constantly wondering what's actually happening. The tracking features are probably my favorite part though. Just pick one decent project management tool first instead of going crazy trying to digitize your entire life at once.
Honestly, doing a SWOT analysis before setting your annual goals is like checking yourself in the mirror before leaving the house - you need that reality check. It makes you face what you're actually good at and what's totally broken. Plus you'll spot opportunities worth chasing and threats that could blindside you. I mean, without it you're just throwing money at random stuff and hoping something works. The whole point is using those insights to decide where your budget and energy should actually go this year. Short sentences work too.
Honestly, competitor research is where I get weirdly excited - it's pure detective work! Check out their pricing, product launches, and how they position themselves. You'll spot gaps they're missing or find ways to stand out. Their strengths show you what you're up against. Weaknesses? That's your opening. Use all this to set realistic revenue goals and figure out which customers to chase first. Oh, and make a simple comparison chart - sounds boring but you'll reference it constantly. It really helps refine your pitch and decide where to focus your energy.
Track stuff that actually matters - monthly recurring revenue, customer acquisition cost, retention rates. Cash flow too obviously. Pipeline conversions are clutch, and honestly don't sleep on project milestones because they'll save your ass when things get crazy later in the year. Pick maybe 5-7 metrics max that actually impact your business. Skip the vanity numbers that just make slides look pretty. Set up something simple you can check monthly - doesn't need to be fancy. Just make sure your team knows what they're supposed to be moving.
No Reviews