


Business progress report good ppt example


Try Before you Buy Download Free Sample Product
 Impress Your
 Audience
Editable
of Time


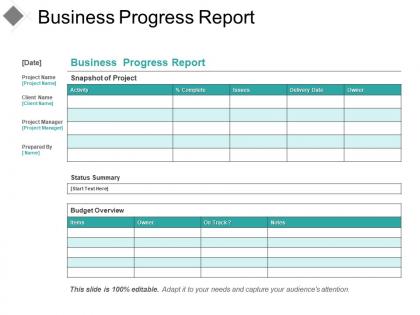
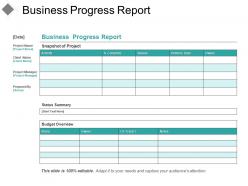
Calculate the overall budget of your project by using Business Progress Report Good PPT Example. You can highlight several development programs in this business development presentation template like sales, finance, mergers and acquisitions, marketing, strategic management, and proposal management. In this business progress PowerPoint graphic, you can mention different features such as communication skills, negotiation skills, strategic, project management, and decision-making skill that help to increase the financial probabilities of your business. Employ the business acceleration PPT slideshow to illustrate various processes such as financial planning, operational planning, business modeling, consolidation and reporting, analysis, and monitoring of key performance indicators. With the help of a business growth PowerPoint layout, you can support and implement diverse growth opportunities. There are various high-quality icons present in the slide with which you can make your presentation reliable and engaging. Therefore, create more plans and strategies to attain your target by downloading our ready-to-use business performance management PPT theme.
People who downloaded this PowerPoint presentation also viewed the following :
Business progress report good ppt example with all 5 slides:
Get away from it all with our Business Progress Report Good Ppt Example. They can even create an entertaining break.

FAQs for Business progress report
Key components of an effective business progress report include executive summary, performance metrics against goals, financial highlights, milestone achievements, and strategic challenges with solutions. These elements work together by providing stakeholders comprehensive visibility into operations, enabling data-driven decision making, and maintaining accountability, with many organizations finding that structured reporting ultimately enhances strategic alignment and accelerates business outcomes.
Business progress reports enhance decision-making by providing real-time data visibility, identifying performance gaps, and highlighting emerging trends across departments. These comprehensive documents enable executives to allocate resources strategically, pivot operations when needed, and capitalize on growth opportunities, with many organizations finding that regular progress reporting reduces costly delays and improves competitive positioning.
Business progress reports should include revenue growth, profit margins, customer acquisition costs, employee productivity rates, and market share expansion. These metrics enable organizations to track operational efficiency, financial health, and strategic positioning, with many companies finding that combining leading indicators like customer satisfaction scores with lagging indicators delivers comprehensive insights for informed decision-making.
Business progress reports should typically be generated monthly for operational metrics, quarterly for strategic initiatives, and annually for comprehensive organizational assessments, with frequency varying based on project complexity and stakeholder needs. Many organizations find that combining weekly team updates with monthly executive summaries and quarterly board presentations delivers optimal visibility while enabling timely course corrections and strategic adjustments.
Visual data representation transforms business progress reports by making complex metrics easily digestible through charts, graphs, infographics, and dashboards that highlight trends, patterns, and key performance indicators at a glance. These visual elements streamline decision-making processes, enhance stakeholder engagement, and enable faster identification of opportunities and challenges, with many organizations finding that visual reports significantly improve comprehension and strategic response times.
Businesses can tailor progress reports by customizing content depth, metrics focus, and presentation format for each stakeholder group's priorities and decision-making needs. Executive summaries emphasize strategic outcomes and ROI for leadership, while detailed operational data serves project managers, and simplified visual dashboards engage investors, ultimately ensuring each audience receives relevant insights that drive informed decisions and sustained engagement.
Common pitfalls include overwhelming readers with excessive data, lacking clear executive summaries, presenting metrics without context, failing to address variances from targets, and omitting actionable next steps. These issues often result from focusing on data collection rather than storytelling, with many organizations finding that streamlined reports emphasizing key insights, trend analysis, and strategic implications deliver far greater stakeholder engagement and decision-making value.
Technology streamlines reporting through automated data collection, real-time dashboard creation, cloud-based collaboration platforms, and integrated analytics tools that eliminate manual processes. These software solutions enable organizations to generate comprehensive reports faster, reduce human errors, and provide stakeholders with instant access to critical business metrics, ultimately delivering enhanced operational efficiency and more informed strategic decision-making.
Setting milestones and benchmarks creates structured accountability frameworks, enables precise performance measurement, facilitates strategic course corrections, and provides stakeholders with clear progress visibility. These tracking mechanisms streamline project management by establishing measurable targets, identifying potential bottlenecks early, and maintaining team alignment, ultimately delivering enhanced operational efficiency and competitive advantage across organizations.
Qualitative data enhances quantitative metrics by providing context, explaining trends, and revealing customer sentiments that numbers alone cannot capture. Through employee feedback, customer testimonials, and market observations, organizations gain deeper insights into performance drivers, identify operational challenges, and understand stakeholder experiences, ultimately delivering more comprehensive reporting and strategic decision-making capabilities.
Business progress report presentations should include clear executive summaries, visual data representations, milestone tracking, actionable insights, and stakeholder-specific recommendations. These elements enhance audience engagement by simplifying complex information, highlighting key achievements, and providing strategic direction, with many organizations finding that structured presentations accelerate decision-making and strengthen stakeholder confidence.
Cultural differences significantly influence progress reports through varying communication styles, hierarchical expectations, detail preferences, and decision-making approaches across regions. While Western businesses often favor direct, concise reporting with clear accountability metrics, Asian markets typically emphasize relationship context and consensus-building narratives, with many multinational organizations finding that culturally adapted reporting structures enhance stakeholder engagement and strategic alignment globally.
Follow-up actions should include addressing stakeholder feedback, implementing recommended adjustments to project timelines or resources, scheduling regular check-in meetings, and establishing clear accountability measures for team members. These actions ensure continuous project momentum by maintaining stakeholder engagement, enabling proactive issue resolution, and creating transparent communication channels, with many organizations finding that structured follow-up processes significantly enhance project success rates and operational efficiency.
Feedback from progress reports contributes to strategic planning by identifying performance gaps, revealing resource allocation inefficiencies, and highlighting market opportunities or threats. This data-driven insight enables organizations to adjust strategic priorities, reallocate budgets, and pivot initiatives based on actual performance metrics, with many companies finding that regular feedback loops ultimately deliver more agile decision-making and competitive positioning.
Businesses should ensure transparency by presenting comprehensive data with clear methodologies, acknowledging both achievements and challenges, and providing context for performance metrics across all operational areas. This approach builds stakeholder trust through honest reporting, enables informed decision-making, and ultimately delivers competitive advantage, with many organizations finding that transparent communication strengthens investor confidence and operational credibility.
-
Excellent template with unique design.
-
Designs have enough space to add content.